2021 - 2025 MASTER PLAN UPDATE CITY OF SOUTH BEND VENUES PARKS & ARTS 50
GInventory

Most of the City’s parks are fairly well equipped to provide adequate active recreational facilities for South Bend residents of all ages. South Bend parks contain attractive areas for walking and picnicking and nearly all have playground equipment and playfield areas such as baseball fields, softball fields and/or tennis courts.
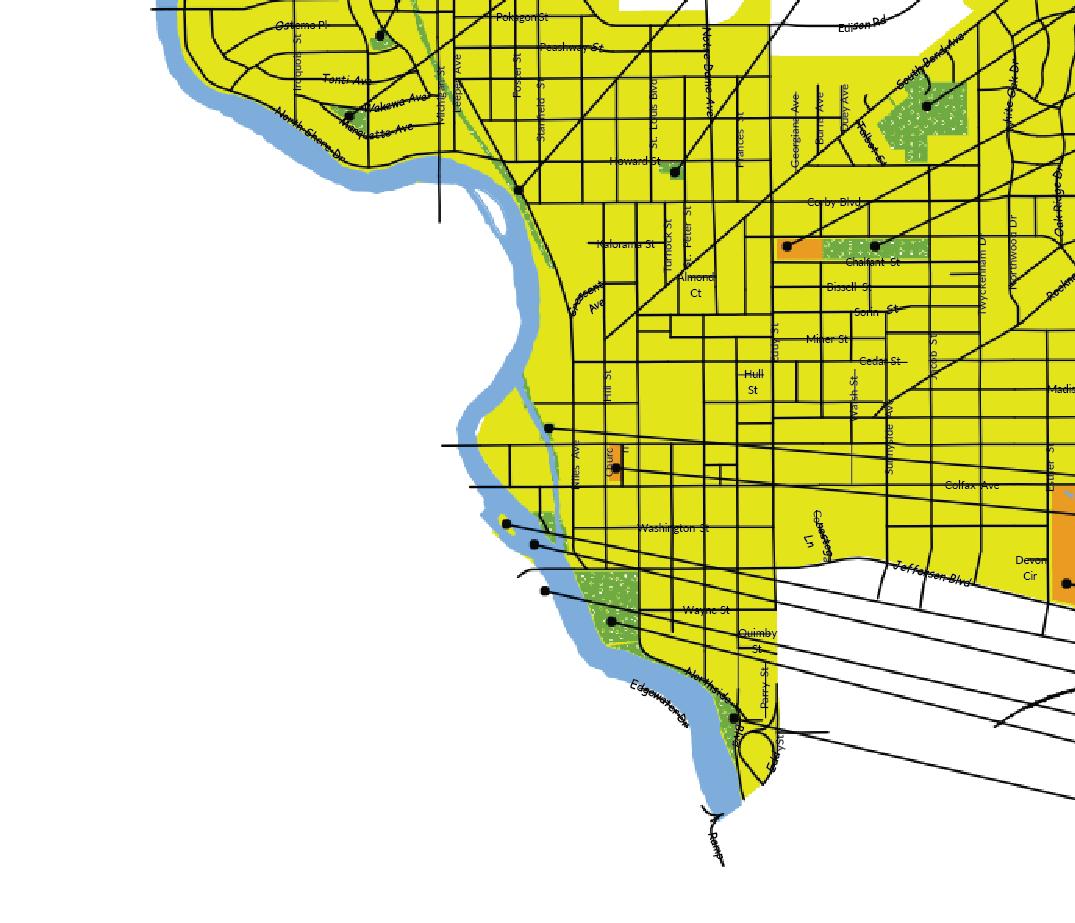
Included in this section are maps delineating the districts and the overall city of South Bend and a matrix, which summarizes the parks and recreation facilities available to South Bend residents. There are 58 public parks, playgrounds and properties encompassing approximately 1,296.28 acres in the City of South Bend ranging in size from 0.30 acres (Seitz Park) to 313.25 acres (Elbel Golf Course). The types of facilities available in each park also vary widely. As can be seen in the matrix, the activities or facilities are broken down by active outdoor or passive outdoor facilities. There are (11) community parks, (21) neighborhood parks, (17) block parks, in addition to several special park settings including three (3) golf courses.
The following review summarizes the most important aspects of each park:
In addition to the properties listed in the Inventory Matrix, the City maintains several other properties. In 1953, the Common Council adopted a resolution enabling the Park Department to provide funds in the annual budget for the care and maintenance of all cul-de-sac islands, intersection islands and street centers not previously listed as park properties. The Park Department set up this service in 1954 and will continue in ensuing years. The properties termed “traffic islands” are at the following locations:
• Garway Common at Harrow Drive
• Hampshire Drive at Harrow Drive
• Sutton Place & Hampshire
• Gotham at Norwich
• Croydon Court off Gotham
• Stanmore Court off York road
• Northhold Court off York Road
• Chaucer Court off Riding Mall Drive
• Regent Court off Riding Mall Drive
• Winslow Court off Riding Mall Drive
• Crown Court off Riding Mall Drive
• Exeter Court off Riding Mall Drive
• Oldham Court off Riding Mall Drive
• Riding Mall & Harrow Drive
• Fairfax & Kindig
• Fairfax Estates from Miami to Kindig
• Robinhood Lane
• Woodside & Twyckenham Drive
• Garland Circle off York Road
• Twyckenham Drive, Altgeld & York Road
• Ash Lane off Southeast Drive
• Fairview & St. Joseph
• Farneman & St. Joseph
• Wayne Street East of Eddy Street
• Wayne Street at Jacob
• Devon Circle & Esther
• Longfellow & South Street
• Wall, Emerson & Chester
• Belmont &Sunnyside
• Mishawaka Avenue, Louise Street to 20th Street
• Bronson & Edgewater
• Lincolnway East, Monroe & Fellows
• Rockne Drive & Cedar – Northside
• Rockne Drive & Twyckenham Drive & Cedar
• Rockne Drive & Cedar – Left Side & South Side
• Rockne Drive & Cedar – Right Side & Jacob Street
• Rockne Drive, Madison & Jacob Street
• Rockne Drive & Sunnyside
• Sunnyside & McKinley
• Campeau & Twyckenham
• Campeau & Frances to Twyckenham Drive
• Congress & Union Avenue
• Congress & Solomon Avenue
• Wakewa & Michigan Street
• Iroquois & Marquette Avenue
• Lagoon Court off Hollywood
• Inglewood Court off Lathrop
• Oakwood & Beverly Place
• Kessler Place at Kessler Boulevard
• Portage Avenue & Vassar
• Diamond & Humboldt
• Riverside Drive from Boland to Darden
• Marion Street & Michigan Street
• Marion & Leland
• Cottage grove at Grandview
• Lincolnway West & William Street
• Siebert Place
• Chapin Street – Five Islands
• Vermont Place & Kentucky
• Revere Place & Kentucky
• Belle Vista East & Wellington
• Belle Vista West & Wellington
• Lombardy North from Sample Street
• Lombardy South
• Lombardy & West Parkway Place
• Ridgeway & Lombardy
• Garden Place & Albert
• North Chicago & Western Avenue
• North Lake Street & Western Avenue
• North Kentucky & Western Avenue
• North Camden & Western Avenue
• North Bendix & Webster Avenue
• Three Islands – Bonds Avenue
• Bonds Avenue at Eclipse Place
• Bonds Avenue at Elliott Place
Along with all of the specific recommendations made for improvements to the existing parks, the City feels that renovating and updating the existing parks facilities to minimize maintenance is a high-priority now and in the future.
The renovating and updating of existing facilities should also include a concerted effort to increase accessibility to the elderly and disabled. This effort should apply to any new construction, with accessibility considered at the design stage of the proposed project. Federal and state regulations apply for what must be accessible.
Complete Recreation Facilities Matrix on the following page.


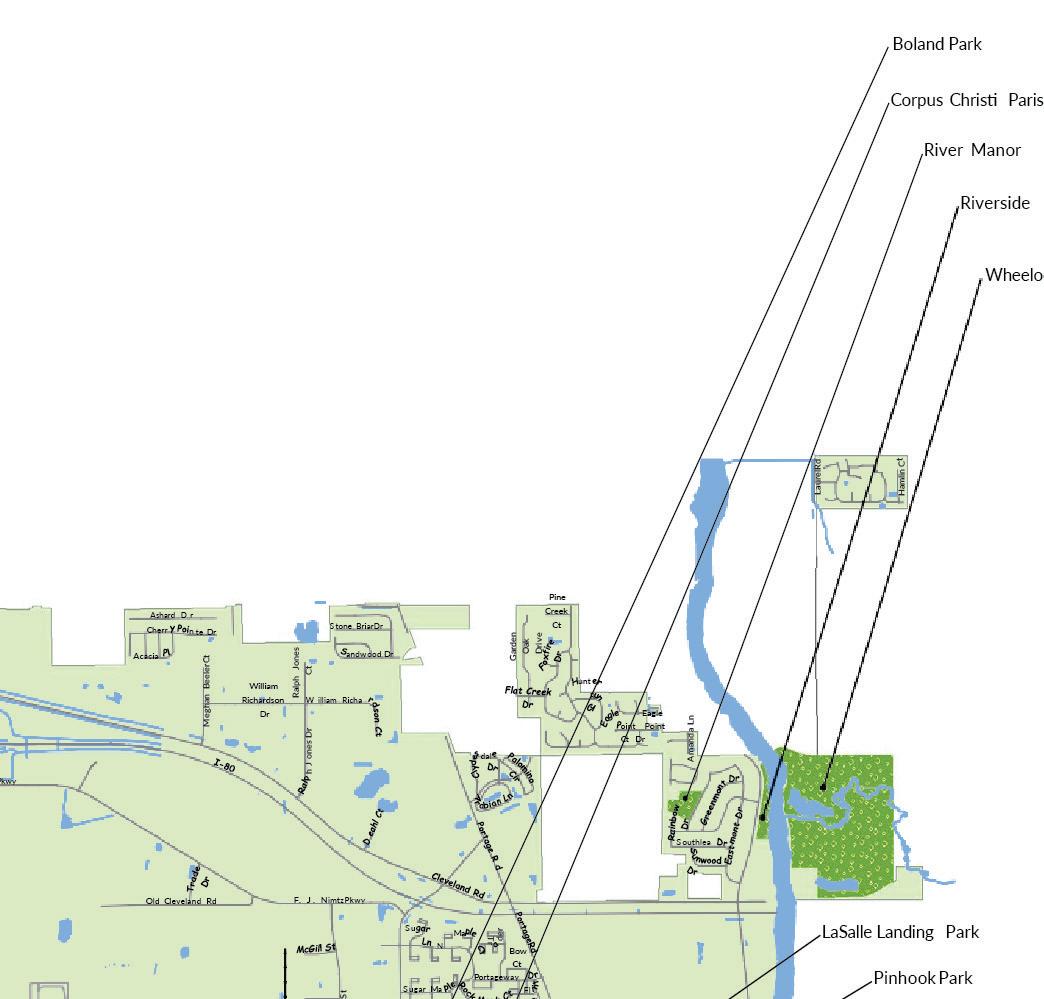

• Green - Park Properties
• Orange - School Properties


•Green - Park Properties
•Orange - School Properties


•Green - Park Properties
•Orange - School Properties


•Green - Park Properties

•Orange - School Properties


•Green - Park Properties
•Orange - School Properties

•Green - Park Properties
•Orange - School Properties


Solicitation of comprehensive feedback from the community was a key component of the needs assessment portion of the Master Planning process. Surveys, focus groups, public meetings and workshops were utilized to obtain a snapshot of public opinion and desires. During this time, comparisons with other park and recreation agencies were obtained to contrast our service levels with other communities. This ran from the spring of 2017 until the fall of the same year and closed with the completion of the staff workshops and the finalization of the identified strategic issues.


In February and March 2014, on behalf of the City of South Bend and Jones Petrie Rafinski, Public Research Group (PRG) conducted email, telephone and mail surveys in an attempt to identify South Bend’s park and recreational behaviors, wants and needs. A total of 506 randomly generated email, telephone and mail responses were obtained. Email responses were generated from desktop computers, smart phones and tablets. The goal of the survey was to produce findings that could be generalized over the entire population of the community.
In addition, a non-random self-selecting online survey was created and placed on the VPA department’s website in both English and Spanish language formats. This second sample was not combined with the primary random sample, but rather was compared to the statistically valid results for additional insight into the survey findings.
It should be noted that the 506 households responding to the random sample survey is representative of the responses of all 42,900 total households in the City of South Bend within a margin of error of plus or minus 4.5%, and a confidence level of 95%.


This survey is intended to be completed every 10 years


with the next cycle due at the beginning of 2024.
The survey contained a series of questions that were designed to measure behavior as well as perceptions by residents of South Bend regarding parks, public lands and services. There were several opportunities for participants to provide specific comments from “open end” questions.
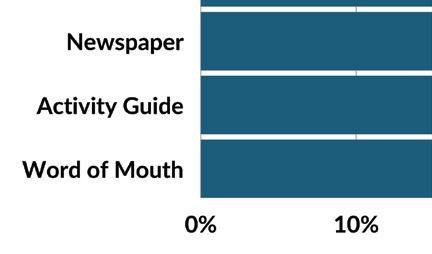
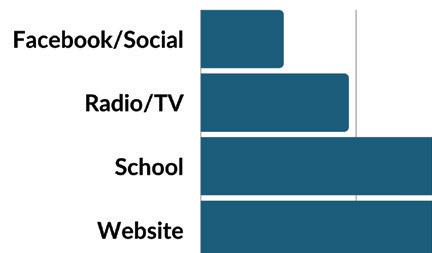
The data in the graph shows that word of mouth had the highest response rate, with 45.5% saying that word of mouth was how they heard about the parks and recreation department. The second highest was the activity guide at 34.6%, with 25.5% saying newspaper articles, 21.1% the website and 16.2% school announcements. Facebook had the lowest response rate at 5.3%.


The graph shows that 27.0% said the programs were excellent, 62.4% said they were good, 10.3% said they were fair and only .2% said they were poor. The data suggests a relatively high percentage of residents who appear to be satisfied with the programs offered by the parks and recreation department. The national average for overall satisfaction with quality of programs based on very satisfied with the value is 27%. This is very similar to the results found for South Bend.


The survey listed the top three reasons as:

•Not aware of the program (33.2%)


•Inconvenient times (32.4%)
•Fees to high (14.2%)
In terms of a national average comparison, inconvenient times is at 16% and fees to high is at 18%.


The survey listed the top five programs as:
•Community special events (42.7%)
•Music festivals & concerts (37.0%)


•East West Raceway (31.6%)
•Winter activities, skating & sled hills (26.7%)
•Fitness center (24.7%)


As you can see, fees are generally acceptable. The previous graph shows that households with children are more likely to rate current South Bend Parks and Recreation Department fees as acceptable compared to households without children. Households with kids were slightly more likely to rate fees as underpriced and slightly less likely to rate them as too high. The differences may be due to the fact that households without children are less likely to have an opinion about fees.
The random sample findings presented in the graph show that 12.8% of all households said they had pets that used the parks and facilities, 71.7% said adults and 48.6% said children. The findings suggest that parks are not just for kids; they are for adults in a big way. The finding that 71.7% of households have adult park and facility users is significant, suggesting that park and facility amenities should to be tailored to them as well as children.


The survey listed the top five most visited facilities as:

• Potawatomi Zoo (47.8%)
• South Bend Riverwalk (45.7%)
• Four Winds Field (37.7%)
• East West Race Waterway (29.2%)


• O’Brien Fitness Center (25.9%)


The chart shows that 64.5% of random sample respondents rated the parks as being in good condition, 20.8% in excellent condition, 13.7% in fair condition, and 1.1% in poor condition. The nation average for ratings of excellent regarding the conditions of parks that were visited is 34%. The findings suggest that the parks are generally good but there is room to improve.


PARK USAGE:
The survey listed the top five most visited parks as:
• Potawatomi Park (54.3%)
• Howard Park (35.4%)
• Rum Village Park (29.6%)
• Leeper Park (25.5%)
• O’Brien Park (23.1%)
The survey listed the top five amenities that should be added to the parks as:


• Restrooms (26.3%)
• Drinking Fountains (23.3%)
• Benches (22.5%)
• Paved Pathways (22.3%)
• Playground Equipment (19.6%)

The top five priorities are maintaining existing parks and facilities, improving existing parks and facilities, maintaining existing recreation services, improving safety and security, and expanding trails and connectivity. Increasing programming to families, youth and teens, as mentioned, had 70%. All other priorities were in the 60 percentiles or lower.


Top 5 Priorities:
Priority Ranking:


The executive summary is meant to abbreviate the extensive survey findings into a short, concise format. Conclusions can be made from this large data set to aid in the general understanding of the importance of the agency and the establishment of priorities for the South Bend Venues Parks & Arts. These include:
1. Parks and recreation are an important part of the South Bend community.
2. Investments made for park and leisure activities in the downtown area have paid off with high use and satisfaction.
3. Traditional park amenities are desired by the community.
4. Maintaining existing facilities is slightly more important than improving them but there is a need to build new facilities that are past simply maintaining them.
5. Improving safety is listed as a top priority.
6. Programs are general well regarded for quality but there is room for improvement.
7. Youth programs could be expanded.
8. Community special events as well as fitness related programs are highly used.
9. Large community parks and facilities garner the most use in the park and recreation system.
10. While many neighborhood park improvements have been made over the last five years, the need for ongoing maintenance continues.
11. The top ranked priorities have very similar percentages suggesting that all the priorities are an important consideration in future planning initiatives.
Starting 2016 and running through 2017, South Bend hired SmithGroup JJR to create a strategic plan for the City of South Bend’s riverfront park and trail
system; with special focus upon the connectivity. It was determined that the strategic plan should:
• Reinforce trail and park system as a network of facilities.
• Ensure multifunctional and distinctive public open space to serve current and future needs.
• Embrace ecological values associated with the corridor.
• Embrace South Bend’s cultural diversity in the planning process.
• Reinforce neighborhood connectivity with the river parks.
• Support economic development opportunities.
• Establish design standards for the entire system.
• Establish designs for key priority locations.
The Riverfront Parks & Trails conceptual framework hosted pop-ups sessions at local parks, gathering input on what users of the parks wanted to see in their future development. This input occurred at Seitz, Howard, Leeper, during an East Race Waterway event, at a Park Board public meeting and during a First Friday’s event in downtown. Rough concept designs were displayed and ideas were tested by public response. This feedback was incorporated into the development of more complete park layouts.
Over the course of the project, over 500 people attended 3 bi-lingual public Community Forums held at the Century Center in South Bend, over 200 sticky note comments were recorded and more than 1,000 on-line comments were gathered by Smithgroup JJR.
At the three Community Meetings, after the presentations, there were six break-out stations set-up for:
• Howard Park (redesign)
• Seitz Park (redesign)
• Parks/Trails: North
• Parks/Trails: Central
• Parks/Trails: East
• General Parks
Each of the break-out stations had a large display board of the selected area with the evolving design options and previous suggestions incorporated. The following questions were asked of the participants to be recorded as sticky-notes on the boards to be integrated in VPA future designs and system considerations:
1. What do you like about the options?
• Options are not exclusive.
• Consider individual elements and how to combine them.
2. What is missing? What else would you like to see?
3. How do you use/access these parks and trails?
• What route?
• By car, bike or walk?
4. Where are the special spots?
• Date: Thursday September 8th, 2016
• Time: 5:30 pm
• Attendance: approx. 16
Summary of Comments:
FacilitiesSafetyConnectivityCharacterProgramming
COMMUNITY MEETING #2
• Date: Wednesday November 2nd, 2016
• Time: 5:30 pm
• Attendance: approx. 180
Summary of Comments:
FacilitiesSafetyConnectivityCharacterPrograms
Basic Amenities all parks
Fishing Access and features
Insure equitable distribution across entire system
More bicycle parking and support
Interconnection with police operations
Lighting, but w/ Dark Sky awareness
Expand narrow pathways
Mile-measured pathways, loops
Wayfinding integrated with bike trails
Improved road crossing over bridges
Bank amenities, “Riverside nooks”
Individual parks, individual character approach
Arts along river, public lands for public arts
Open public lands for partner programs
Activate boathouse, support river sports
Community Center expansion – Howard, Pinhook, Southeast Park?
Uniform signage w/ park ordinances
Allow for neighborhood “feeders” to trail system
• Date: Tuesday June 27th, 2017
• Time: 5:30 pm
• Attendance: approx. 185
Summary of Comments:
More attention to ecology/ sustainability and natural parks
FacilitiesSafetyConnectivityCharacterPrograms
Mountain Biking expansion
Bike Patrols, more activity in parks/trails
Improve gaps to regional trail networks
Central parks should reinforce downtown development
Outdoor Yoga/ Fitness
ADA/ Universal access
Park
Maintain/ create natural areas
Programming/ awareness in all parks
Improvements should not push out familiar users (gentrification)
Leeper as “Historical Park”, Studebaker Fountain
Access to an easy “report line”. Who to call.
Cameras, park locking possibilities
Eastern portion of Northside trail needs better marking
Circular loops, remove creepy undercrossings
Natural spaces for “quiet parks”
Design should feel inclusive. “This is your space”
Outdoor performing spaces/ venues for community
Activate pocketparks, mobile services
on‐line with the addresses that were originally selected for the random sample. If the address from a survey completed online did not match one of the addresses selected for the sample, the on‐line survey was not counted.
ETC Institute administered a survey to residents of the City of South Bend during the summer of 2018. The purpose of the survey was to help the City of South Bend ensure that the city’s priorities continue to match the needs and desires of residents. The information provided will be used to improve existing services and help the City better understand the evolving needs of residents of South Bend.
The seven-page survey, cover letter and postage paid return envelope were mailed to a random sample of households in the City of South Bend. The cover letter explained the purpose of the survey and encouraged residents to either return their survey by mail or complete the survey online. At the end of the online survey, residents were asked to enter their home address, this was done to ensure that only responses from residents who were part of the random sample were included in the final survey database.
Ten days after the surveys were mailed, ETC Institute sent emails and placed phone calls to the households that received the survey to encourage participation. The emails contained a link to the online version of the survey to make it easy for residents to complete the survey. To prevent people who were not residents of South Bend from participating, everyone who completed the survey online was required to enter their home address prior to submitting the survey. ETC Institute then matched the addresses that were entered
The goal was to obtain completed surveys from at least 600 residents. The goal was exceeded with a total of 810 residents completing the survey. The overall results for the sample of 810 households have a precision of at least +/-3.4% at the 95% level of confidence.
The percentage of “don’t know” responses has been excluded from many of the graphs shown in this report to facilitate valid comparisons of the results from South Bend with the results from other communities in ETC Institute’s DirectionFinder® database. Since the number of “don’t know” responses often reflect the utilization and awareness of city services, the percentage of “don’t know” responses have been provided in the tabular data section of this report. When the “don’t know” responses have been excluded, the text of this report will indicate that the responses have been excluded with the phrase “who had an opinion.”
Seventy-three percent (73%) of respondents have visited a city recreation facility or park in the past year. The highest levels of satisfaction with parks and recreation services, based upon the combined percentage of “very satisfied” and “satisfied” responses among residents who had an opinion, were: the maintenance of City parks (62%), the number of walking and biking trails (61%), and access to parks in neighborhoods (60%). The top four parks and recreation services respondents indicated should receive the most emphasis over the next two years were: the condition of restrooms in public parks, the overall maintenance of City parks, availability of recreation programming in neighborhoods, and the number of walking and biking trails.
“South Bend Venues Parks & Arts administered a final community feedback session with the purpose of testing the assumptions and strategic goals of this proposed Masterplan Update. Significant focus was invested in making this process as assessable as possible, especially during the time of current COVID-19 status in our region.
Outreach efforts for the Community Check-In began six weeks before the meeting date. Tools for alerting and engaging the community used in this preparation phase included:
• 16 yard signs placed at high-visibility, high-traffic locations distributed throughout the six council districts of the city. We created and placed four 8 ft banners along our highest use portions of our trail system. Based on projected traffic counts we estimated over 35,000 individual contacts with this method.
• A single bi-lingual feedback webpage that hosted the current draft version of this Masterplan, an electronic feedback tool for leaving comments and questions and the summary listing of all the meeting data, both in-person and with the distance tools.
• 30 full color posters (made in Spanish and English versions) that were displayed at VPA point-of-public contact locations, the County-City Building elevators and among a dozen partner agencies’ locations.
• Two separate paid public announcements with the South Bend Tribute, one a month before the community event, the other ten days before the scheduled presentation date highlighting the distance and in-person options.
• Paid promotions on Facebook to expand the reach of our on-line social media engagement tools.
• A social media engagement strategy that included four different platforms with a minimum of one new post every week until two weeks before the event, then three a week in that final build-up.
• A press release to all the local news, radio and public press agencies including links to the website, feedback tools and meeting information.
• An email campaign to our partner agencies, community partner providers, park supporters, neighborhood organizations and Foundation supporters.
• Pop-up booths at South Bend’s Best. Week. Ever. events which occurred August 1-7th, 2021. The popup booths distributed rack cards with all the meeting data, in-person and virtual, and included feed-back cards and knowledgeable staff to answer questions about the Community Check-in, the proposed Masterplan Update and the feedback process.
• Invitations to Participate emails were set out three weeks before the event to 82 community organizations, stakeholders, partnership agencies and neighborhood groups with a follow-up notice distributed the week of the presentation.
The Community Check-In Event occurred Thursday August 19, from 4:00 – 7:00 pm at the Pinhook Community Center. This building was selected because of the ample parking, universal single level access and ADA amenities.

Live attendance was 70, representing interested citizens and 34 community organizations including the St. Joseph County Health Department, South Bend Community School Corporation and nine different neighborhood groups.


Live virtual attendance was estimated at approximately 100 individuals with more than double that amount viewing the material in the two weeks following the presentation.
The Executive Director of the South Bend Venues Parks & Arts did a 45 minute live presentation covering the past five years of accomplishments for the Department, the guiding principles of our selection of priority projects based upon VPA’s Four Impact Drivers, our projected projects over the next five years and invited participants, live and virtual, for comments, additional suggestions and to test VPA’s assumptions.
Engagement tools used during the live event or offered virtually:
•Monitored FaceBook live broadcast to capture comments and feedback
•On-line feedback tool hosted during the event and available for 10 days after the event to capture comments
•A 16’x10’ graphic board of the parks system highlighting completed and future proposed projects with push-pins for comments and suggestions.
•Six break-out stations for each of the key Departments of VPA with their respective Directors for questions or more detailed inquiries regarding their specific operations.
•Live Spanish translation was provided for any individuals on-site or remotely who requested the service.
Participation was tallied and the comments and critiques were used to adjust the five-year projection of priority projects. This feedback will be used in the construction of the VPA’s next five-year Strategic Plan due at the end of 2022.

On-line feedback tools produced 28 actionable comments/suggestions that have been evaluated and incorporated.
In-person session produced 23 actionable comments/ suggestions from the comment cards, interactive Board and from the Break-out Division tables’ discussions
Although generally, satisfaction shown by the survey tools is good for VPA facilities, basic amenities were still called out for many parks. In particular, restrooms appeared as an area for improvement. Over the past three years, a system-wide restroom improvement and accessibility program has just finished, bringing all the neighborhood restroom facilities into ADA compliance, improving functionality and appearance. Additional restrooms were added into the renovated Howard Park Community Center, the Pulaski Park improvement and a new comfort station is to be installed in the rebuilt Seitz Park.
VPA has restructured its marketing and outreach efforts to address the noted issue of outreach and public awareness of services but the feedback and surveying is lagging.
Health concerns and limited public interaction over the past year have restricted VPA’s ability to do many more current public feedback efforts. As several new facilities and restructured programs are just in their first year or two of activation, it will be good opportunity to start new direct feedback and satisfaction to measure their effectiveness.
Many of the connectivity issues with the river parks and the neighborhoods and the parks and trail systems are being addressed by the trail expansions including the Coal Line Trail, bicycle network planned growth and other park adaptions included in the five-year capital update.
In the upcoming years, to address several of the other concerns, VPA intends to return to a “Back to the Basics” approach.
Source: Current Conditions Report, City Plan, Appendix C, Indiana Business Research Center
Using good projections to understand and prepare for anticipated changes to the conditions and needs of the community, demographic studies are often the first
step.
Over the planning horizon, overall population is projected to change very little (showing a slight growth), but two key trends are noted in studies:
1. An increasingly diverse ethnicity to the City of South Bend.
2. And a gradually aging population and increase in the median age
The following table shows both the decreasing number of the projected population in the “prime workforce” age as the population median moves towards the elderly and also the increasing diversity of the ethnic and racial make-up of our community.
Of course, projections do not take into account unforeseen changes in the economy or in the community due to new or unanticipated developments, but the South Bend Venues Parks & Arts Department will need to be aware of these anticipated trends.
Trying to look further ahead to prepare for as-of-yet
unidentified trends just over the horizon is the work of futurists. Taking an identified direction and projecting it forward over time to examine its possible effects on a community is one way of predicting future conditions.
During the planning process, and as part of the VIP Project described in Section M of this document, we evaluate our plan and action steps against the best attempt at an rationally imagined future.
The following summary looks at national, regional, and local trends have been determined to be most relevant to the VPA Master Plan.
Certain larger trends can be identified affecting the entire profession. Generally these are results of cultural shifts or changes of perceptions and expectations at the national level, although some demographic issues, such as the aging of the baby-boomer population or the rise of obesity among the American population may also affect the entire profession.
Planning for such trends and working in partnership with other agencies who are successfully managing such trends is a necessary strategy for preparing for future conditions.
Below is a list of key trends identified by the National Recreation and Parks and Association:
1. The need to develop effective relationships with the private sector for the acquisition and management of parks and public lands.
2. In facing growing demand, positioning public parks and recreation within the top tier of essential services.
3. Increasing demand on park and recreation agencies to function as social service providers, addressing issues such as homelessness, health and wellness, and senior care.
4. The need to reach out to minority communities in serving increasingly diverse populations.
5. The growing crisis of a generation of children who have lost touch with nature and the desire to simply play outside.
6. The call for parks and recreation to “go green” and serve as community leaders in creating sustainable landscapes, reducing energy consumption, and stimulating environmental stewardship.
Source: “Trending Positive”, Richard J. Dolesh, Senior Director, NRPA Public Policy, March 2008, Parks and Recreation, Official Publication of the National Recreation and Park Association.
Our country is becoming increasingly racially and ethnically diverse. South Bend shows this trend over the last several decades also.
As the recreation field continues to function within a more diverse society, race and ethnicity will become increasingly important in every aspect of the profession. More than ever, recreation professionals will be expected to work with, and have significant knowledge and understanding of, individuals from many cultural, racial, and ethnic backgrounds.
Partnering with culturally self-identifying organizations has been successful for VPA, assisting communities to represent themselves with assistance from our services and facilities instead of trying to represent them ourselves.
South Bend VPA’s cultural events and programs, especially at its various Community Centers, are intentionally designed with partner organizations from neighborhoods and self-identifying minority groups to create the most inclusive offerings and experiences possible.
Because South Bend has a significantly lower average household income than the county and surrounding region with a corresponding greater percentage of
poverty, South Bend Venues Parks & Arts always needs to be cognizant of the importance of free or lowcost services, balancing this within any cost recovery models. Free access to the Community Centers, splash pads, open gyms, and free or low-fee programming across the system.
Aging adults will reinvent what being a 65-year-old means. Parks and recreation agencies that do not plan for “boomers” carrying on in retirement with the same hectic pace they have lived during their years in employment will be left behind. Things to consider when planning for the demographic shift:
• Passive and Active Fitness and Wellness Opportunities
• Cultural Arts and Entertainment
• Outdoor Recreation/Adventure Programs
• Travel Programs
South Bend offers numerous facilities, activities and events that appeal to Adults, including the following:
• Ella Morris and Muessel-Ellison Botanical Conservatories and Potawatomi Greenhouse
• Rum Village Nature Center
• East Bank Trail/Riverwalk
• South Bend Museum of Art
• South Bend Symphony
• Art Beat
• Arts Everywhere
• Leeper Art Fair
• Leeper Studebaker Fountain
One of the demographic trends identified nationwide that also affects South Bend is the smaller proportion of youth than in the past, but still essential to our future. As of the 2020 Census, the age group under age 18 forms about a quarter of the U.S. population, and this percentage is at an all-time low. This population group is especially ethnically diverse compared to previous census measurements.
South Bend has many activities and amenities that
appeal to youth, including the following:
• Youth Mentoring and Job services
• Activities at the Community Centers, Including camps
• Howard Park Ice Trail and modified park
• Partnerships with YMCA for youth programming at the O’Brien Center
• Potawatomi Zoo
• O’Brien Skatepark and open-use general trails
South Bend, as home to several large universities, has a disproportionately high percentage of young adults. This provides unique opportunities for seasonal specialty programs and events. Active programming, team competitions and city-wide cultural events all support this demographic.
Demand for fitness and wellness offerings continue to increase with strong support from national initiatives and funding to help increase physical activity and reduce the growing obesity epidemic. While private sector health provision is strong, less than a quarter of the population nationwide uses private fitness clubs. Public sector agencies are increasing their offerings to assist a more active lifestyle for its residents. While having trails available for walking continues to be the most desired amenity, instructional programs and indoor facilities are also very popular. VPA will continue to position itself as a Health and Wellness provider and already is a founding member of the St. Joseph County Health Improvement Alliance and will continue to support trail development and active lifestyle opportunities both in public lands design and in programming selection.
National trends continue to show an increased userbase desire for recreation facilities (private and public). To meet that growing need, a majority of the survey respondents (64%) to the NRPA ParkMetrics reported that they have plans to build new facilities or make additions or renovations to their existing facilities over
the next five years. The average age of respondents’ main facilities is 24 years, which puts the vast majority of South Bend facilities well over that average. Continued maintenance is an issue for our system’s facilities that will have to be diligently overseen.
The five most commonly planned facility additions nation-wide include: dog parks, splash play areas, trails, park structures (shelters/restrooms), and playgrounds. The current national trend is toward “one-stop” indoor recreation facilities to serve all ages. Larger, multi-purpose recreation centers that serve large portions of the community help increase cost recovery, promote retention, and encourage cross-use.
Agencies across the U.S. are increasing revenue production and cost recovery. Multi-use facilities offer broader programming opportunities as well as freeplay opportunities. These facilities models attract young families, teens, and adults of all ages and intergeneral programming helps address the changing age demographics and build cultural unity.
Stepping away from the traditional playground equipment which often leaves youth with special needs unable to participate, the parks and recreation field has seen an increased demand for inclusive playgrounds that provide sensory play and accessibility for ability levels. This does not just include making playgrounds wheelchair-friendly, but also means playground designs should consider how children with social and emotional disabilities can interact with a variety of sensations and textures that stimulate all of their senses. Technology also plays an important role in enhancing the accessibility of playground equipment as well. Adaptive switch technologies used to activate sounds can help users with limited fine motor skills be able to engage with the playgrounds in ways they couldn’t before.
In its $60 million parks overhaul, Venues Parks & Arts prioritized accessibility when making choices about improvements and redesigns that needed to take
place in over 40 parks throughout the city. South Bend’s marquee park, Howard Park, was completely reconstructed in 2019 to include hundreds of feet of ADA accessible walking paths and a completely accessible playground that includes unitary surfacing, immersion swings, and other free-standing, multiability playground pieces. At other parks, residents specifically called for accessible play options at their local neighborhood park, which led to the installation of brand-new, inclusive park and playground features at Boehm, Kelly, Potawatomi, Keller, Howard and Leeper Parks.
Part of designing inclusive playgrounds includes making other park amenities accessible including restrooms, walking paths, and drinking fountains. In 2019, VPA upgraded every park restroom in the system to be ADA accessible.
Source: www.gametime.com/inclusive-playground
Source: recmanagement.com/feature/201704su02
Health risks associated with obesity have become an increasing concern for communities throughout the US. One way that parks and recreation associations are actively working to address these concerns is through the installation of outdoor fitness equipment. Outdoor fitness equipment provides a free and easily accessible workout opportunity for an entire community, as opposed to a paid, exclusive gym membership
where workout equipment typically is found. Additionally, people who exercise outdoors are more likely to repeat the behavior and more likely to engage in activity for longer. A study conducted by the University of Tennessee at Chattanooga demonstrated that there were twice as many park users at parks where outdoor fitness equipment was located and that park users engaged in moderate to vigorous activity there at least 63% of the time. Not only does creating more spaces for people to get active helpful for encouraging fitness, it also gets people to spend more time outdoors which has shown to play an important
In addition to children’s playground equipment, Venues Parks & Arts has installed outdoor fitness nodes in two areas throughout the city. VPA installed several fitness equipment pieces along a riverfront trail to allow users to walk or jog between each piece. Additionally, Gov. Kernan Park is home to a pod of fitness equipment that overlooks the riverfront and is connected to the entire riverfront trail system.
Source: www.gametime.com/outdoor-fitness-equipment
Source: www.gametime.com/uploads/media/ Outdoor_Adult_Fitness_Parks_ES.pdf
Parks departments are uniquely situated to address issues of climate change with their decisions on how to use and protect public green spaces. Climate change will continue to impact the degradation of natural resources, water levels, weather patterns, and loss of wildlife and ecosystems. Parks are an important part of preventing the worst damages of climate change, especially when designed with the changing environment as a top priority. National Parks and Recreation Agency predicts that in the near future, parks will be increasingly seen as multi-benefit landscapes that protect against flooding, clean and filter stormwater, produce shade and prevent heat island effects.
VPA has taken several steps to consider the future ecological health of the city in both new projects and in decisions regarding existing parks. Located adjacent to the riverfront, Howard Park was continually flooded whenever river levels increased and overwhelmingly so during the 500-year flood that impacted the city in 2018. It was vital to consider this growing issue when the park was completely redesigned in 2019. The new park ground level was raised several feet towards the street, playground, and building, and graded downward towards newly implemented bioswales that could contain water overflows.
VPA has also established an Ecological Advocacy
Committee of volunteer experts in the ecology field who advice on topics pertaining to climate change and environmental impacts on park lands. This committee recently developed a 79-page comprehensive Natural Resource Management Plan that analyzes and advises the department on the management and maintenance of our most important ecological resources. This has led to changes in how often sensitive properties are mowed, protection and development of wetlands, removal of invasive species, and specific recommendations for each park, among other things.
Source: www.nrpa.org/parks-recreation-magazine/2021/ january/top-trends-in-parks-and-recreation-2021/
Esports is a growing trend around the world, and parks and recreation agencies have sought to keep up. In 2019, global eSports was a $1 billion industry. Recreation programming targeted to the esports genre takes advantage of the popularity to promote the goals of recreation. Some of the hardest to reach audiences for parks and recreation agencies are those that are most attracted to esports – teens and young adults. As esports evolves to become a more multiplayer, immersive experience, esports programs have help create a social experience in a safe, structured environment. Additionally, esports programs help agencies fill their facilities during normally unused or underutilized times. Young people who attend these programs can be cross-promoted to and brought into other recreation programs at those facilities.
South Bend’s convention center, which operated under the umbrella of VPA, transformed an under-utilized conference space and auditorium to create an esports arena and gaming center in early 2021. The gaming center is now home to both a local university esports team and a local professional soccer league esports team. Although not fully operational due to COVID, the arena will eventually host large events bringing in hundreds young gamers both regionally and locally. Discussions have started about how to integrate programming at the city’s two community centers into
the esports gaming center to create opportunities for underserved youth to experience the technology and environment of esports on a large scale.
Esports: www.nrpa.org/parks-recreation-magazine/2019/ september/esports-the-next-big-thing-for-parks-and-rec/
South Bend Venues Parks & Arts formed a cooperative analysis partnership with the Trust for Public Lands to create an access study based upon their ParkScore methodology. VPA was the first agency not listed in their top 100 cities in the U.S. to undergo this process. The goal was to identify how to put every household in South Bend within a ½ mile walking distance to a park or public recreation facility.
Barriers such as high-traffic roadways, park entrance locations, bridge and trail connections were all used in calculating walking distance. In order to evaluate the existing and to forecast the future park and recreation needs of a community, “standards” should be used as guidelines. These standards are to be considered minimums in assessing the recreational needs of the community. The standards typically relate to acreage and populations being served (not necessarily the ages of the population or the level of incomes, etc.). These standards form a base line from which needanalysis can be performed. While these standards are national standards they do not always relate to the reality of the local community’s situation. The analysis of this study will utilize the national standards but will relate the analysis with the local community situations in mind.
PARKSCORE® INDEX FOR THE CITY OF SOUTH BEND, INDIANA
PREPARED BY THE TRUST FOR PUBLIC LAND - MAY 2017

As the leading U.S. organization that works to analyze and determine the value of urban parks, The Trust for Public Land has created a methodology to give a general rating of every major U.S. city’s park system through its proprietary program called ParkScore®.
Cities can earn a maximum ParkScore of 100. For easy comparison and at-a-glance assessment, each city is also given a rating of one to five park benches. One bench means the park system needs major improvement, while five benches means the park system is outstanding. In evaluating park systems, we consider land owned by regional, state, and federal agencies within the 100 most populous U.S. cities— including schoolyards formally open to the public and greenways that function as parks.
The analysis is based on three important characteristics of an effective park system: acreage, facilities and investment, and access.
ParkScore awards each city points for acreage based on two equally weighted measures: median park size and parkland as a percentage of city area. Factoring park acreage into each city’s ParkScore helps account for the importance of larger “destination parks” that serve many users who live farther than ten minutes’ walking distance.
ParkScore awards each city points for investment and amenities based on two equally weighted measures: total spending per resident and an average of percapita provision of four key park amenities - basketball hoops, dog parks, playgrounds, and recreation and senior centers.
• Spending per resident is calculated from a threeyear average (FY 2013/2014, FY 2014/2015, and FY 2015/2016, depending on a city’s fiscal calendar)
to minimize the effect of annual fluctuations. Spending figures include capital and operational spending by all agencies that own parkland within the city limits, including federal, state, and county agencies.
• Amenities were chosen because of the breadth of users served, the ubiquity of these amenity types, and the ease of accurate counting of these measures.
ParkScore awards each city points for access based on the percentage of the population living within a tenminute (half-mile) walk of a public park. The half-mile is defined as entirely within the public road network and uninterrupted by physical barriers such as highways, train tracks, and rivers.
The scoring system recognizes the accomplishments of cities that have made significant investments in their parks without holding dissimilar cities to an unrealistic standard. It enables detailed analysis and allows cities to increase their ParkScore through incremental improvements to different aspects of their park systems.
To determine a city’s ParkScore, we assigned points in three categories: acreage, investment and amenities, and access.
• Acreage: 20 points for median park size, and 20 points for park acres as a percentage of city area • Investment and Amenities: 20 points for spending per resident and 20 points for the average of the four key amenity scores (basketball hoops, dog parks, playgrounds, and recreation and senior centers).
• Access: 40 points for percentage of the population living within a walkable half-mile, ten-minute walk of a public park.
Points for each statistic are assigned by breaking the data range established by our national sample into 20
brackets, with the lowest bracket receiving the least points and the highest bracket receiving the most points. Each city’s total points—out of a maximum of 120—are then normalized to a ParkScore of up to 100.
To prevent outliers from skewing the results, the top bracket for each measure includes all values equal to more than double the median of the data range. For example, spending per resident in our 100-city national sample ranges from $15 to $287, with a median of $82. To control distortion from local anomalies, all cities that spend more than double the median value (i.e., $163 per resident) are assigned to the highest bracket and receive 20 points.
With the top bracket thus defined, the parameters for the remaining brackets are established so that each bracket comprises an equal portion of the remaining data range. This protocol applies to all categories except access, which has no outliers.
To map access to parks and open space, ParkScore first identifies gaps in park availability, and then determines which gaps represent the most urgent need for parkland.
Access gaps are based on a service area representing a ten-minute walk. To map park need, we combined three differently weighted demographic profiles:
• Population density – weighted at 50%
• Density of children age 19 and younger – weighted at 25%
• Density of individuals in households with income less than 75% of city median income – weighted at 25%
Each city’s park need is mapped from data collected in the 2016 Forecast Census block groups provided by Esri. The total population of South Bend according to this data source is 97,161.
South Bend has identified seven cities for benchmarking comparison, which provides an instructive way to consider the scores against peer and aspirational cities. These cities are: Lexington, Wichita, Madison, Toledo, Fort Wayne, Indianapolis, and Cincinnati. All of these cities are currently included in the ParkScore Index because they rank among the 100 most populous US cities. While South Bend is much smaller than all of these cities, there are similarities that make them useful comparisons when considering how the park system of South Bend serves its citizens.
The cities were selected based on the following criteria: similar geographic region and proximity to South Bend, cities with a positive growth rate, cities with similar industry and labor mix, and cities that are home to the main campus of a research university (i.e., a university that grants doctoral degrees) to simulate the impact of Notre Dame, IUSB and the other many higher education institutions on South Bend. It is worth noting that the South Bend Department of Venues, Parks, and Arts is the only agency that owns and manages parkland within the city limits of South Bend (excluding the joint-use school facilities). This is also the case for Wichita and Fort Wayne, but all other comparison cities have other agencies operating parkland within their city, such as White River State Park in Indianapolis and Metroparks in Toledo.
South Bend scores above the national median of 51.5 overall, with a total score of 64 out of 100 possible points. They score above the median in park size, with fairly large parks at a median of 8.7 acres. These parks are also reasonably well distributed, serving 73% of the population (the national median is 67.7% population served within a city). South Bend’s parkland only makes up 5% of the city, however, which is fairly low compared to the national median of 9%.
In comparison to the benchmarking cities, Cincinnati and Madison both score above South Bend with total overall scores of 72.5 (these two cities tie). Most
significantly, these cities outpace South Bend in terms of Parkland as Percent of City Area. While South Bend has large parks, the city would benefit from adding more parkland overall. In this way South Bend is comparable to Lexington, Wichita, and Indianapolis, all of which have large parks but score fairly low in the Parkland as Percent of City Area component.
South Bend spends $116 per resident on parkland. While this is above the national median of $82, there are many cities that score higher including comparison cities Cincinnati (at $181) and Madison (at $122), with the national maximum being $282. Coming in at 14 out of 20 possible points, the Spending per Resident metric offers another category in which South Bend could improve.
South Bend scores fairly well in amenities, with the lowest score being in recreation and senior centers. They fall right at the median in this category, with 0.8 centers per 20,000 residents. The next lowest portion of the amenities is off-leash dog parks (there is only one dog park, though with a relatively small population this gives the city 11 points out of 20). Comparison cities Cincinnati, Madison, and Lexington all offer more off-leash dog areas to residents (even on a per capita basis) than South Bend does. This indicates a possible area of improvement, especially if the desire for dog parks is present. Recreation centers and dog parks are just two pieces of the amenity section, however, and recreational wants and needs can vary widely by city. The city’s residents are very well-served in playgrounds and in basketball hoops. South Bend has 20 schools with joint-use agreements that allow these facilities to be open to the public outside of school hours, and this partially accounts for the high scores in these two amenities as well as in the Access category.
Using this access analysis, additional park and public lands will be prioritized, placed and developed. Some high-impact developments are identified in the FiveYear Capital Improvement Plan to address currently underserved portions of the city and assist VPA in
PopulationDensity-PeopleperAcre
The Trust for Public Land ParkScore® index analyzes public access to existing parks and open space. The analysis incorporates a two-step approach: 1) determines where there are gaps in park availability, and 2) constructs a demographic profile to identify gaps with the most urgent need for parkland. Park gaps are based on a dynamic 1/2 mile service area (10 minute walking distance) for all parks. In this analysis, service areas use the street network to determine walkable distance - streets such as highways, freeways, and interstates are considered barriers.
Demographic profiles are based on 2016 Forecast block groups provided by Esri to determine park need for density of youth, density of individuals in
households with income less than 75% of city median income (South Bend less than $25,000), and population density (people per acre).
The combined level of park need result shown on the large map combines the three demographic profile results and assigns the following weights:
50% = population density (people per acre)
25% = density of youth age 19 and younger
25% = density of individuals in households with income less than $25,000
Areas in dark red show a very high need for parks.
H-5 Figure A: Continued on the following page.
DensityofYouthAg
DensityIndiv
Specialthankstothefollowingdataproviders:SouthBend,Esri. Informationonthismapisprovidedforpurposesofdiscussionandvisualizationonly. MapcreatedbyTheTrustforPublicLandonFebruary13,2017.TheTrustforPublicLandand TheTrustforPublicLandlogoarefederallyregisteredmarksofTheTrustforPublicLand. Copyright©2017TheTrustforPublicLand.

H-5 Figure C:
trying to provide every resident a 10-minute walk from their front door to a park.
PARK SYSTEM NEEDS ANALYSIS
Just as there are standards for Park Acreage, there are also Standards for Recreation Facilities based on the population. The Standards adopted by the South Bend Venues Parks & Arts Board of Commissioners have been used to produce this chart. It should be noted that the number of existing facilities do not include those of the South Bend Schools, as these figures were unavailable. (See table H-8 on the next page.)

H-6
Total park land in South Bend is just over 12.69 acres/1000 persons, which is slightly higher than
the median range for a city of its size in this region. Population growth projections over the next five years do not forecast a need for substantial land purchases. Additional land purchase or park expansions will likely be for system improvements, connectivity opportunities, preservation issues or to increase access to under-served neighborhoods currently without a park with a 10-minute walking distance to their homes.
Over the next five (5) years, based on demographic and park system standards, the South Bend Venues Parks & Arts system should strive toward making adjustments in the number of park facilities.
2015 U.S. Census data tells us there are nearly 40 million Americans living with a disability of some kind. Its important for VPA to consider these numbers when planning for future park upgrades, programming, marketing, and signage. Public spaces and programs should be accessible to the entire community, no matter someone’s ability status.
Accommodations that need to be considered go beyond providing adequate handicapped spaces. Creating wide, properly graded pathways, accessible restrooms and playgrounds, and appropriate handrails and grab bars all play a part in making public spaces available to all. Beyond mobility disabilities, considerations for visual and hearing impairment and sensory sensitivity should be addressed in park design and programming.
Venues Parks & Arts has worked towards creating more accessible public spaces and programs in a number of ways. In 2019, we upgraded every restroom in our system to be ADA accessible and installed
several accessible playgrounds in areas throughout the city. At our popular ice skating trail, we offer low sensory hours where people can visit with lower crowds, no music and toned down lighting. We continue to partner with agencies who serve people with disabilities to offer programs like adaptive tennis and wheelchair basketball.
Threats to our shared public spaces have exponentially increased in recent years due to the impact of climate change and a major uptick in city-wide development. In response to back-to-back 1,000-year flood events, we have begun to create new natural
flood control areas along our riverfront. To assist with urban heat impacts, carbon sequestration and storm water management, we have re-prairied at least 100 acres of park property, doubled the number of trees planted annually in the city, have introduced recycling into park properties, and have initiated an energy conservation study. Additionally, we moved to permanently protect more than 50 acres of property in two locations by transferring control to the Board of Park Commissioners. Through education and advocacy, we have we have protected four park properties from proposed construction projects and worked collaboratively to include green space, connectivity, and recreational amenities as part of private development projects.
To put more direct and specialized attention on the ecological issues facing the department, VPA created an Ecological Advocacy Committee, a citizen group of environmental experts appointed by the Park Board of Commissioners. A vital accomplishment of the EAC was the development of the city’s first Natural Resource Management Plan, one of the most comprehensive of its kind in the country. The plan sets policies on specific ecological issues and identifies sensitive properties. The document has already informed swift and effective navigation of issues related to rising river levels, native plantings, property protections, invasive plants and nuisance wildlife, and land acquisition.
Additional efforts VPA has undertaken include signing on to NRPA’s Monarch Pledge, developing a nature preserve golf course combo, upgrading our nature education center, and recently building one of the first LEED v4 Gold park buildings in the country.
The introduction of a cost-recovery strategy was designed to identify operational opportunities while balancing equity in access. To cover departmental expenses, there are varying levels of subsidy that each program needs to operate. Those programs and assets with the most public benefits should receive the most subsidy.
With a goal of reaching 40% cost recovery by 2025, VPA has developed a rating system to identify how much each programs and assets should be subsidized with public dollars. For example, a private yoga instruction course receives a rating of 5, meaning that that expenses for the private yoga class should be entirely covered through fees.
Our golf division demonstrates how this unfolded across the department well. Through study, we understood that course pricing was undervalued, access was limited, and subsidies were high. While refining the business model, we also transformed the properties to include multi-uses: one added open nature trails, one clubhouse was renovated to include community event space, and the last became home to a “kids golf free” initiative in conjunction with the First Tee program. As a result, we decreased public subsidy while increasing public access. Usage has increased 30% with nearly 100% cost recovery.
The first step in setting the bold strategy for transformation of the system involved a complete study of the current conditions of the system’s parks and services. A comprehensive inventory of the facilities, public lands and services was then informed by benchmarking with comparative communities. Establishing the baseline of our current level of service prepared us to begin future planning. A study of changing trends and shifting user preferences was used to create an understanding of the gaps and likely needed changes to the current inventory for the future.
Extensive public feedback was gathered from community meetings, statistically valid surveying, stakeholder, and issue-centric focus group discussions to ensure South Bend’s particular needs and desires for their public system was captured. This was done at the neighborhood level, the city level and was also targeted at specific park, region and program improvement requirements.
Using both the analysis of current conditions and assets in addition to community feedback, VPA identified priorities that best captured the future needs of our parks system, venues, and public spaces. Previous planning efforts, including the Parks Master Plan, Reginal Cities Economic Plan, City Comprehensive Plan and other neighborhood specific plans, also informed the priorities. The goals of these planning efforts are identified in the strategic plan as supporting documents.
To help refine the strategic goals of VPA, the VPA Strategy Team, consisting of leaders in all department divisions, finalized a set of defined focus areas with objectives and strategies. These objectives
were developed following several leadership team meetings, SB Stat evaluations, leadership development retreats, Drucker Institute training sessions, and facility experience audits.
The Strategic Plan was reviewed by the VPA Strategic Team and presented to the Board of Park Commissioners for review and adoption. Each of the targeted strategies has an assigned owner to lead the issue towards completion. Each strategy will be further broken down into actionable steps, led by the owner, with a particular focus on the key considerations. Review of the overall Strategic Plan will be on at least an annual basis.
• Major Capital Investments
• Asset Management
• Event & Program Optimization
• Customer Engagement
• Employee Development
1. Project Identification – In 2017 we identified a suite of targets for capital projects that would meet the communities defined needs.
2. Project Scope, Impacts & Costs – Based off of our capital project identification list, we were able to define conceptual scope, impacts and preliminary estimates for total cost.
1. Public Communication – We continue to execute an ongoing, comprehensive communication strategy designed to educate and engage with our residents as well as inspire civic pride.
2. Project Financing – We have instituted a fiscally responsible funding strategy that leverages outside investment without raising taxes. We
continue to seek private funding to support many of our capital improvements and so far have captured millions of dollars and plan to continue seeking these funds for the foreseeable future.
3. Project Implementation – Aggressive but realistic timelines have been set to complete a host of capital projects over the next several years which are currently scheduled throughout 2025.
1. Facility Management Software – In 2019 we fully institutionalized software solutions to increase the effectiveness of our public communication channels, interactions with customers and routine maintenance.
2. Standards of Care – Specifications were defined in 2020 regarding the level of service each facility or property would receive
3. Volunteer Program – In 2018 VPA established a sustainable volunteer program aimed at increasing civic engagement and levels of service throughout South Bend.
1. Standard Operation Procedure – In 2018, VPA did a complete overhaul of written policies and procedures to maximize department-wide efficiencies. These procedures are routinely reassessed on an ongoing basis and with the creation of new public places and programs.
2. Capital Fund – We continue to create a dedicated, self-sustaining capital fund with consistent cash flows available for capital projects.
3. “Friends of…” Groups – VPA aims to build additional healthy partnerships with neighborhood and other civic groups to positively influence the direction of projects as well as gather resources within our parks system.
4. Safety & Security – VPA established updated security and safety protocols in 2018, but our
department routinely seeks out modernized systems for better safekeeping of our residents and public spaces.
5. Public Arts – VPA is always looking to integrate more public art into our park system. We are currently executing an art strategy for our spaces that empowers artists and respects public assets.
1. Realign Offerings – In 2019 we fully optimized resources and personnel in order to provide the most value to South Bend residents via altering or adding programs and events.
2. Marketing Allocations – We developed an understanding of positions within the marketplace and budgeted for an annual promotional schedule for each of our programs and events.
3. City-wide Signature Event – In 2017 we began celebrating “Best. Week. Ever.” an annual umbrella event celebrated city-wide. Largely based off local partnerships, this week-long festival has become an annual favorite.
4. Business Development Fund – In 2019, VPA established a consistently funded account through our department venues that is available to increase overall economic impact.
1. Cost Recovery – On an ongoing basis, VPA executes a cost recovery model set in 2017 in order to balance public resources and user fees to allow sustainable and accessible programming.
2. Mobile Recreation Program – In 2018 we built “Boomer”, our department’s travel recreation program. We continue to develop new strategies to increase geographic levels of local service and build relevancy in the park system.
1. Website – In 2019 we created a new department website that is consistent with the VPA brand identify and optimized for accessing programs and events.
2. Brand Management – In 2019 we finished a full brand management project that developed consistent visual branding throughout VPA.
1. Registration Software – We are set to fully overhaul our online and in-person registration process by 2022. Our focus will be to ensure ease of use to our residents.
2. Customer Service Training – Since VPA’s inception we have attempted to create a culture of understanding around customer expectations and care. At present our team is working to complete a customer service handbook rooted in our values by the end of 2022.
3. Experience Audits – Every year VPA completes a full audit of divisional programs and events to ensure brand representation and customer experience. We expect to complete these fully in 2023.
4. Storytelling – We have an ongoing goal of being engaging storytellers in order to better engage our residents beyond simply promotional marketing.
1. City Policy Training – In 2019 we formalized a written and definitive training for all manager-level staff and above to increase productivity, empower workforce and reduce ambiguity.
2. Continuing Education – We currently offer all levels of staff formal opportunities to improve professional skills.
1. Hiring Process – We continue to reinforce and evolve organizational mission and culture throughout the search, hiring and orientation stages of employment.
2. Communication & Engagement – We seek to cultivate a culture that reinforces a clear, consistent exchange of information and ideas while working ot ensure all team members feel connected to their work product. To this end, we continue to develop communication pieces internally and externally from newsletters to all-hands meetings to achieve this goal.
3. Internship Program – We are developing a meaningful internship program in every division, adding mutual value to the participant and the City of South Bend. We plan to have a formalized program in place in by 2023.
4. Youth Job Development Program – we are in the final stages of formalizing an entry-level youth employment program designed to teach work and life skills and decrease community violence.
The following table includes the capital projects and additional items identified by the level of service analysis, strategic planning, community feedback for needs assessment and identified potential funding sources. The items are not listed in precise priority order and are intended to be implemented as resources allow with the understanding that immediate needs and priorities may have to be adjusted from year to year with changing conditions. All cost estimates are in 2021 figures. Funding sources are suggested or pre-identified sources and may be enhanced with additional sources.
Over the last five years, South Bend has invested more in our public facilities than in any other fiveyear span in the city’s history. Major steps have been taken to increase basic services across the entire system, including updates and renovations at more than twenty-five neighborhood parks throughout the community (new playgrounds, benches, picnic shelters, walking paths, improved roadways, etc.).
The following projects have been selected to fill the identified needs, respond to trends, leverage partnerships, leverage pending opportunities. Three new park projects have been specifically identified to increase access to neighborhoods that do not currently have a quality park within a 10-minute walk (Access/ Equity). Trail upgrades and several existing park improvements were identified by the Riverfront Park & Trail initiative and still remain to be completed (RFP and Connectivity). The remaining projects were identified by community feedback (Community) or are required because of the end of a facilities’ life cycle (Lifecycle).
a nd diving pool reaching e nd o f l ife a nd n eeding r eplacement Wading p ool a nd s plash p laygroun d reaching e nd of l ife a nd n eeding r
($70k p er y ear over five y ears at six facilities ) Re-envisioning a nd r ebuilding
Tennis, Pickle Ball, $100k+ per year, five years
Performance measures are quantitative statistics or qualitative findings that provide information on the department’s success. Once strategies and actions are identified, VPA develops measurements to assess the department’s effectiveness in these areas.
VPA uses performance measures that are quantitative (e.g. number of strategic partnerships developed) or qualitative (e.g. quality of strategic partnerships developed). We also measure outcomes that benefit the community or customers who are served by our agency (community outcomes). These performance measures can be tied back to VPA’s strategic goals and impact drivers.
Listed below are the measurement tools VPA uses regularly.
The Parks Health Dashboard is designed for staff and South Bend residents to track the health of all of our city parks at a moment’s notice. This dashboard is updated daily as the Facilities and Grounds division of the Venues, Parks, & Arts department complete their daily work orders. The dashboard was developed through the SB Stat process, in collaboration with the Mayor’s Office.
The dashboard summarizes the city’s overall parks health score on a scale of 0-100 and breaks down scores for every single park. Park health score is determined based on numerous data points including mowing frequency, maintenance request, tree trimming, trash collection and snow removal.
Attendance is tracked and recorded at every VPA program and event. These numbers are reviewed against previous years’ numbers to show change over time and to help guide programming and marketing decisions. When possible, demographics are also
tracked and recorded. For programs requiring advanced registration, VPA requires information including zip codes that provide data about where residents are being served by program type.
An experience audit brings staff members from all sectors of department together to gather diverse perspectives on a specific experience within the department – events, facilities, parks, or programs. During these audits, staff members review an experience with prompts directing them to consider different elements such as the entrance, signage, cleanliness, etc. These comments are collected and summarized for the program or facility manager to review and implement. VPA performs regular experience audits of its facilities and programs, especially before and after updates and renovations at those locations.
VPA works to balance public resources and user fees to allow sustainable and accessible programming to South Bend residents. VPA has the goal of reaching 40% cost recovery and measures its progress towards this goal annually by reviewing expenses against revenues. VPA also evaluates each program to determine what level of subsidy it should be receiving from public funds. Using this information, VPA adjusts its program fees, promotional efforts, and fundraising goals to help reach its target.
VPA works with several partners to gather information about economic impact in relation to its events and assets. Using data from IMPLAN, South Bend’s Chamber of Commerce provides economic impact analysis from local business surrounding specific park assets. Additionally, VPA works with the City’s Department of Innovation and MasterCard to evaluate credit card activity against certain events and trends over time. This information helps VPA share with the community how its efforts are connected to a larger picture of the city’s health.
To reach the most residents with the resources available, VPA leverages dozens of partnerships to provide support to other community groups working towards our mission. We regularly track not only the number of partnerships we are currently facilitating, but also get attendance and demographic data from our partner groups to help show the full picture of our impact.
L.APPENDIX
• L-1: Compliance Form .......................................................
• L-2: INDR Approval Letter
ASSURANCE OF ACCESSIBILITY COMPLIANCE WITH: ARCHITECTURAL BARRIERS ACT OF 1968 (AS AMENDED); SECTION 504 OF THE REHABILITATION ACT OF 1973 (AS AMENDED); AND TITLE II OF THE AMERICANS WITH DISABILITIES ACT OF 1990 (AS AMENDED)
___________________________________ (Applicant) has read the guidelines for compliance with the Architectural Barriers Act of 1968 (As Amended); Section 504 of the Rehabilitation Act of 1973 (As Amended); and Title II of the Americans with Disabilities Act of 1990 (As Amended) and will comply with the applicable requirements of these Acts.
Applicant President Signature
Printed name
Secretary’s Signature
Printed name
Date

402 W. Washington St., W298 Indianapolis, IN 42204-2782 (317)232-4071
Mark Neal
South Bend Board of Park Commissioners
Venues, Parks, and Arts Dept.
301 S. St. Louis Blvd
South Bend, IN 46601
March 3rd, 2022
The DNR Division of State Parks planning staff has reviewed the final draft of the 2022-2026 South Bend Five Year Parks and Recreation Master Plan. The plan meets the Department of Natural Resources’ minimum requirements for local parks and recreation master plans. This letter certifies that your community is eligible to apply for Land and Water Conservation Fund (LWCF) Grants through this office in the 2021 grant year A new plan will be due on January 15th , 2028 at which time your current LWCF grant application eligibility will expire.
If you haven’t already, we strongly recommend that you contact Mr. Bob Bronson, our grant section chief, as soon as possible about future grant applications. Bob and his staff can assist in your grant application process. He can be reached by phone at: (317) 232-4075 or by e-mail at: bbronson@dnr.IN.gov
We support your planning efforts and encourage your participation in the grant programs administered by the Division of State Parks. If you require further information regarding planning, do not hesitate to call me at: (317) 232-4071 or by e-mail at: gbeilfuss@dnr.IN.gov
Sincerely,
Greg Beilfuss Chief Planner - IDNR Division of Outdoor RecreationThe DNR mission: Protect, enhance, preserve and wisely use natural, cultural and recreational resources for the benefit of Indiana’s citizens through professional leadership, management and education.
www.DNR.IN.gov
Employer