 Fangqing Yang
 Youping Liu
- College of Pharmacy, Chengdu University of Traditional Chinese Medicine, Chengdu, China
Pericarpium Citri Reticulatae (PCR) is a natural citrus by-product with beneficial health and nutritive properties that is used widely in food and is an ingredient in traditional Chinese medicine. PCR improves gradually with aging. However, the present research has not yet revealed the reasons for this. Some data prove the important role of microorganisms in the quality of tobacco and fermented tea with the time of the aging of these foods. Our studies further proved that the coexisting Aspergillus niger plays an important role in the change of flavonoids and volatile oil in PCR during this process. Therefore, we put forward that longer storage is better for PCR and is highly correlated with the change of the coexisting microbial population structure caused by environmental factors. Samples of PCR aged in Beijing, Sichuan, Guangdong, and Yunnan were collected at different time points. Using GC/MS and high throughput 16S rDNA and ITS sequencing techniques, massive changes in volatile profile and microbial communities were observed during aging. Spearman correlation analysis indicated that Exobasidium, Xeromyces, Pseudocercospora, Russula, Aspergillus, Herbaspirillum, Sphingomonas, and Streptococcus, which are the dominant microbial genera in Sichuan and Guangdong showed strong connections with volatile components of chemical markers. It was preliminarily verified that the changes of volatile components for PCR are highly correlated with the change of the coexisting microbial population structure caused by environmental factors, providing a new idea for the research on the aging mechanism of PCR and key influencing factors of aging quality.
Introduction
PCR is the dried peel of the citrus fruit, Citrus reticulata Blanco, and its cultivated varieties. These peels are prepared typically from freshly picked fruits that are permitted to dry in the sun or at low temperatures. PCR is a staple in foods and drugs due to its effectiveness in regulating the qi (energy), normalizing the functions of the spleen and stomach, and resolving the phlegm. To quote Tao Hongjing (Tao, 1955) “The longer the orange peel is stored, the better the quality will be.” At present, there is no research on the process of improving the PCR quality with longer storage. The most common literature data deal with the study of variations in its chemical components and the strength of pharmacological effects in the aging process (Wang et al., 2017; Yang et al., 2021a,b), and there is little research on its aging mechanism.
Microorganisms play an important role in the aging quality formation of tobacco and fermented tea. The main cause of the formation of flavor substances is the change in the coexisting microbial population structure and metabolic enzyme, storage temperature and humidity, time, and variations of components (Yang et al., 2006; Zhao et al., 2009; Liu et al., 2010; Tian et al., 2013; Li et al., 2014; Wang et al., 2015a,b). Our data highlighted that the coexisting Aspergillus niger played an important role in the change of flavonoids and volatile oil in PCR (Wang et al., 2015; Zhang et al., 2017a,b). Other literature data reported that Bacillus, Lactococcus, and Pseudomonas can accelerate the biotransformation of volatile oil in PCR (Wang et al., 2015; Chen, 2017; He, 2019). Bacillus, Stenotrophomonas, Acidisoma, Sphingomonas, Enterobacter, Neochlamydia, and Methylobacterium were associated with a variety of volatile oil components in PCR (He, 2019). These studies confirmed that the microorganisms on the surface of PCR could cause the quality change of PCR. However, the relationship between the changes in microbial population structure and environmental factors during the aging process of PCR was not studied. A correlation of Pericarpium Citri Reticulatae (PCR) between volatile components and the change of the coexisting microbial population structure caused by environmental factors is essential to understanding the underlying processes of the improvement of PCR with the time of its storage and the microbiota that drives this.
High-throughput sequencing technology is characterized by high sequencing depth, convenient identification of low-abundance community species, and low cost (Caporaso et al., 2012; Degnan and Ochman, 2012). It has been widely used in microbial diversity analysis of wine (Lu et al., 2020; Deng et al., 2021), sufu (Huang et al., 2018a), and food fermentation (Lv et al., 2019; Yi et al., 2019). It provides a reliable and effective method for diversity analysis of microbial community structure in environmental samples (Tringe et al., 2005).
In this study, Citrus reticulata “Chachi” samples were selected under the conditions of the fixed area, variety, harvest time, and processing method. Samples of Citrus reticulata “Chachi” aged in Beijing, Sichuan, Guangdong, and Yunnan were collected at different time points. High-throughput sequencing of fungal ITS 1 (Internal Transcribed spacer 1) and bacterial 16S rDNA V4 was performed to compare the microbial community structure. The GC/MS method was applied to the analysis of main differential components. Furthermore, we applied stoichiometry and other analysis methods to analyze the correlation of microbial-volatile components. The study provides a new idea for the research on the aging mechanism of Citrus reticulata “Chachi” and lays a foundation for recommendations for PCR storage, maintenance, and quality evaluation.
Materials and Methods
Sample Collection
To ensure that the collected PCR samples were representative and uniform, all specimens were collected in early January 2020 from the fresh oranges stored for peeling in Xinmadan Village, Sanjiang Town, Xinhui District, Jiangmen City, and Guangdong Province, China. After peeling, the product was processed and dried traditionally. Specifically, the orange peels were placed under different environmental conditions like wind, sun, and natural loss of water. The drying process included the following steps: soft texture after turning the peel, turning the peel then and finishing the process by drying it. The samples were identified as Citrus reticulata “Chachi” by Professor Yan Zhuyun from the Department of Traditional Chinese Medicine, College of Pharmacy, Chengdu University of Traditional Chinese Medicine. A linen bag containing the orange peels was placed in the cool, dry, and ventilated warehouse within the 302 Hospital of people's liberation army, No. 100, Middle West Fourth Ring Road, Fengtai District, Beijing City; the pharmacy building of the Chengdu University of Traditional Chinese Medicine, Wenjiang District, Chengdu City, Sichuan Province; No. 208, Didong Road, Pengjiang District, Jiangmen City, Guangdong Province; the Yunnan University of Traditional Chinese Medicine, Chenggong District, Kunming City, Yunnan Province. This allowed the product to age naturally. The same number of samples were removed from the linen bag every 3 months of storage in Sichuan and Guangdong, and every 6 months in Beijing and Yunnan. Samples were stored at −20°C before analysis of volatile compounds and were deposited at −80°C before DNA extraction. The details of the samples are shown in Table 1.
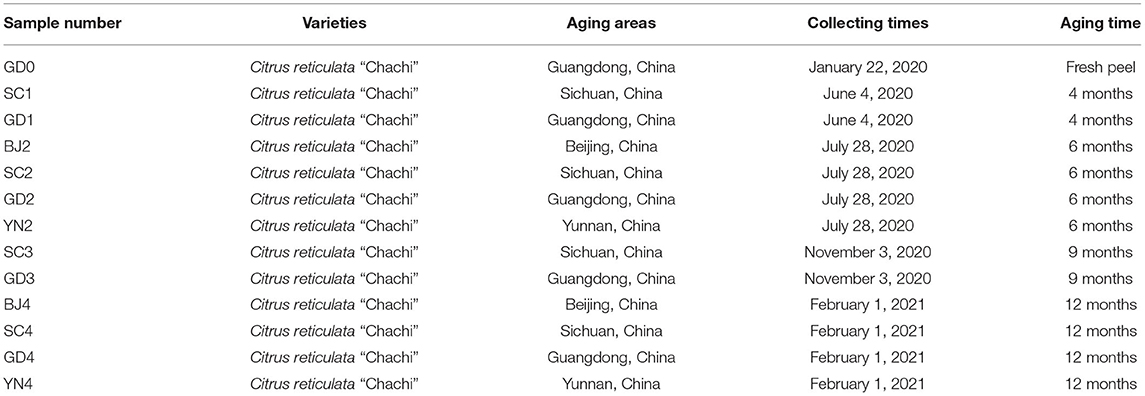
Table 1. Information of Citrus reticulata “Chachi” samples.
The environmental factors (temperature and humidity) in the aging process of the dried orange peel were recorded by a DS 1923 button (Wdsen Electronic Technology Co., Ltd) type temperature-humidity recorder. All these parameters are shown in Figure 1.
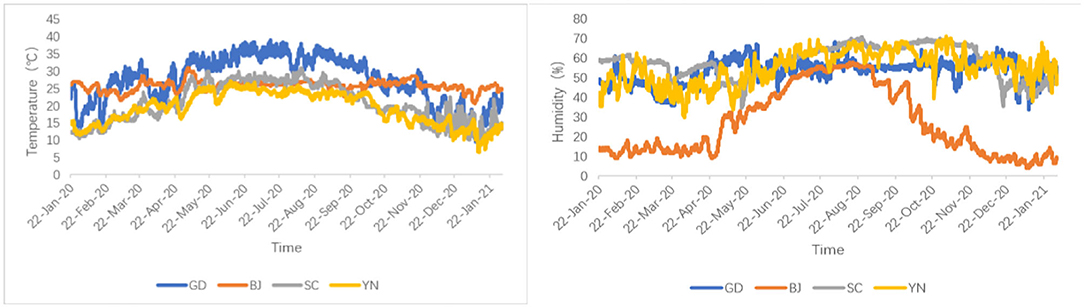
Figure 1. Temperature and humidity curve of the aging process in different areas.
High Throughput Sequencing Analysis
The DNA was extracted by referring to our previous methods (Zhang et al., 2017a,b; Yang et al., 2021a,b), The diluted genomic DNA was used as a template for PCR amplification with barcode-containing specific primers, the Phusion® High-Fidelity PCR Master Mix with GC Buffer, and a high-efficiency high-fidelity enzyme. The V4 regions of the bacterial 16S rRNA gene and the internal transcribed spacer (ITS1) regions of fungal rRNA genes were amplified using the primers 515F (5′-GTGCCAGCMGCCGCGGTAA-3′)/806R (5′-GGACTACHVGGGTWTCTAAT-3′) and ITS1-1F-F (5′-CTTGGTCATTTAGAGGAAGTAA-3′) /ITS1-1F-R (5′-GCTGCGTTCTTCATCGATGC-3′) with barcodes, respectively (Wang et al., 2020). The PCR reactions (30 μl) included the Phusion Master Mix (2x; 15 μl), positive and negative primers (2 μmol/L; each at 1.5 μl), genomic DNA (gDNA; 1 mg/L, 10 μl), and ddH2O (2 μl). The bacterial PCR cycling conditions were 98°C for 1 min, followed by 30 cycles of 98°C for 10 s, 50°C for the 30 s, 72°C for 30 s, and finally, 72°C for 5 min. The fungal PCR cycling conditions were 98°C for 30 s, followed by 35 cycles of 98°C for 10 s, 56°C for the 30 s, 72°C for 15 s, and finally, 72°C for 7 min. The PCR product was detected by 2% agarose gel electrophoresis. The amplified product was visualized by a gel recovery kit. A library was constructed using a TruSeq DNA PCR-Free Library Preparation Kit. The library was evaluated by Qubit and Q-PCR and subjected to sequencing using NovaSeq 6000. The data presented in the study are deposit ed in the NCBI repository, accession number are PRJNA854783 and PRJNA854691.
Steam Distillation for Volatile Oil
About 50.00 g PCR of coarse powder was put into a 1,000 ml distillation flask. About ten times that amount of water was added. Samples were soaked for 1 h. Volatile oil distillation apparatus was set according to Chinese Pharmacopeia. The oil was distilled, obtained from the condenser, and dried over anhydrous sodium sulfate at 4°C for 24 h; 50 μl of volatile oil from each sample was taken and put into a 1 ml volumetric flask with the solution to the scale line with n-hexane. The samples were then filtered through a 0.22 μm filter and were analyzed.
Volatile Profiles by GC-MS
The GC-MS technique was used in this study to identify the volatile. The column was an HP-5MS quartz capillary column (0.25 mm×30 m), 0.25 μm. The oven temperature was programmed as follows: the initial column temperature was 60°C, with 2°C /min rise to 82°C, then 20°C /min rise to 144°C (to keep 3 min), 8°C /min rise to 260°C (to keep 10 min). The carrier gas He was in the constant current mode, the flow rate was 1.0 ml/min, the split ratio was 10:1, and the autosampler was 1.0 μl. The ion source was electrospray (EI), the ionization energy injector temperature was 270°C, the transmission line temperature was 240°C, and the solvent delay was 9 min.
Data Analysis
The barcode sequences and PCR amplification primer sequences were removed from each data file. Reads from each sample were spliced using the FLASH v1.2.7 software. The spliced sequences obtained were the raw tags. These files were filtered to obtain the clean tags (Bokulich et al., 2013). The quality of the tags was evaluated with the QIIME v1.9.1 software (Caporaso et al., 2010). The processed sequence tags were compared with those present in the unit database using the UCHIME algorithm to detect chimeric sequences. The chimeric sequences were removed (Bokulich et al., 2013) to obtain the final list of effective tags. The operational taxonomic unit (OTU) clustering and species annotation was performed by UPARSE v7.0.1001 (Caporaso et al., 2010) software to generate clusters from all the effective tags from the samples. The sequences were clustered into OTUs with 97% identity. ITS sequencing data analyses were done following annotation analysis of representative OTU sequences by the BLAST method and the Unit database in QIIME software. 16S sequencing data were analyzed by species annotation analysis of representative OTU sequences performed by the MOTHUR method and SSU rRNA database (Edgar, 2013) in the QIIME software. The community composition of each sample was determined at each classification level.
Alpha and beta diversity was assessed by the QIIME software, used to calculate the observed species by the Shannon and abundance-based coverage estimation (ACE) diversity plot and the Chao index. The goods coverage indices and the unweighted pair-group method were assessed by the arithmetic means (UPGMA) and were used to construct the UPGMA sample clustering tree. The R software (V2.15.3) was used to draw the petal diagram and non-metric multidimensional scale (NMDS). Volatile components were identified by the NIST MS Search Program (version 2.0g). The similarity of volatile compounds was detected in over 80% of the standard spectra library. The relative percentage content of each component was calculated by the area normalization method. SIMCA-P 14.0 (Umetrics, Umeå, Sweden) was used to perform principal component analysis (PCA) together with the orthogonal partial least squares discriminant analysis (OPLS-DA), and the differential chemical markers were estimated by using variable importance in projection (VIP) values. Spearman's correlation was used to conduct analyses of volatiles and microorganisms. The experiment was carried out in three technical replicates to ensure the reliability of the data.
Results
Abundance and Diversity of Microbial Communities in Different Samples
Total fungal tags 1 115 554 with an average of 85 812 tags per sample, and 1 077 293 bacterial tags with an average of 82 869 tags per sample using the tags quality control process of the Qiime (v1.7.0) software were performed. Sequences were grouped into 5 776 OTUs for fungi and 26 047 OTUs for bacteria (both at 97% similarity level), as shown in Figure 2.
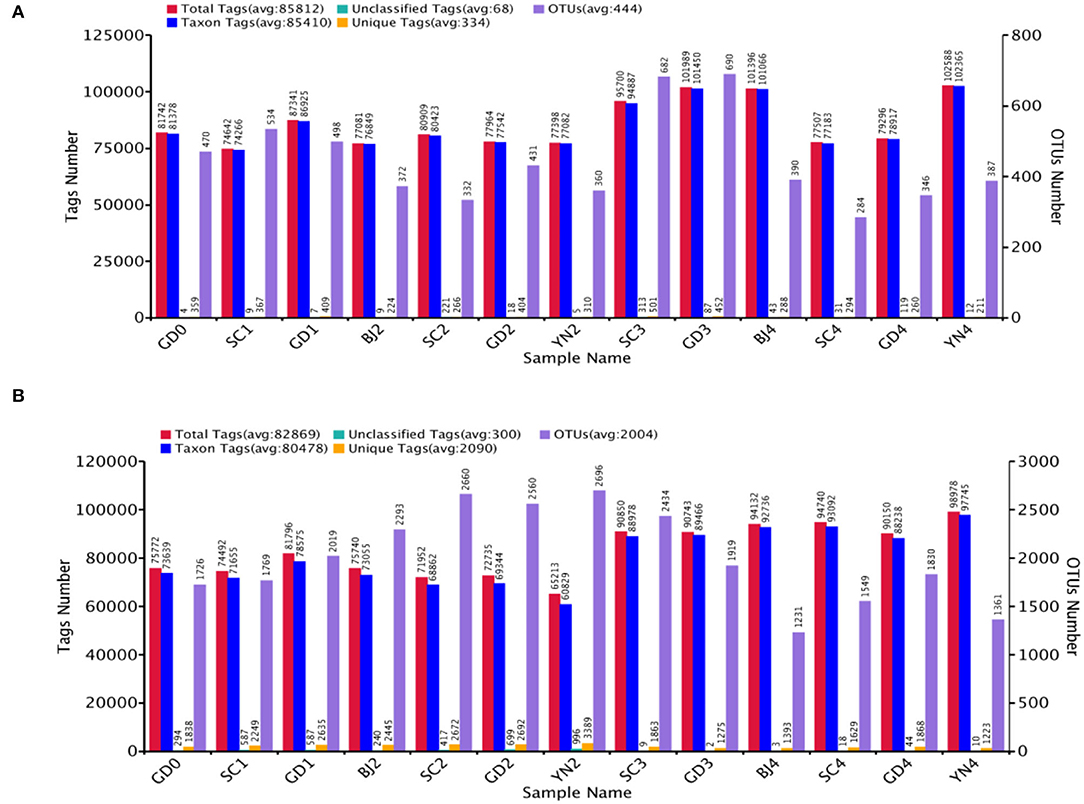
Figure 2. (A) The number of tags and OTUs of fungi in Citrus reticulata “Chachi” samples. (B) The number of tags and OTUs of bacteria in Citrus reticulata “Chachi” samples. Total Tags: the total number of stitching sequences after filtering, Taxon Tags: the number of tags that build OTUs and provide information about classification, Unclassified Tags: the number of tags that build OTUs but do not provide any information about classification, Unique Tags: the number of tags with a frequency of 1 which cannot be clustered into OTUs, OTUs: the final number of OTUs.
We applied indices of community richness, including Shannon, Simpson, Chao, and ACE indexes. Shannon and Simpson indexes were used to estimate the diversity of the microbial community, while the Chao1 and ACE estimators were used to estimate the microbial richness of samples (Zhang et al., 2017a,b). The Shannon and Simpson indexes had no statistical differences (p > 0.05), while the Ace and Chao ones had statistical differences (p < 0.05) with larger values indicating greater abundance. The combined data revealed an increase in the abundance and number of distinct fungal species on the surface of the PCR in its samples stored for 9 months of aging, where the temperature and humidity underwent a gradual increase. The combined data revealed an increase in the abundance and number of distinct bacterial species on the surface of the PCR in the 6 and 9 months of aging, with the temperature, and humidity undergoing a gradual increase (Table 2). The warm and moist climate facilitated fungal growth on the PCR surface. Bacterial OTUs were estimated to be higher than that fungal OTUs as shown in the Petal diagram in Figures 3A,B. The petal diagram for fungi further showed that 152 OTUs from the core microflora were detected in all samples, among which the number of unique OTUs was more abundant in the samples of 9 months of aging. As far as bacteria are concerned, the petal diagram showed that 405 OTUs belonged to the core microflora and they were detected in all samples, among which the number of unique OUTs was bigger when the samples were after 6 and 9 months of aging.
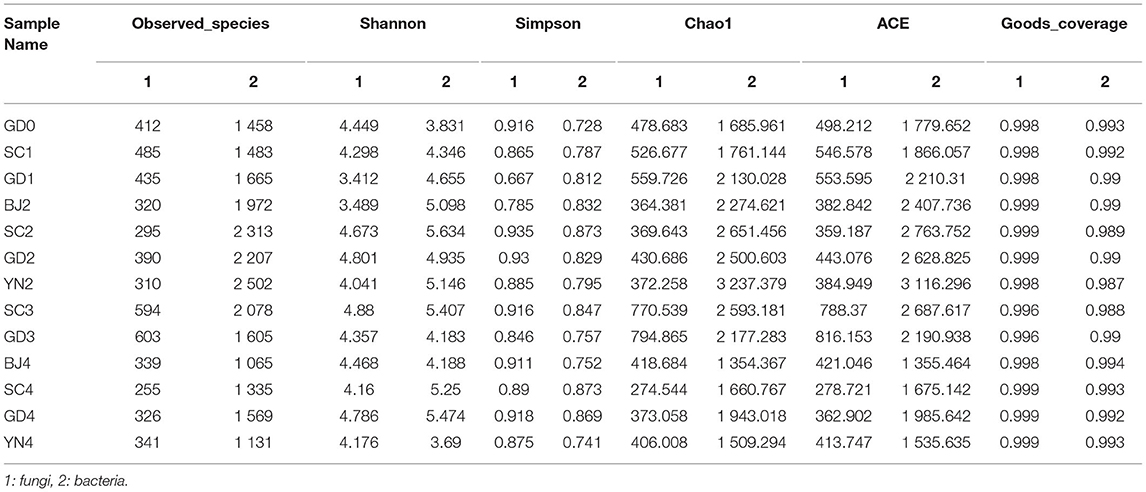
Table 2. Diversity index of the microbial community in Citrus reticulata “Chachi” samples.
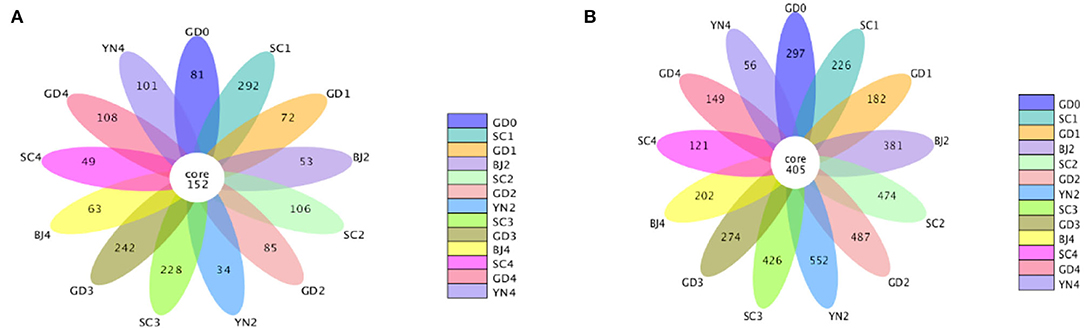
Figure 3. (A) Petal diagram of the fungal community present in Citrus reticulata “Chachi” samples. (B) Petal plot of the bacterial community present in Citrus reticulata “Chachi” samples.
Comparison of Fungal Communities in Different Samples
The composition of the fungal communities identified on the PCR surface at each sampling point was analyzed and identified. It was found that the fungal community composition on the surface of PCR was similar, but the abundance of the fungal communities changed significantly during aging. At the phylum level, these fungi were distributed mainly among the Ascomycota (70.5%) and Basidiomycota (21.85%), with smaller populations of Glomeromycota, Rozellomycota, Mortierellomycota, Chytridiomycota, Mucoromycota, Blastocladiomycota, Basidiobolomycota, and Olpidiomycota, among others (Figure 4).
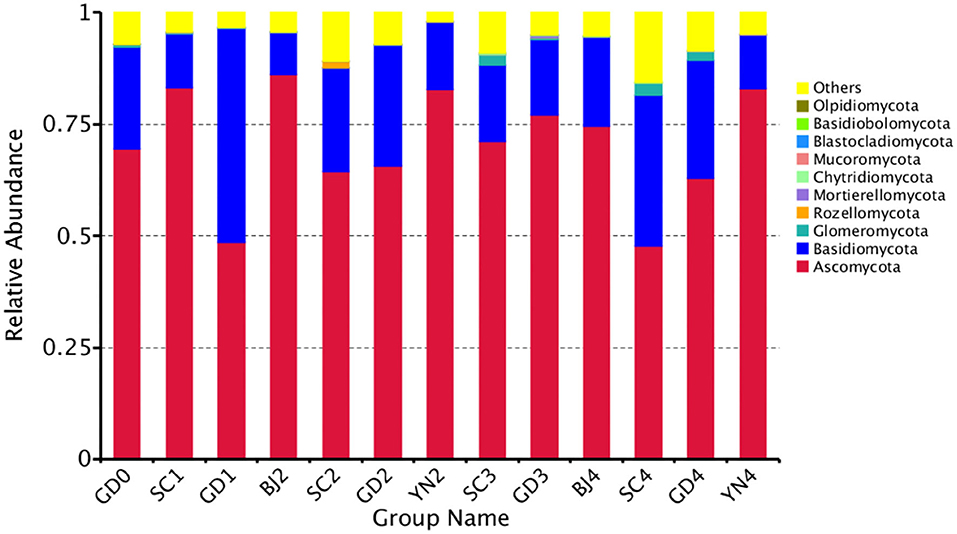
Figure 4. Relative abundance of fungi at phylum levels. Distribution of 10 most abundant fungal phylum present in Citrus reticulata “Chachi” samples. “Others” in the last column refers to the sum of less abundant fungal phylum. Each number represents average of three replicates.
According to the species annotation and abundance information at the genus level (Figure 5), together with the abundance information associated with each sample, the top 35 identified genera were selected and clustered in a heat map. The species of Z > 1 in the heat map were defined as dominant fungal genera and were plotted as a table. According to the results in Table 3 and Figure 5, all the known fungi of the genera, Phaeosphaeriopsis and Pseudocercospora were predominant in the fresh citrus peels, while the genus Fusicolla, Russula, and Chaetomium were mainly distributed in the SC1. The fungi of the genera Colletotrichum and Exobasidium were predominant in GD1. Colletotrichum and Sarcopodium appeared more abundant when the samples were stored for BJ2. Rhodotorula and Aspergillus appeared more abundant when samples were stored for SC2. Cryptococcus and Hannaella were predominant in GD2. Trichomerium and Zasmidium were principal in YN2. Periconia and Xeromyces were found in SC3, while Fusarium, Peniophora, and Cystobasidium were more abundant when samples were stored for GD3. Pseudocercospora, Hannaella and Cladosporium were found in BJ4. Aspergillus and Cladosporium were predominant in SC4. Neopyrenochaeta and Aspergillus were predominant in GD4, while Gibberella, Cystobasidium, and Cladosporium gathered more when samples were stored for YN4. Noteworthy, our findings highlighted that the coexisting Aspergillus niger played an important role in the change of flavonoids and volatile oil in PCR (Wang et al., 2015; Zhang et al., 2017a,b). Aspergillus is also proven to be the dominant fungal genera on the surface of PCR aged in Sichuan and Guangdong areas.
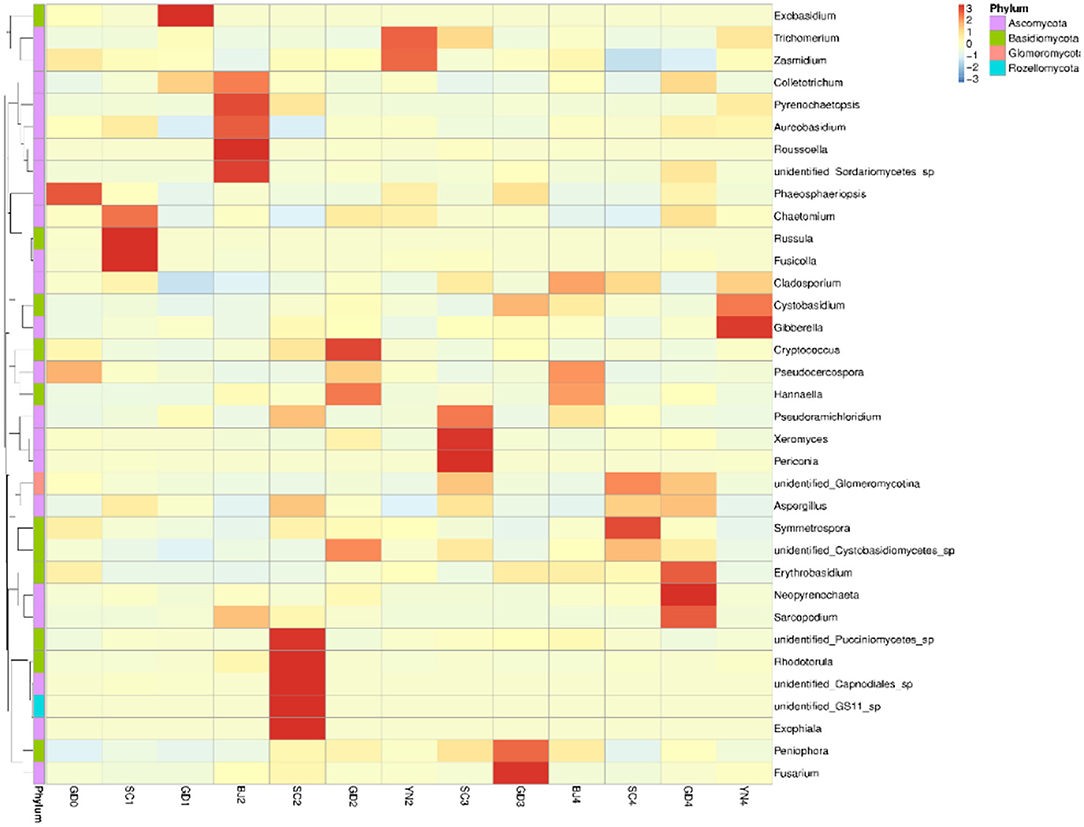
Figure 5. Heatmap depicting relative species abundance. Plotted by sample name on the X-axis and the Y-axis represents the genus. The cluster tree on the left side of the graph is a species cluster tree.
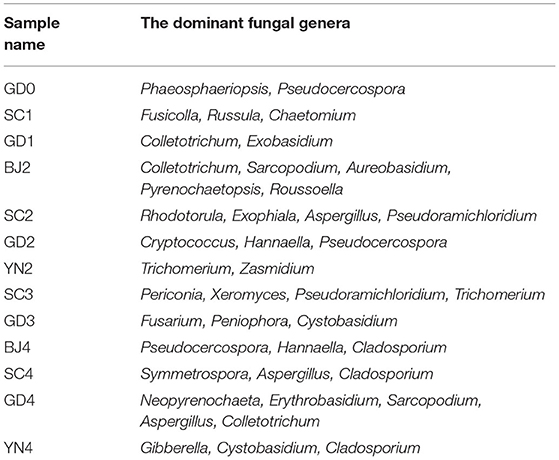
Table 3. Distribution of the dominant fungal genera in all samples.
An NMDS analysis reflected the identification of fungi contained in each PCR specimen in a multidimensional space in the form of dots. The NMDS analyses concerning the OTU levels are shown in Figure 6A. We observed that when the community composition of the samples was more similar, they fell closer to one another in the NMDS diagram. As shown in Figure 6A, SC3 and GD3 were distant from those representing the other samples. The distances between the remaining samples were relatively small. To evaluate the similarities and differences between these samples, we carried out cluster analysis and constructed a cluster tree. Weighted and unweighted UniFrac distance matrices were used as the basis for UPGMA clustering analysis. The clustering results were integrated with the relative abundance data, as shown in Figure 6B. According to the UPGMA clustering tree results, the composition of the fungal species was similar during the aging process and, as such, could be evaluated as a single group.
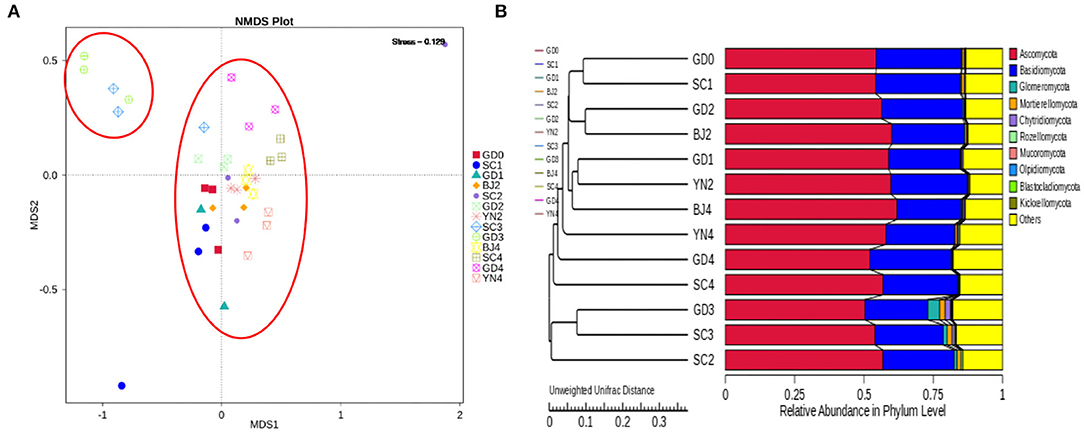
Figure 6. (A) NMDS analysis of fungal community composition. Each point represents a sample, plotted by the second principal component on the Y-axis and the first principal component on the X-axis, which was colored by group. (B) UPGMA clustering tree based on weighted UniFrac distance. UPGMA clustering tree (at left). The relative phylum-level abundance map (at right).
Comparison of Bacterial Communities in Different Samples
The composition of the bacterial communities identified on the PCR surface at each sampling point was analyzed and identified. Results are shown in Figure 7. It was found that the bacterial community composition on the surface of PCR was similar, but the abundance of the bacteria changed significantly during aging. At the phylum level, these bacteria were distributed mainly among the Proteobacteria (45.32%), Cyanobacteria (38.59%), Firmicutes (6.65%), Bacteroidota (2.1%), Actinobacteriota (1.89%), Acidobacteriota (0.99%), Planctomycetes (0.24%), Verrucomicrobiota (0.18%), and Gemmatimonadota (0.07%) (Figure 7).
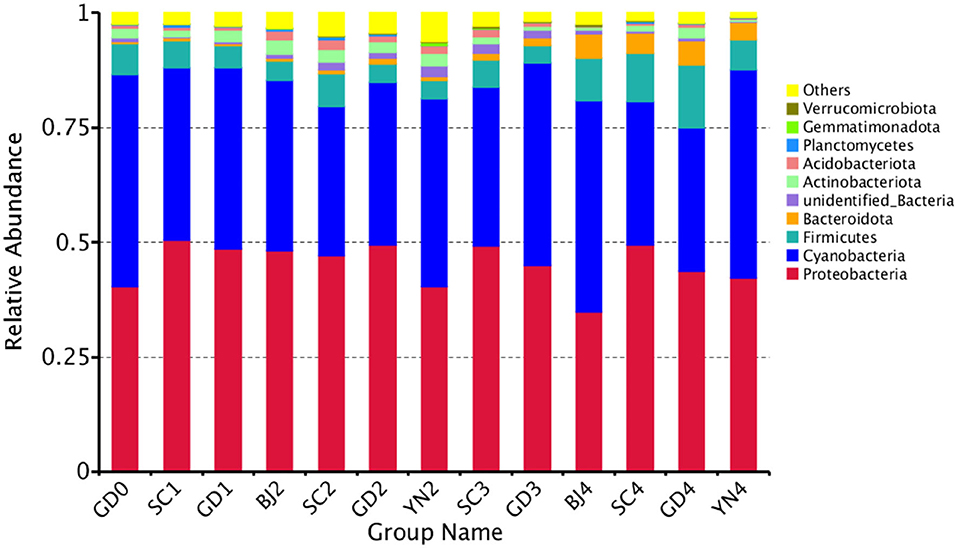
Figure 7. Relative abundance of bacterial at phylum levels. Distribution of 10 most abundant bacterial phylum present in Citrus reticulata “Chachi” samples. “Others” in the last column refers to the sum of less abundant bacterial phylum. Each number represents average of three replicates.
According to the results in Table 4 and Figure 8, all the known bacteria of the genera Lactobacillus were predominant in fresh citrus skin, while the genus Pseudomonas and Lactobacillus were abundantly distributed in SC1. Methylobacterium was predominant in GD1. Bryobacter and Terriglobus were predominant in BJ2. Paenibacillus and Lysinibacillus gathered more when samples were stored for SC2. Mesorhizobium and Ralstonia were predominant in GD2. Ralstonia was predominant in YN2. Bacillus and Sphingomonas were found in SC3, while Delftia, Streptococcus, Vibrio, and Sphingomonas gathered more when samples were stored for GD3. Alistipes, Acinetobacter, and Pseudocercospora were found in BJ4. Staphylococcus and Prevotella were predominant in SC4. Lautropia and Hydrogenophilus were predominant in GD4, while Herbaspirillum gathered more when samples were stored for YN4. Interestingly, Methylobacterium, Sphingomonas, Bacillus, and Pseudomonas accelerated the biotransformation of volatile oil in PCR. Methylobacterium, Sphingomonas, Bacillus, and Pseudomonas were dominant bacterial genera on the surface of PCR aged in Sichuan and Guangdong areas, indicating that Sichuan and Guangdong areas were suitable for natural aging of PCR.
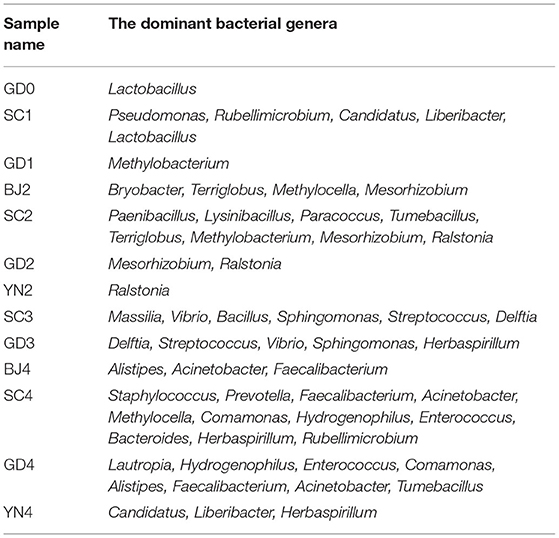
Table 4. Distribution of the dominant bacterial genera in all samples.
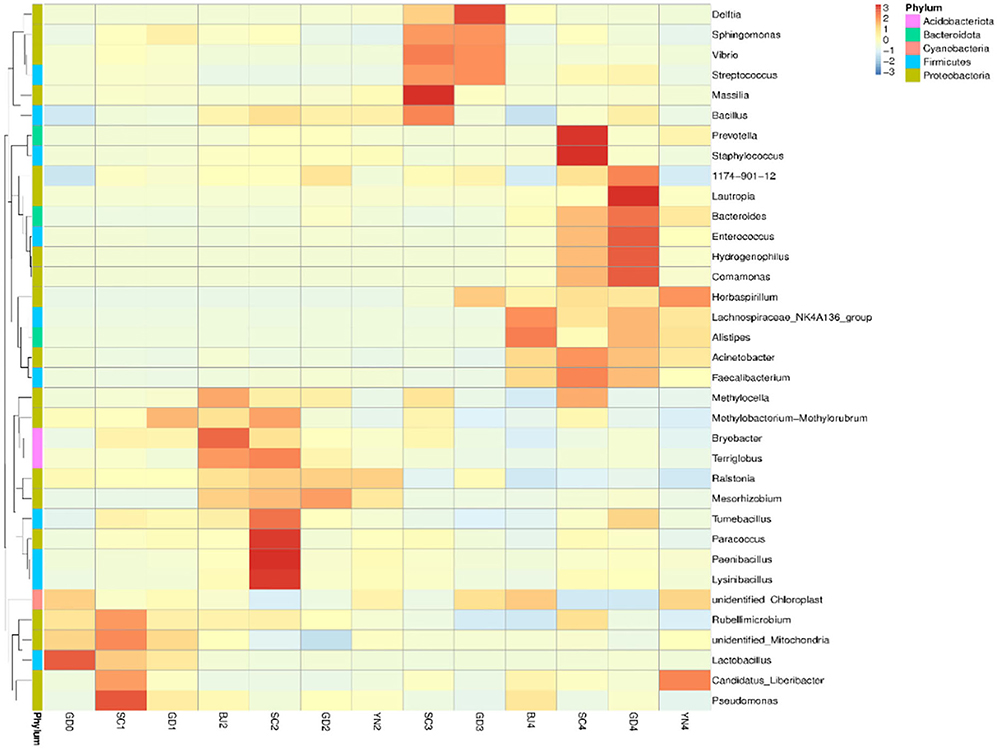
Figure 8. Heatmap depicting relative species abundance. Plotted by sample name on the X-axis and the Y-axis represents the genus. The cluster tree on the left side of the graph is a species cluster tree.
To evaluate the similarities and differences between these samples, we carried out an MNDS analysis. The obtained results are shown in Figure 9. It was found that the distances between the PCR samples with the same aging time were relatively small. According to the UPGMA clustering tree results, the composition of bacterial species was similar during the aging process and, as such, could be evaluated as a single group (Figure 9).
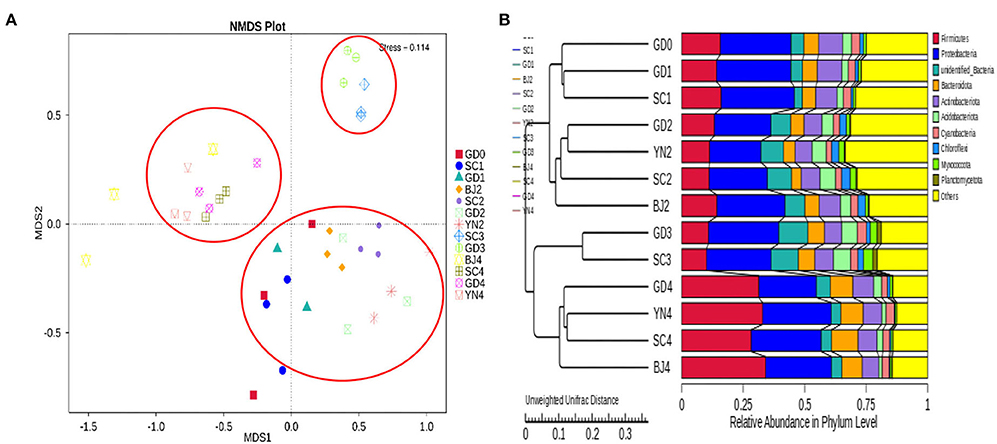
Figure 9. (A) NMDS analysis of fungal community composition. Each point represents a sample, plotted by the second principal component on the Y-axis and the first principal component on the X-axis, which was colored by group. (B) UPGMA clustering tree based on weighted UniFrac distance. UPGMA clustering tree (at left). The relative phylum-level abundance map (at right).
GC/MS Analysis of Volatile Components
To compare volatile components of PCR samples at different stages, the chemical profiling of volatile components was analyzed by GC/MS. Steam distillation for volatile oil of PCR was prepared according to the method below 1.3, and GC/MS analysis was performed according to the method described in Section Materials and Methods. The total ion chromatogram (as shown in Supplementary Figure 1) and mass spectrum data of PCR volatile oil sample were obtained. The volatile compounds in PCR samples were identified by comparing their mass spectra with reference mass spectra from the National Institute of Standards and Technology (NIST) and related literature (Liu, 2018; Wang et al., 2018; Sheng et al., 2020). A total of 55 volatile compounds were identified, and there were no differences among the 55 volatile compounds of PCR samples at different stages. The relative percentage content of each component was calculated by the area normalization method. The CAS number, retention time, and relative contents of the identified volatile compounds are summarized in Table 5. The results indicated that D-Limonene (V9) was the most abundant volatile compound in PCR samples at different storage periods and aging stages with its relative content in the range of 65.51–72.64%, followed by gamma-Terpinene (V11) with a relative content of 14.32–16.81%. The total contents of these two volatile components accounted for about 90% of the volatile oil content.
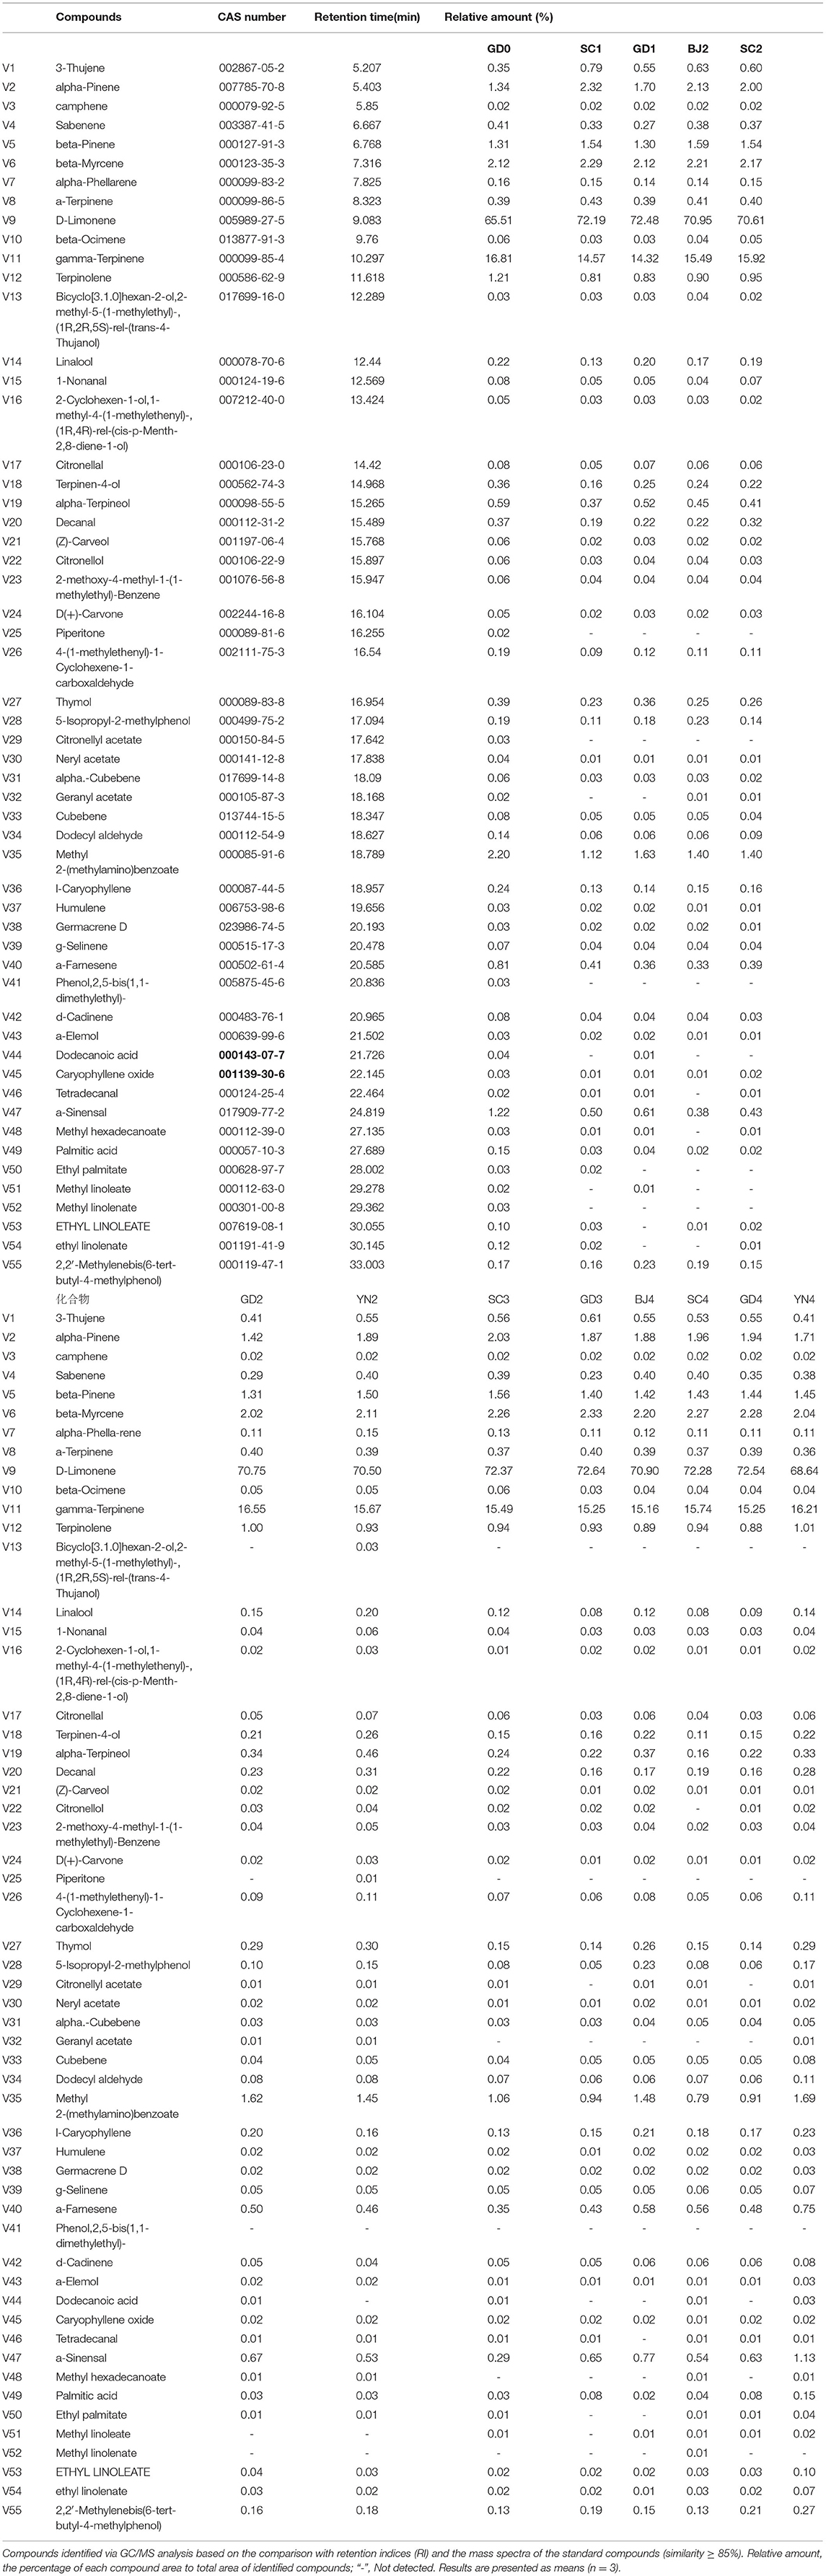
Table 5. Volatile compounds of Citrus reticulata “Chachi” samples.
It is clear that the volatile compounds present in the volatile oils of PCR samples at different stages were the same, but their relative contents were different. The results indicated that the variation in the volatile chemical compositions occurred during aging. To further compare the difference in volatile components of PCR samples at different developmental stages, multivariate analysis methods, including PCA and OPLS-DA, were performed based on the relative contents of the 55 volatile compounds. This allowed us to find out the different components in the volatile oil samples of PCR at different stages, and to clarify the dynamic change process of volatile components of PCR.
Principal Component Analysis
PCA is an unsupervised pattern recognition method. PCA could be used for analyzing, classifying, and reducing the dimensionality of numerical datasets, and has been widely used in discriminating and comparing the composition of samples from different areas, different varieties, and different harvest times (Huang et al., 2018b; Chen et al., 2019; Xue et al., 2019). PCA was first employed to visualize the grouping trends based on the relative contents of the 55 volatile components. The first and second principal components described 70.3% and 10.8% of the variability in the original observations, and the first two principal components accounted for 81.1% of the total variance. Our analysis showed that the established PCA model had a good distinction. The first two principal components reflected the main characteristics of the PCR samples. As shown in Figure 10A, SC3, GD3, SC4, and GD4 were distant from those represented in the other samples.
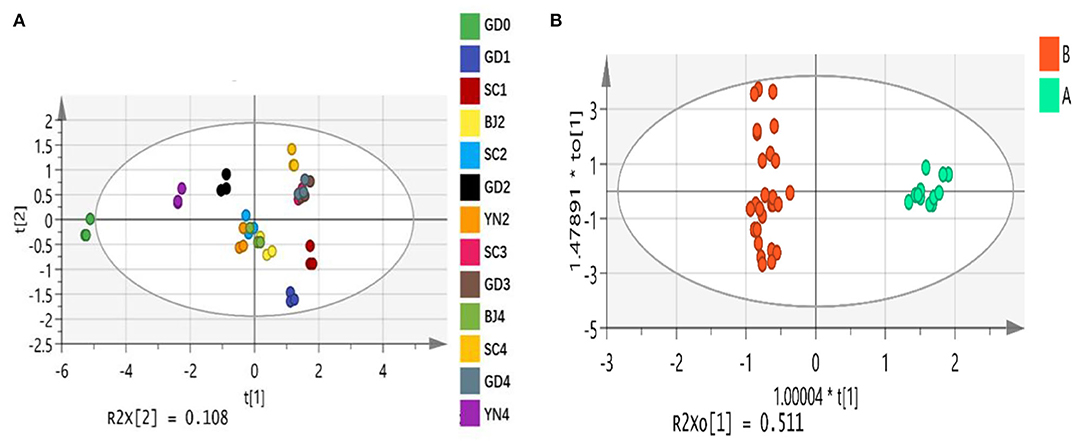
Figure 10. (A) The principal component analysis scores plot of Citrus reticulata “Chachi” volatile oil samples in different aging time. (B) The orthogonal partial least square-discriminate analysis scores plot of Citrus reticulata “Chachi” volatile oil samples in different aging time.
Orthogonal Partial Least Squares Discriminant Analysis
OPLS-DA is a supervised pattern recognition method. To find potential differential chemical markers that contributed to the differences among PCR samples, supervised OPLS-DA was used based on the relative contents of the 55 volatile components. The explanatory ability parameters of OPLS-DA were 0.957. The predictive ability parameter was 0.989, which revealed a good classification and prediction ability of the model. Similar to the PCA results, the OPLS-DA scores plot (Figure 10B) showed that the PCR samples could also be readily classified into six groups according to six different developmental stages. To select the differential chemical markers, the 55 volatile compounds were further screened based on variable importance in projection (VIP) values. The VIP values represented the differences between the variables, and components that played important roles in differentiation were picked out when the VIP values were more than 1.0. A total of ten volatile compounds, including alpha-Pinene (VIP = 1.33), beta-Myrcene (VIP = 1.23), D-Limonene (VIP = 4.79), gamma-Terpinene (VIP = 2.04), Terpinen-4-ol (VIP = 1.03), alpha-Terpineol (VIP = 1.61), Thymol (VIP=1.32), 5-Isopropyl-2-methylphenol (VIP = 1.01), Methyl 2-(methylamino)benzoate (VIP = 2.72) and a-Sinensal (VIP = 1.41)with their VIP values (>1.0) were selected as chemical markers that were responsible for the significant intergroup differences of PCR samples.
Further, we analyzed and compared the dynamic change process of volatile components of 10 chemical markers. The relative contents of gamma-terpinene, Terpinen-4-OL, alpha-Terpineol, Thymol, Methyl 2-(methylamino) Benzoate and a-Sinensal reached the highest peaks in fresh peels. The relative contents of alpha-Pinene reached the highest values in GD1. The relative content of 5-isopropyl-2-methylphenol changed little while the relative content of beta-Myrcene and D-Limonene reached the highest in GD3.
Spearman-Based Correlation Analysis Between Microbiota and Chemical Markers
Spearman analysis was used to analyze the correlation between the relative abundance of the top 35 microbial genera and the PCR chemical markers. Results are shown in Figure 11. All known fungi of the genera, Exobasidium, Zasmidium, Xeromyces, Pseudocercospora, Russula, and Aspergillus were strongly correlated with chemical markers. Among them, Aspergillus was strongly correlated with most of the selected chemical markers. In detail, it was positively correlated with beta-Myrcene and D-Limonene and negatively correlated with Terpinen-4-ol, alpha-Terpineol, Thymol, 5-Isopropyl-2-methylphenol, and Methyl 2-(methylamino)benzoate. Aspergillus, especially Aspergillus niger, played an important role in the change of flavonoids and volatile oil in PCR. Data show that bio-augmented fermentation with A. niger NCUF413 was proven to enhance the liquor yield and improve the flavor of the liquor samples (Pan et al., 2020). All the known bacteria of the genera, Herbaspirillum, Sphingomonas, Streptococcus, and Lactococcus were strongly correlated with chemical markers. Among them, Sphingomonas was positively correlated with alpha-Pinene, beta-Myrcene, and D-Limonene and negatively correlated with gamma-Terpinene, Terpinen-4-ol, Thymol, Methyl 2-(methylamino)benzoate and a-Sinensal. Lactococcus was positively correlated with Terpinen-4-ol, alpha-Terpineol, Thymol, and 5-Isopropyl-2-methylphenol. Sphingomonas, as the dominant microbial genera of tobacco, was also proven to increase tobacco aroma. In our case, Sphingomonas and Lactococcus accelerated the biotransformation of volatile oil in PCR.
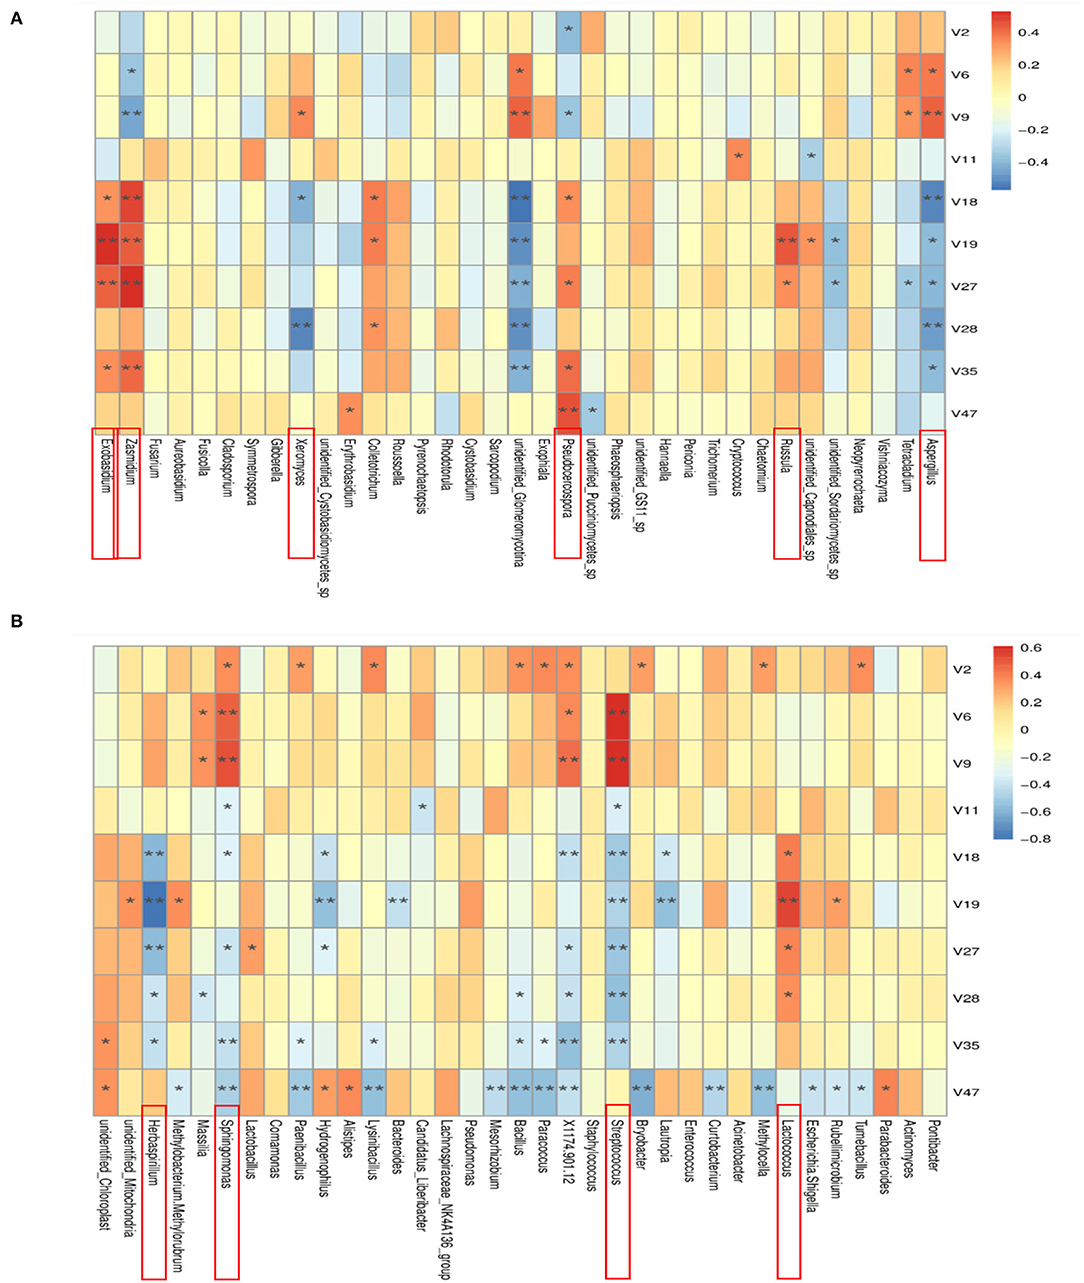
Figure 11. Spearman correlation analysis heat map between the top 35 bacteria (A) and fungi (B) in relative abundance and the chemical markers that change significantly during aging of Citrus reticulata “Chachi”. The closer r is to 1 (red), it indicates a positive correlation, and the closer to −1 is a negative correlation (blue). The asterisk represented the level of significance, “*” represented p < 0.05, “**” represented p < 0.01.
Conclusions
Aging of PCR is very important to improve its quality. However, the natural aging process of PCR takes a long time and costs a lot. At present, the use of microbial transformation to increase active components and improve quality is widely studied. Therefore, after clarifying the correlation between volatile contents and microbial population of PCR, we can explore whether there is a method of “the artificial aging technology” to shorten the aging time, reduce economic loss, and waste of resources will be useful. In addition, microbial diversity is abundant, and their growth, physiological and biochemical characteristics will be unstable with the change in the environment. Pericarpium Citri Reticulatae can provide nitrogen and carbon sources for microbial respiration, PH alteration caused by the acid-producing microbes also affects microbial growth. Further exploring the microbial succession and its relative environmental factors could provide valuable information for understanding the mechanism of Pericarpium Citri Reticulatae aging process.
In this study, the microbial population structure and volatile components of the 1-year aging process of PCR from Beijing, Sichuan, Guangdong, and Yunnan were analyzed. The microbial population structure in Citrus reticulata “Chachi” with different aging times was consistent in composition and structure but the dominant microorganisms on its surface were different significantly. GC/MS was applied to the analysis of volatile components, and 55 volatile compounds were detected. SC3, GD3, SC4, and GD4 were distant from those representing the other samples, alpha-pinene, beta-myrcene, D-Limonene, and other 10 chemical markers were significantly different from other samples. This indicated that volatile components' relative contents were similar in areas with similar environmental factors. We further proved that Exobasidium, Xeromyces, Pseudocercospora, Russula, Aspergillus, Herbaspirillum, Sphingomonas, and Streptococcus were the dominant microbial genera in Sichuan and Guangdong, and their abundance further showed strong connections with volatile components of chemical markers. Our results allow us to highlight the key influencing factors of its aging quality. To further clarify their exact contribution, using pure strains of these microorganisms to perform fermentation, is required to validate their applications.
Data Availability Statement
The authors acknowledge that the data presented in this study must be deposited and made publicly available in an acceptable repository, prior to publication. Frontiers cannot accept a article that does not adhere to our open data policies.
Author Contributions
FY wrote the manuscript. LH and MS analyzed data. FW modified the details. HC and YL conceived of or designed the study. All authors agreed on the contents of the paper.
Funding
This research was supported by grants from the National Natural Science Foundation of China (No.81973436).
Conflict of Interest
The authors declare that the research was conducted in the absence of any commercial or financial relationships that could be construed as a potential conflict of interest.
Publisher's Note
All claims expressed in this article are solely those of the authors and do not necessarily represent those of their affiliated organizations, or those of the publisher, the editors and the reviewers. Any product that may be evaluated in this article, or claim that may be made by its manufacturer, is not guaranteed or endorsed by the publisher.
Supplementary Material
The Supplementary Material for this article can be found online at: https://www.frontiersin.org/articles/10.3389/fmicb.2022.930845/full#supplementary-material
Supplementary Figure 1. The typical total ion chromatogram of PCR volatile oil sample by GC/MS.
References
Bokulich, N. A., Subramanian, S., Faith, J. J., Gevers, D., Gordon, J. I., Knight, R., et al. (2013). Quality filtering vastly improves diversity estimates from Illumina amplicon sequencing. Nat. Methods 10, 57–59. doi: 10.1038/nmeth.2276
Caporaso, J. G., Kuczynski, J., Stombaugh, J., Bittinger, K., Bushman, F. D., Costello, E. K., et al. (2010). QIIME allows analysis of high-throughput community sequencing data. Nat. Methods 7, 335–336. doi: 10.1038/nmeth.f.303
Caporaso, J. G., Lauber, C. L., Walters, W. A., Berg-Lyons, D., Huntley, J., Fierer, N., et al. (2012). Ultra-high-throughput microbial community analysis on the Illumina HiSeq and MiSeq platforms. ISME J. Multidiscip. J. Microb. Ecol. 6, 1621–1624. doi: 10.1038/ismej.2012.8
Chen, C. C. (2017). Characterization of Microbial Community Diversity and Metabolites Changes of Pericarpium Citri Reticulatae ‘Chachiensis' During Aging Process, South China University of Technology. Guangzhou.
Chen, H., Gao, M., Luo, X. Q., Chen, H. F., Yuan, J. B., and Yang, W. L. (2019). Principal component analysis and discriminant analysis of 12 effective chemical constituents in Aurantii Fructus from different areas. Chin. Tradit. Herb. Drugs 50, 3433. doi: 10.7501/j.issn.0253-2670.2019.14.025
Degnan, P. H., and Ochman, H. (2012). Illumina-based analysis of microbial community diversity. ISME J. 6, 183–194. doi: 10.1038/ismej.2011.74
Deng, Y. K., Huang, D., Han, B. L., Ning, X. Q., Yu, D., Guo, H. X., et al. (2021). Correlation: between autochthonous microbial diversity and volatile metabolites during the fermentation of Nongxiang Daqu. Front. Microbiol. 12, 688981. doi: 10.3389/fmicb.2021.688981
Edgar, R. C. (2013). UPARSE: highly accurate OTU sequences from microbial amplicon reads. Nat. Methods 10, 996. doi: 10.1038/nmeth.2604
He, J. (2019). Characterization of the Uniqueness and Correlation of Bacterial Community and Phytochemicals in Citri Reticulatae‘Chachiensis'. Guangzhou: South China University of Technology.
Huang, C. Y., Ouyang, D. W., Niu, L. X., Zhou, J., Lin, S., and Hu, X. (2018b). Study on quality evaluation of Dihuang (Rehmannia glutinosa) by two-dimension HPLC fingerprints and chemometrics methods. China J. Chin. Mater. Med. 43, 8. doi: 10.19540/j.cnki.cjcmm.20180224.001
Huang, X. N., Yu, S. Z., Han, B. Z., and Chen, J. Y. (2018a). Bacterial community succession and metabolite changes during sufu fermentation. LWT 97, 537–545. doi: 10.1016/j.lwt.2018.07.041
Li, T., Du, L. P., Wang, C., Han, P., Xiao, D.G., Li, C.G., et al. (2014). “The Effect of the Enzyme on the Liquid-State Fermentation of Pu'er Tea,” in Proceedings of the 2012 International Conference on Applied Biotechnology (ICAB 2012). 249, 477–486. doi: 10.1007/978-3-642-37916-1_49
Liu, S. J. (2018). Correlation Research of Environmental Factors, Fungi and Effective Substance in the Aging Process of Pericarpium Citri Reticulatae, Chengdu University of Traditional Chinese Medicine. Chegndu.
Liu, S. Q., Lei, C. X., and Zhao, Y. L. (2010). Thinking on the research methods of microbial community structure and diversity in dark tea. Tea Sci. Technol. 1, 9–11. doi: 10.3969/j.issn.1007-4872.2010.01.004
Lu, Y., Sun, F., Wang, W. X., Liu, Y. Q., Wang, J., Sun, J. F., et al. (2020). Effects of spontaneous fermentation on the microorganisms diversity and volatile compounds during 'Marselan' from grape to wine. LWT 134, 110193. doi: 10.1016/j.lwt.2020.110193
Lv, X. R., Li, Y., Cui, T. Q., Sun, M. T., Bai, F. L., Li, X. P., et al. (2019). Bacterial community succession and volatile compound changes during fermentation of shrimp paste from Chinese Jinzhou region. LWT 122, 108998. doi: 10.1016/j.lwt.2019.108998
Pan, F., Dong, B., Liu, T., Chen, Y., Chen, K. D., Huang, B. J., et al. (2020). Effect of Aspergillus niger NCUF413.1 on liquor yield and flavor components of Special-flavor Baijiu. Food Ferment. Ind. 46, 23–29. doi: 10.13995/j.cnki.11-1802/ts.020975
Sheng, Y. C., Tang, F., Wang, J., Zhang, S. Y., Feng, W. W., Ao, H., et al. (2020). Comparative analysis of volatile oil from different pericarpium citri reticulatae. Mod. Tradit. Chin. Med. Mater. Mater. World Sci. Technol. 22, 1199–1206.
Tao, H. J. (1955). Collective Commentaries on the Classic of Materia Medica. Shanghai: Group Press. 360–362.
Tian, J., Zhu, Z., Wu, B., Wang, L., and Liu, X. (2013). Bacterial and fungal communities in Pu'er tea samples of different ages. J. Food Sci. 78, 1249–1256. doi: 10.1111/1750-3841.12218
Tringe, S. G., Mering, C. V., Kobayashi, A., Salamov, A. A., Chen, K., Chang, H. W., et al. (2005). Comparative metagenomics of microbial communities. Science 308, 554–557. doi: 10.1126/science.1107851
Wang, F., Zhang, X., Lu, J. Y., Mei, G. R., Chen, H. P., Chen, L., et al. (2015). Study of reason of “the older, the better” of Pericarpium Citri Reticulatae (PCR) which contributed increase of flavonoids. China J. Chin. Mater. Med. 40, 4890–4896. doi: 10.4268/cjcmm20152428
Wang, J. J., Xu, Z. C., Fan, J. L., Wang, Y., and Chen, Y. T. (2015a). Effects of X-ray irradiation on the microbial growth and quality of flue-cured tobacco during aging. Radiat. Phys. Chem. 111, 9–13. doi: 10.1016/j.radphyschem.2015.02.005
Wang, S. H., Lian, Z. S., Wang, L. Y., Yang, X., and Liu, Y. (2015b). Preliminary investigations on a polygalacturonase from Aspergillus fumigatus in Chinese Pu'er tea fermentation. Bioresour. Bioproces. 2, 33–45. doi: 10.1186/s40643-015-0061-9
Wang, X. Y., Zhu, X. G., Bi, Y. L., Zhao, R. Y., Nie, Y. Y., and Yuan, W. (2020). Dynamics of microbial community and changes of metabolites during production of type I sourdough steamed bread made by retarded sponge-dough method. Food Chem. 330, 127316. doi: 10.1016/j.foodchem.2020.127316
Wang, Z. L., Wu, Q. F., Liu, S. J., Zhang, X., Chen, L., Chen, H. P., et al. (2018). Variation of volatile components in citri reticulatae pericarpium after attack of insects by gc-ms combined with amdis and kováts retention index. China J. Tradit. Chin. Med. Pharm. 33, 3327–3331.
Wang, Z. L., Zhang, X., Liu, S. J., Chen, H. P., and Liu, Y. P. (2017). Historical Evolution and Research Status of Citri Reticulatae Pericarpium. Chin. Arch. Tradit. Chin. Med. 35, 2580–2584. doi: 10.13193/j.issn.1673-7717.2017.10.031
Xue, Z. J., Guo, L. X., Guo, M., Yang, G. Y., Zhang, D., Guo, L., et al. (2019). Study on difference of chemical constituents of Qiai in different harvest periods. China J. Chin. Mater. Med. 44, 5433. doi: 10.19540/j.cnki.cjcmm.20190830.202
Yang, F. L., Deng, F. M., Zhao, L. Y., and Xia, Y. S. (2006). Development of black tea microbiology. J. Microbiol. 26, 81–84. doi: 10.1099/ijs.0.63826-0
Yang, F. Q., He, L. Y., Yang, D., Shen, M. Y., Chen, H. P., and Liu, Y. P. (2021a). Analysis and Identification of Flavonoids in Citri Reticulatae Pericarpium with Different Aging Time by UPLC Q-Orbitrap HRMS. Chin. J. Exp. Tradit. Med. Formulae 27, 125–132.
Yang, F. Q., Yang, D., Liu, S. J., Xu, S. M., Wang, F., Chen, H. P, et al. (2021b). Use of High Throughput Sequencing to Identify Fungal Communities on the Surface of Citri Reticulatae Pericarpium During the 3-Year Aging Process. Curr. Microbiol. 78, 3142–3151. doi: 10.1007/s00284-021-02575-w
Yi, C. P., Zhu, H., Yang, R. H., Bao, J. S., He, H. L., and Niu, M. (2019). Links between microbial compositions and volatile profiles of rice noodle fermentation liquid evaluated by 16S rRNA sequencing and GC-MS. LWT 118, 108774. doi: 10.1016/j.lwt.2019.108774
Zhang, X., He, Y., Liu, S. J., Wang, Z. L., Wang, F., Chen, L., et al. (2017a). The reason of “the older, the better” of Citri Reticulatae Pericarpium. Food Sci. Technol. 42, 90–95. doi: 10.13684/j.cnki.spkj.2017.01.021
Zhang, X., Liu, S. J., Wang, Z. L., Wang, F., Chen, L., Chen, H. P., et al. (2017b). Community structure analysis of fungi isolated from citrus surfaces. Microbiol. China 44, 1089–1098. doi: 10.13344/j.microbiol.china.160457
Keywords: Pericarpium Citri Reticulatae, aging, environmental factors, population structure of coexisting microorganisms, volatile components
Citation: Yang F, He L, Shen M, Wang F, Chen H and Liu Y (2022) A Correlation Between Pericarpium Citri Reticulatae Volatile Components and the Change of the Coexisting Microbial Population Structure Caused by Environmental Factors During Aging. Front. Microbiol. 13:930845. doi: 10.3389/fmicb.2022.930845
Received: 28 April 2022; Accepted: 13 June 2022;
Published: 22 July 2022.
Edited by:
Hui Ni, Jimei University, ChinaReviewed by:
Masaaki Konishi, Kitami Institute of Technology, JapanNoppon Lertwattanasakul, Kasetsart University, Thailand
Copyright © 2022 Yang, He, Shen, Wang, Chen and Liu. This is an open-access article distributed under the terms of the Creative Commons Attribution License (CC BY). The use, distribution or reproduction in other forums is permitted, provided the original author(s) and the copyright owner(s) are credited and that the original publication in this journal is cited, in accordance with accepted academic practice. No use, distribution or reproduction is permitted which does not comply with these terms.
*Correspondence: Hongping Chen, 397373340@qq.com; Youping Liu, youpingliu@cdutcm.edu.cn