
Rhodophyta DNA Barcoding: Ribulose-1, 5-Bisphosphate Carboxylase Gene and Novel Universal Primers


1
Department of Biochemistry and Microbiology, University of Fort Hare, Alice 5700, South Africa
2
Department of Zoology & Entomology, Rhodes University, Makhanda 6139, South Africa
*
Author to whom correspondence should be addressed.
Int. J. Mol. Sci. 2024, 25(1), 58; https://doi.org/10.3390/ijms25010058
Submission received: 19 October 2023
/
Revised: 12 December 2023
/
Accepted: 13 December 2023
/
Published: 19 December 2023
(This article belongs to the Section Molecular Biology)
Abstract
:Red algae (Rhodophyta) are a heterogeneous group of marine algal species that have served as a source of high-value molecules, including antioxidants and scaffolds, for novel drug development. However, it is challenging to identify Rhodophytes through morphological features alone, and in most instances, that has been the prevailing approach to identification. Consequently, this study undertook the identification of red algae species in Kenton-on-Sea, South Africa, as a baseline for future research on red algae biodiversity and conservation. The identification was achieved by designing, analysing, and using a set of universal primers through DNA barcoding of the rbcL gene. The PCR products of the rbcL gene were sequenced, and 96% of the amplicons were successfully sequenced from this set and matched with sequences on BOLD, which led to these species being molecularly described. Amongst these species are medicinally essential species, such as Laurencia natalensis and Hypnea spinella, and potential cryptic species. This calls for further investigation into the biodiversity of the studied region. Meanwhile, the availability of these primers will ease the identification process of red algae species from other coastal regions.
1. Introduction
Red algae, also known as Rhodophyta, are diverse groups of organisms of various species and are mostly found in oceans worldwide [1,2]. They possess large amounts of bioactive compounds with great medicinal value and have received considerable attention in recent years as antioxidants [3,4]. The South African coastline exhibits a diverse array of endemic red algae, possibly due to the unique environment created by the mixing of warm and cold waters [5]. As the decline in biodiversity is one of the most critical challenges of the 21st century, caused by the lack of knowledge on the state and distribution of biodiversity, it is crucial for the biodiversity of such commercially important species to be conserved [6].
Taxonomy provides an understanding of biodiversity that is a prerequisite for most biological research. However, traditional taxonomic methods that rely on morphological features alone are said to have contributed to the challenge at hand, especially in seaweeds [6,7]. This is due to cryptic or juvenile species having similar appearances that which make it difficult to differentiate between them [7]. Such species can only be detected with the use of molecular techniques [1,2].
One of the molecular methods that have been created to identify species like red algae with complex morphologies that make identification difficult is DNA barcoding. This was primarily introduced to increase the rate at which species are identified in response to the rate of biodiversity extinction [1,8]. This molecular technique involves sequencing a short barcode/gene to discriminate between species [9,10,11].
The plastid gene of the large subunit of ribulose-1, 5-bisphosphate carboxylase (rbcL) has been extensively used in barcoding studies and has been considered a promising barcode marker in red algae [1,12,13,14,15]. This is because, in contrast to plant mitochondrial and nuclear genes, the chloroplast genome has a basic, stable genetic structure and a low pace of evolution [16,17]. This enables sequencing and amplification even in degraded DNA [18].
Various primers have been designed for the rbcL gene; however, none of them are universal as there is no evidence of them amplifying red algae from different genera [14,19,20,21]. Therefore, there is a need for the development of universal primers for assessing red algal diversity at a rapid rate.
This study aimed to develop universal primers for the DNA barcoding of the rbcL gene to identify diverse red algae species from Kenton-on-Sea, South Africa.
2. Results
The newly designed universal primer set had sequence lengths between 18 and 24 base pairs for amplification of the rbcL gene in red algae (Table 1). The melting temperatures were 56 °C and 52 °C, and the GC contents were 40.0% and 44.4% for the forward and reverse primers, respectively. These parameters allowed for the annealing temperature of the primers to be determined, which was ~50 °C.
The study sequenced 26 red algae species, identified from Megablast [22] and the Barcode of Life Data System (BOLD) [23,24], with the use of the rbcL DNA barcode (Table 2; Figure 1). High similarities (>91% and up to 100%) with the species from MegaBlast and BOLD indicate high confidence in the identification of each specimen (Table 2).
Both phylogenetic tree construction methods produced congruent topologies, with the Bayesian Inference producing a better-resolved tree (Figure 2). The orders of the class Florideophyceae were monophyletic, as were the families, with one exception. The family Caulacanthaceae nested within Areschougiaceae, though this family was represented by only one sequence (7_Heringia mirabilis). Perhaps it was a misidentified species, or this family needs more attention from a taxonomic standpoint. The rbcL gene appears to be useful for delineating the species, though it appears that this is better achieved by using Bayesian Inference, rather than maximum likelihood algorithms. The deeper nodes between orders were not resolved and they formed a polytomy, though this is expected when using a faster-mutating organellar genomic gene. to construct phylogenetic trees.
Pairwise sequence divergences between orders ranged between 11.14% and 17.7%, intraorder/interfamily divergences values ranged between 11.9 and 17.7%, and intrafamily/intergeneric divergence was ~11% (Table 3). The family Caulacanthaceae, which nested within Areschougiaceae in the phylogeny, was 8.67% divergent from Areschougiaceae. The intrageneric sequence divergence values ranged between 4.2% and 9.2% (Table 4). The difference between the maximum intraspecific distance (6–6.5%) and the minimum interspecific distance (9–9.5%) (Figure 3) depicts the barcoding gap of this gene, which is 3%. This result validates the rbcL gene’s potential as a DNA barcode for red algae.
3. Discussion
3.1. Primer Design and Property Analysis
These primers (Table 1) were designed with careful adherence to acceptable primer properties in order to avoid poor amplification, sequencing issues, and mononucleotide repeats [25]. As a result, their sizes range from 18 to 24 bp because the primer length affects specificity and annealing [26]. The primers’ melting temperatures were set to between 52 and 60 °C to ensure efficient amplification; however, the G/C contents of these primers were slightly below the recommended range of 45% to 55%, which carries the disadvantage of a low melting temperature [26,27].
3.2. Red Algae Identification Based on Ribulose-1, 5-bisphosphate Carboxylase
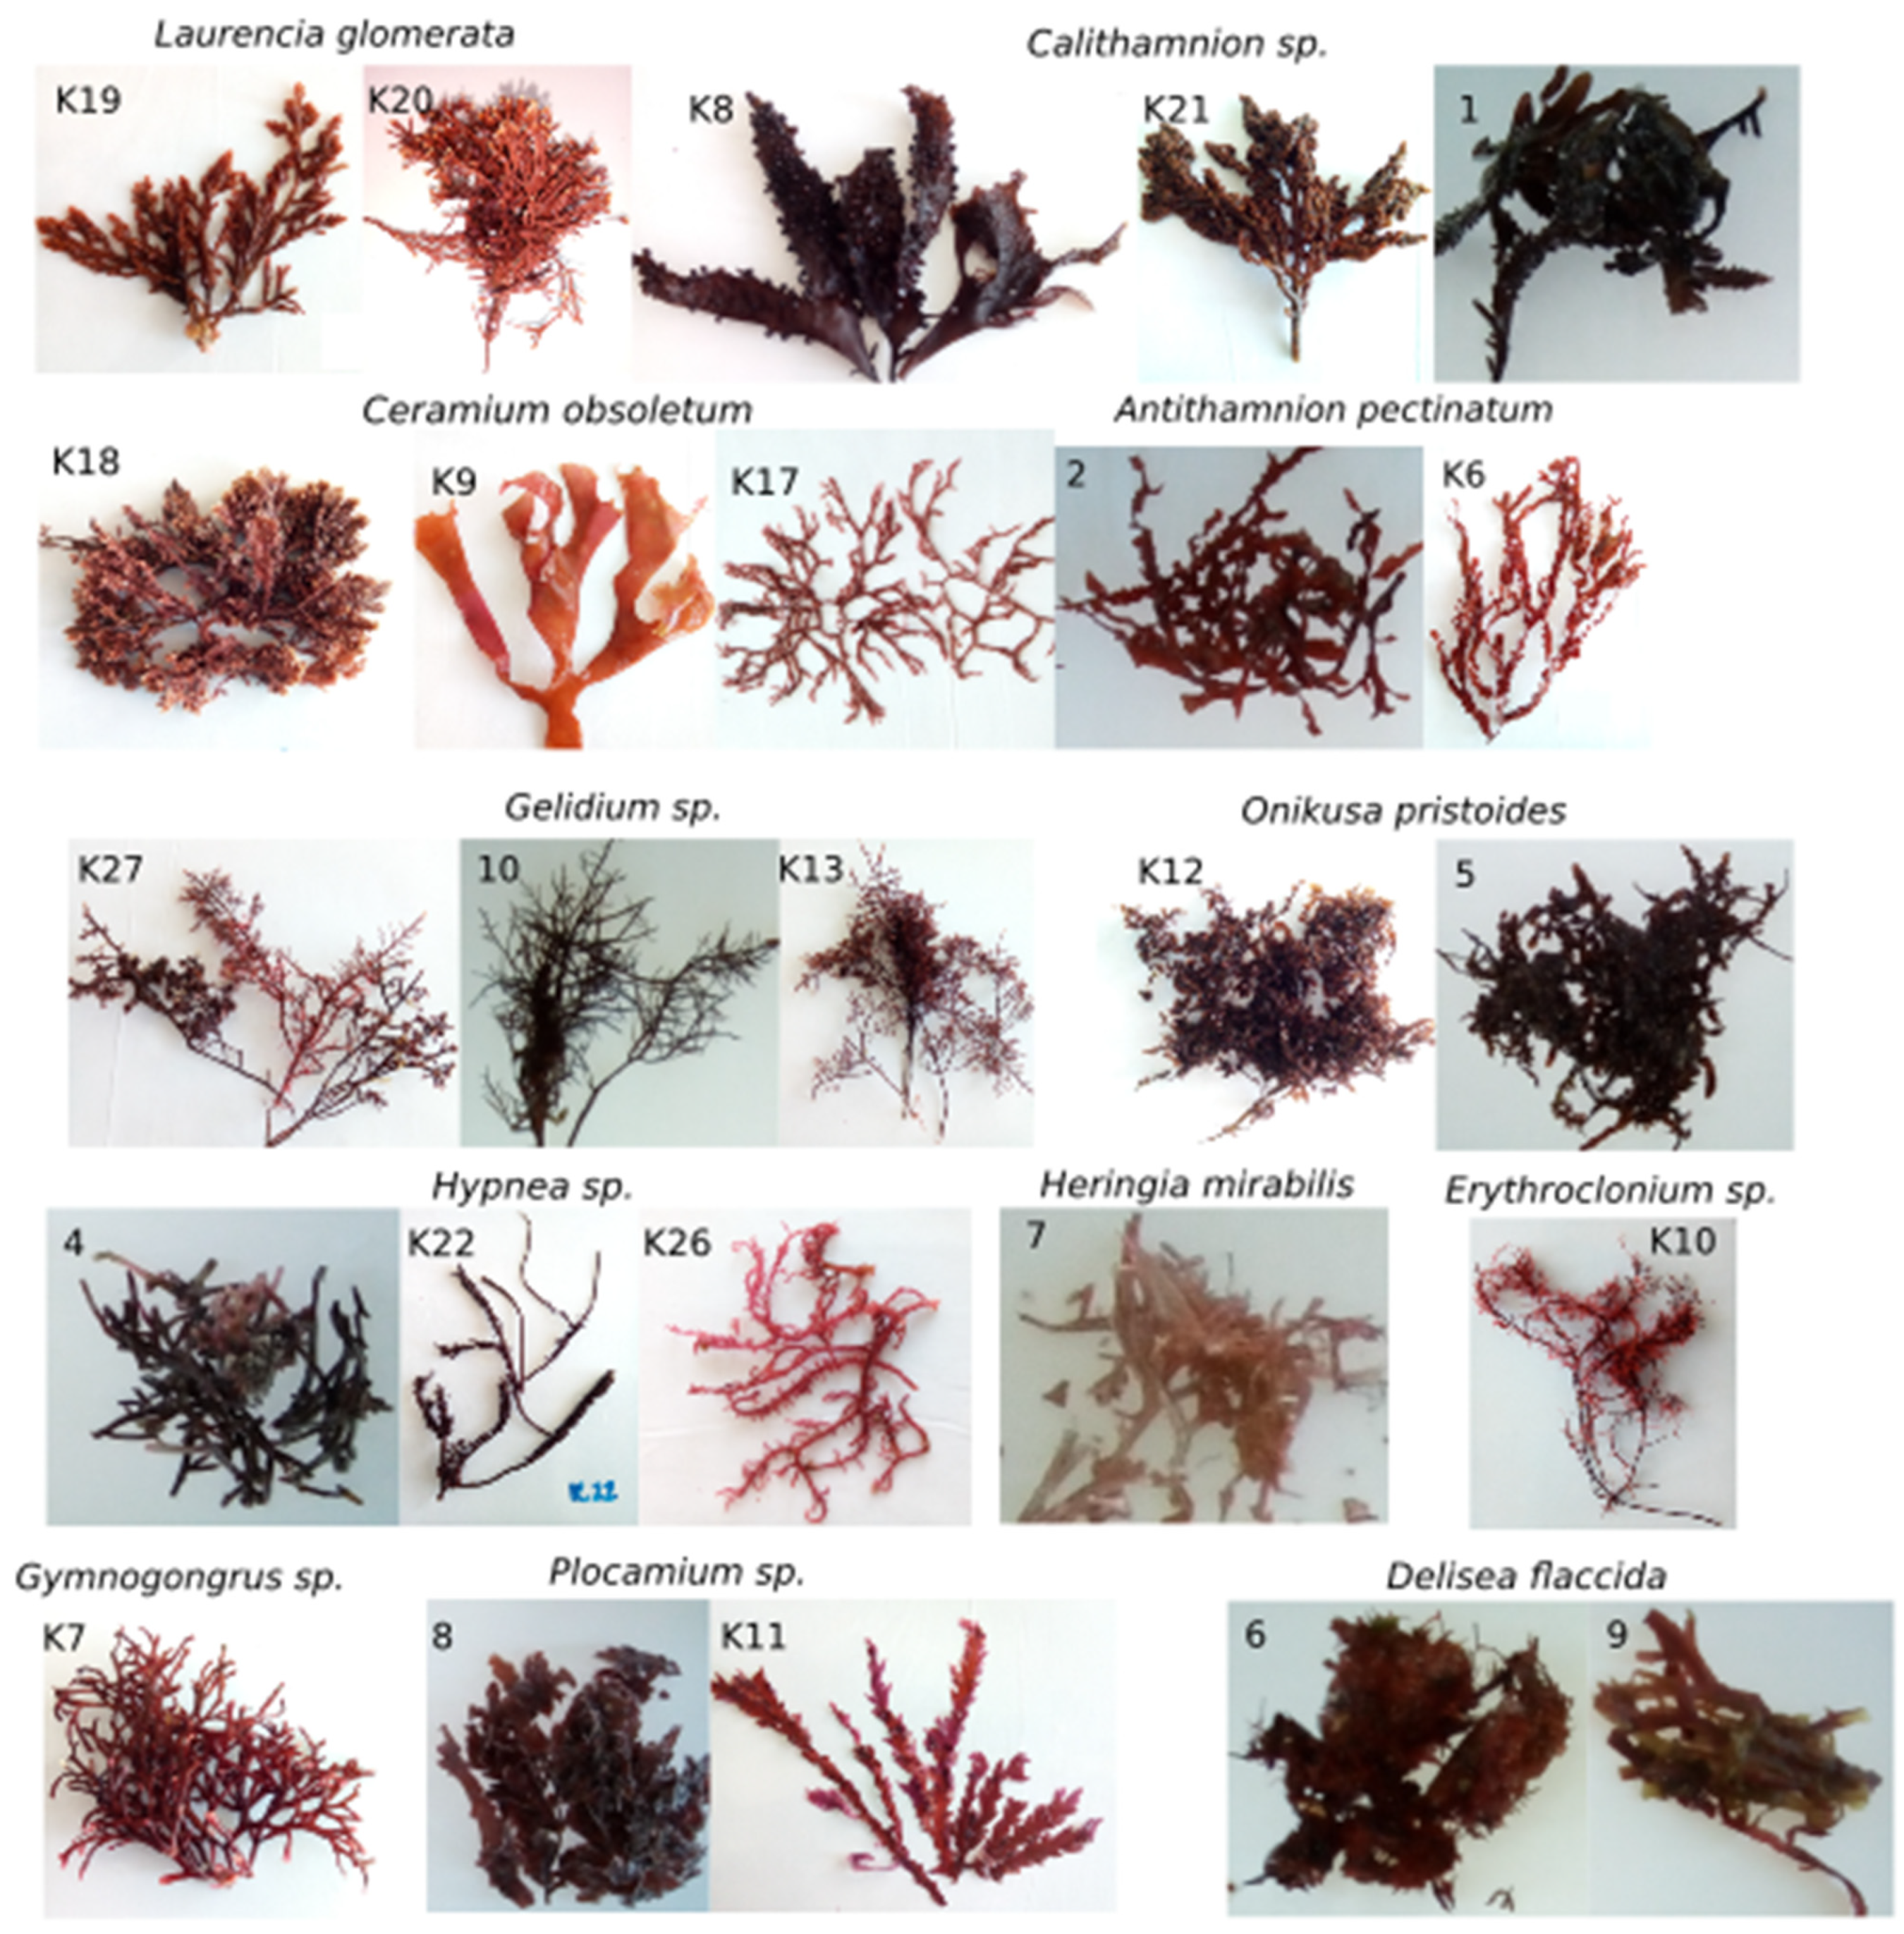
Various species from different genera were identified from the rbcL gene, as shown in Table 2. Some species were found to have the same genetic makeup even though they had different morphological features; these were Samples 2 and K6 (Table 2 and Figure 1), which were both found to be Antithamnion pectinatu. This was also observed with samples 6 and 9 (Delisea flaccida); samples 4 and K22 (Hypnea spinella); samples 10, K13, and K27 (Gelidium abbortiorum);samples K9, K17, and K18 (Ceramium obsoletum); and samplesK19 and K20 (Laurencia glomerata). This phenomenon is called convergent morphology, which means that these species may differ in their phenotypical features because they are in different developmental stages. These developmental stages from juvenile to adult are influenced by different environmental factors such as temperature, nutrients, and light. Therefore, juveniles and adults do not always look alike but their nucleotide composition can be identical [28,29,30].
Identification went as far as the interspecific level (Table 3, Figure 1). The primers also allowed the identification of species within the same genera (intrageneric). However, samples K7, K8, and 8 were only resolved at the genus level, suggesting new or cryptic species. Therefore, further stringent taxonomic analyses would have to be conducted in order to name these “cryptic species”, as discovery through non-extensive DNA barcoding is controversial in nomenclature [31,32]. Additionally, the primer design process in this study showed the possibility of the rbcL gene not distinguishing between species thoroughly in different genera, leaving room for improvement.
The rbcL gene’s species-level discrimination ability is shown in Table 2 and Figure 2; however, as mentioned above, some species were only distinguished up to the genus level. The Bayesian Inference allowed for better resolution between clades closer to the tips but, due to the fast mutation rate of the rbcL gene, the deeper relationships (interorder relationships) were not well resolved. The genetic divergence of the rbcL gene is also said to account for the lack of precision in species-level identification [33]. However, in this study, pairwise distances for DNA barcoding analysis and a barcoding gap of 3% were calculated using the difference between the maximum intraspecific distance and the minimum interspecific distance, which was higher than the maximum intraspecies distance (Table 3 and Table 4). Figure 3 shows that there is no overlap in the range of intra-and interspecific rbcL sequence divergence; the existence of this apparent gap between these variations and the sizeable interspecific distance are properties that strengthen a marker as an ideal barcode region for its species discrimination ability. Therefore, the discrimination power of the rbcL barcode is considered valid; hence, correct species identification was enabled [34].
4. Materials and Methods
4.1. rbcL Sequence Alignment
Red algae rbcL sequences, Ahnfeltiopsis glomerata (AF388552), Palisada perforata (EU256330), Ceramium pacificum (FJ795539), and Betaphycus gelatinus (JX069190), from the Rhodophyta classes were obtained from GenBank (https://www.ncbi.nlm.nih.gov/ (accessed on 17 January 2017); [35]). A global alignment was performed on all the sequences using MEGA v6.0 [36]. This was performed by ClustalW where the pairwise alignment gap opening penalty was 15, and the gap extension penalty was 6.6. The same values applied to the multiple alignment gap opening penalty and the gap extension penalty. The DNA matrix used was ClustalW 1.6 with a transition weight of 0.5. The delay divergence cut-off percentage was 30. The alignments were inspected by eye for variable and conserved regions for designing primers.
4.2. Universal Primer Design for Amplification of the Red Algae rbcL Gene
Universal primers, RFrbcLf1 and RFrbcLr2, designed from the sequence alignment were highly conserved to ensure that they would bind to as many red algae species as possible from these classes. The regions between the primer sets showed enough variability to ensure that the DNA barcode being developed was able to differentiate between different species of the Rhodophyta species. According to Kress and Erickson (2008), for a gene region to be considered a potential DNA barcode, it must contain significant species-level genetic variability and divergence. The analysis of the above sequence alignment showed that the rbcL primers met this criterion. The length of the amplified region was 977 bp in a conserved region with both the forward primer and the reverse primer. The reverse primer started at the beginning in the 5′-3′ direction at ATG to AAC. The reverse primer started from TTG to GTG in the 5′-3′ direction and a reverse complement was made.
Primer length was 18–20 base pairs, GC content was 40–60%, and G or C residues were added at the 3′ end. GC contents and melting temperatures were determined manually and confirmed using Gene Runner version 4.0.9.4 Beta [36].
4.3. rbcL Primer Universality Assessment for Barcoding Red Algae
The rbcL primers were assessed for universality using Megablast in GenBank for highly similar sequences (http://www.ncbi.nlm.nih.gov/BLAST (accessed on 11 February 2017); [22]). The several red algal families that emerged from this search for each primer are listed in Table S1. The percentages of families and orders from this search are shown in Figures S1 and S2, respectively. Table S1 shows the sequences of the various primer pairs designed and Figures S1 and S2 show that RFrbcLf1 and RFrbcLr2 was the best primer pair compared to the other primer sets.
4.4. Sample Collection
A total number of 31 red algae samples, about 50 mg each (of which 5 mg per species was used for the study) was collected in South Africa (33.6806° S, 26.6701° E) in 2016 and 2017 during low tide. They were rinsed with distilled water and stored at −80 °C.
4.5. Amplification and Sequencing of Red Algae Ribulose-1, 5-bisphosphate Carboxylase (rbcL) Gene
Genomic DNA from these specimens was isolated using the ZR Plant/Seed DNA MiniPrep Kit (Zymo Research Corporation, Irvine, CA, USA) and concentrations were measured using Nanodrop 2000 (Thermo Fisher Scientific Corporation, Waltham, MA, USA). A segment of 977 bp of the rbcL gene was amplified using PCR from the genomic DNA with RFrbcLf1 (5′GTCTAACTCTGTAGAAGAAC 3′) and RFrbcLr2 (5′GTCTAACTCTGTAGAAGAAC 3′) (Inqaba Biotechnica Industries (Pty), Muckleneuk, South Africa). PCR reactions were performed in 30 µL reactions for each sample. Each PCR tube contained 12.5 µL of the Promega Go Taq® Green master mix (Promega Coporation, Madison, WI, USA), 2.5 µL of the forward primer (10 µM), 2.5 µL of the reverse primer (10 µM), 5 µL of the template DNA, and 7.5 µL of nuclease-free water. The reactions were carried out using the Bio-Rad My Cycler® Thermal cycler (Bio-Rad Laboratories, Hercules, CA, USA). PCR reactions were performed with 1 cycle of 95 °C (initial denaturation) for 3 min; 40 cycles of 95 °C (denaturation) for 1 min; 50 °C (annealing temperature) for 30 s, 72 °C (extension) for 1 min, and 1 cycle of 72 °C (final extension) for 5 min.
Amplicons were sequenced with the PCR primers, analysed on a 3500 Genetic Analyzer (Thermo Fisher Scientific Corporation, Waltham, MA, USA), and assessed on Chromas 2.6.4 (Technelysium Pty Ltd., South Brisbane, Australia).
4.6. Species Identification Using DNA Barcoding and Phylogenetic Analyses
The sequences were used to identify species in Megablast on NCBI [37] and BOLD. The species name with the highest percentage of similarity from one of the search engines was used for the results. Two phylogenetic trees from 750 bp of the aligned sequences were constructed. The first was produced using the MEGA (Molecular Evolutionary Genetics Analysis) maximum likelihood algorithm, with the GTR (discrete gamma categories with invariant sites) evolutionary model chosen using AIC (Akaike information criterion). Branch supports were estimated using 1000 bootstrap replications, and 6 G + I categories were selected. The ML heuristic method was “Nearest-Neighbor-Interchange”, with a strong branch filter and one thread for system resource usage. The second phylogenetic tree was constructed using Bayesian Inference in MrBayes v.3.2.7 [38]. Priors in MrBayes were set according to the evolutionary model found using MEGA (GTR + Γ + I), and uniform priors were kept for all other parameters. The MCMC was run with two parallel runs for 10 million generations, with trees sampled every 1000 generations. The effective sample sizes (ESS) of all parameters, viewed in Tracer v.1.6.0 [39], were >200, so the number of generations to discard as burn-in was around 20%. A 50% majority rule tree was constructed, excluding the burn-in, using the ‘sumt’ command in MrBayes, and nodes with ≥0.95 posterior probability were considered supported. These two phylogenetic trees were used instead of Neighbour joining (NJ) because NJ is a clustering algorithm and models of substitution cannot be applied to the algorithm. It is more often that we find ML and Bayesian Inference presented in the modern literature [40].
4.7. Pairwise Genetic Distance Analysis
Sequence divergences were determined by estimating the uncorrected p-distances between and within species using MEGA, and the averages of interspecific and intraspecific distances were calculated in Species Identifier [41].
5. Conclusions
Universal primers for the rbcL gene and the DNA barcoding for a variety of red algae species in South Africa were designed and they were tested on species from Kenton-on- Sea to assess biodiversity. In total, 96% of those species were successfully sequenced and identified. Some of these species include those rich in polysaccharides, antioxidants, and cytotoxic compounds, like Hypnea spinella, Plocamium corallorhiza, Delisea flaccida, and Gelidium pristoides [42,43,44]. Potential cryptic species were identified, and this calls for further investigation of the biodiversity in that geographical area. Meanwhile, the availability of these primers will ease the identification process of red algae species from other coastal regions, and the sequences and identified species can be phylogenetically analysed. Ultimately, they can be uploaded to biological databases such as BOLD and GenBank.
Supplementary Materials
The following supporting information can be downloaded at: https://www.mdpi.com/1422-0067/25/1/58/s1.
Author Contributions
Conceptualization, G.B. and F.M.M.; methodology, F.M.M. and S.E.; software, F.M.M. and S.E.; validation, F.M.M., S.E. and G.B.; formal analysis, F.M.M. and S.E.; investigation, F.M.M.; resources, G.B.; data curation, F.M.M. and S.E.; writing—original draft preparation, F.M.M.; writing—review and editing, F.M.M., S.E. and G.B.; visualization, F.M.M. and S.E.; supervision, G.B.; project administration, G.B.; funding acquisition, G.B. All authors have read and agreed to the published version of the manuscript.
Funding
This research was funded by the DSI/NRF-SAIAB/UFH Joint Marine Laboratory Programme, the NRF ACEP Phuhlisa Programme and the NRF Freestanding, Innovation and Scarce Skills Development Masters and Doctoral Scholarship (SFH160719179712).
Institutional Review Board Statement
Not applicable.
Informed Consent Statement
Not applicable.
Data Availability Statement
The data presented in this study are openly available in GenBank (www.ncbi.nlm.nih.gov) (See Table 2 for accession numbers).
Acknowledgments
We acknowledge the assistance of the NRF ACEP Phuhlisa Programme, and the DSI/NRF-SAIAB/UFH Joint Marine Laboratory Programme for funding this project. We are grateful to Rose Palmer for helping with sampling and red algae identification. We would also like to thank Taryn Bodill for assisting with cycle sequencing, and lastly, we are grateful to Uchechukwu Nwodo for assisting with editing and publishing this manuscript.
Conflicts of Interest
The authors declare no conflic of interest.
References
- Robba, L.; Russell, S.J.; Barker, G.L.; Brodie, J. Assessing the use of the mitochondrial cox1 marker for use in DNA barcoding of red algae (Rhodophyta). Am. J. Bot. 2006, 93, 1101–1108. [Google Scholar] [CrossRef] [PubMed]
- Kowalska, Z.; Pniewski, F.; Latała, A. DNA barcoding–A new device in phycologist’s toolbox. Ecol. Hydrobiol. 2019, 19, 417–427. [Google Scholar] [CrossRef]
- Sithranga Boopathy, N.; Kathiresan, K.J.J.O. Anticancer drugs from marine flora: An overview. J. Oncol. 2010, 2010, 214186. [Google Scholar] [CrossRef] [PubMed]
- Neethu, P.V.; Suthindhiran, K.; Jayasri, M.A. Antioxidant and antiproliferative activity of Asparagopsis taxiformis. Pharmacogn. Res. 2017, 9, 238–246. [Google Scholar]
- Knott, M.G. Isolation, structural Characterisation & Evaluation of Cytotoxic Activity of Natural Products From selected South African Marine Red Algae. Ph.D. Thesis, Rhodes University, Grahamstown, South Africa, 2012. South East Academic Libraries System (SEALS). Available online: http://hdl.handle.net/10962/d1015460 (accessed on 19 May 2019).
- Thomsen, P.F.; Willerslev, E. Environmental DNA–An emerging tool in conservation for monitoring past and present biodiversity. Biol. Conserv. 2015, 183, 4–18. [Google Scholar] [CrossRef]
- Wijayawardene, N.N.; Bahram, M.; Sánchez-Castro, I.; Dai, D.Q.; Ariyawansa, K.G.; Jayalal, U.; Suwannarach, N.; Tedersoo, L. Current insight into culture-dependent and culture-independent methods in discovering Ascomycetous Taxa. J. Fungi 2021, 7, 703. [Google Scholar] [CrossRef] [PubMed]
- Hebert, P.D.; Ratnasingham, S.; De Waard, J.R. Barcoding animal life: Cytochrome c oxidase subunit 1 divergences among closely related species. J. Biol. Sci. 2003, 270, 96–99. [Google Scholar] [CrossRef] [PubMed]
- García-Morales, A.E.; Elías-Gutiérrez, M. DNA barcoding of freshwater Rotifera in Mexico: Evidence of cryptic speciation in common rotifers. Mol. Ecol. Resour. 2013, 13, 1097–1107. [Google Scholar] [CrossRef]
- Trivedi, S.; Aloufi, A.A.; Ansari, A.A.; Ghosh, S.K. Role of DNA barcoding in marine biodiversity assessment and conservation: An update. Saudi J. Biol. Sci. 2016, 23, 161–171. [Google Scholar] [CrossRef]
- Saddhe, A.A.; Kumar, K. DNA barcoding of plants: Selection of core markers for taxonomic groups. Plant Sci. Today 2018, 5, 9–13. [Google Scholar] [CrossRef]
- Saunders, G.W. Applying DNA barcoding to red macroalgae: A preliminary appraisal holds promise for future applications. J. Biol. Sci. 2005, 360, 1879–1888. [Google Scholar] [CrossRef] [PubMed]
- Saunders, G.W. A DNA barcode examination of the red algal family Dumontiaceae in Canadian waters reveals substantial cryptic species diversity. 1. The foliose Dilsea-Neodilsea complex and Weeksia. J. Bot. 2008, 86, 773–789. [Google Scholar] [CrossRef]
- Saunders, G.W.; Moore, T.E. Refinements for the amplification and sequencing of red algal DNA barcode and RedToL phylogenetic markers: A summary of current primers, profiles and strategies. Algae 2013, 28, 31–43. [Google Scholar] [CrossRef]
- Saunders, G.W.; Millar, K. A DNA barcode survey of the red algal genus Mazzaella in British Columbia reveals overlooked diversity and new distributional records: Descriptions of M. dewreedei sp. nov. and M. macrocarpa sp. nov. J. Bot. 2014, 92, 223–231. [Google Scholar] [CrossRef]
- Hasebe, M.; Omori, T.; Nakazawa, M.; Sano, T.; Kato, M.; Iwatsuki, K. rbcL gene sequences provide evidence for the evolutionary lineages of leptosporangiate ferns. Proc. Natl. Acad. Sci. USA 1994, 91, 5730–5734. [Google Scholar] [CrossRef] [PubMed]
- Dong, W.; Liu, J.; Yu, J.; Wang, L.; Zhou, S. Highly variable chloroplast markers for evaluating plant phylogeny at low taxonomic levels and for DNA barcoding. PLoS ONE. 2012, 7, e35071. [Google Scholar] [CrossRef] [PubMed]
- Kowalska, M.; Piekut, T.; Prendecki, M.; Sodel, A.; Kozubski, W.; Dorszewska, J. Mitochondrial and nuclear DNA oxidative damage in physiological and pathological aging. DNA Cell Biol. 2020, 39, 1410–1420. [Google Scholar] [CrossRef]
- Freshwater, D.W.; Rueness, J. Phylogenetic relationships of some European Gelidium (Gelidiales, Rhodophyta) species, based on rbcL nucleotide sequence analysis. Phycologia 1994, 33, 187–194. [Google Scholar] [CrossRef]
- Vis, M.L.; Sheath, R. A molecular investigation of the systematic relationships of Sirodotia species (Batrachospermales, Rhodophyta) in North America. Phycologia 1999, 38, 261–266. [Google Scholar] [CrossRef]
- Provan, J.; Murphy, S.; Maggs, C.A. Universal plastid primers for Chlorophyta and Rhodophyta. Eur. J. Phycol. 2004, 39, 43–50. [Google Scholar] [CrossRef]
- Altschul, S.F.; Gish, W.; Miller, W.; Myers, E.W.; Lipman, D.J. Basic local alignment search tool. J. Mol. Biol. 1990, 215, 403–410. [Google Scholar] [CrossRef] [PubMed]
- Ratnasingham, S.; Hebert, P.D. BOLD: The Barcode of Life Data System (http://www.barcodinglife.org). Mol. Eccol. Notes 2007, 7, 355–364. [Google Scholar] [CrossRef] [PubMed]
- Ratnasingham, S.; Hebert, P.D. BOLD the Barcode of Life Data System. 2007. Available online: https://www.boldsystems.org/index.php/IDS_OpenIdEngine (accessed on 12 November 2023).
- Jing, Y.U.; Jian-Hua, X.U.E.; Shi-Liang, Z. New universal matK primers for DNA barcoding angiosperms. J. Syst. Evol. 2011, 49, 176–181. [Google Scholar]
- Prezioso, V.R. General Notes on Primer Design in PCR. Encyclopedia 2006, 2, 022012–022037. [Google Scholar]
- Green, M.R.; Sambrook, J. Polymerase chain reaction. Cold Spring Harb. Protoc. 2019, 6, 436–456. [Google Scholar] [CrossRef] [PubMed]
- Augspurger, C.K.; Bartlett, E.A. Differences in leaf phenology between juvenile and adult trees in a temperate deciduous forest. Tree Physiol. 2003, 23, 517–525. [Google Scholar] [CrossRef] [PubMed]
- Hiruma, K.; Kaneko, Y. Hormonal regulation of insect metamorphosis with special reference to juvenile hormone biosynthesis. Curr. Top. Dev. Biol. 2013, 103, 73–100. [Google Scholar]
- Duran, C.; Appleby, N.; Clark, T.; Wood, D.; Imelfort, M.; Batley, J.; Edwards, D. AutoSNPdb: An annotated single nucleotide polymorphism database for crop plants. Nucleic Acids Res. 2008, 37, 951–953. [Google Scholar] [CrossRef]
- DeSalle, R.; Egan, M.G.; Siddall, M. The unholy trinity: Taxonomy, species delimitation and DNA barcoding. Phil. Trans. R. Soc. Lon. B Biol. Sci. 2005, 360, 1905–1916. [Google Scholar] [CrossRef]
- Li, Y.; Tong, Y.; Xing, F. DNA barcoding evaluation and its taxonomic implications in the recently evolved genus Oberonia Lindl. (Orchidaceae) in China. Front. Plant Sci. 2016, 7, 1791. [Google Scholar] [CrossRef]
- Dai, Q.Y.; Gao, Q.; Wu, C.S.; Chesters, D.; Zhu, C.D.; Zhang, A.B. Phylogenetic reconstruction and DNA barcoding for closely related pine moth species (Dendrolimus) in China with multiple gene markers. PLoS ONE 2012, 7, 32544. [Google Scholar] [CrossRef] [PubMed]
- Tahir, A.; Hussain, F.; Ahmed, N.; Ghorbani, A.; Jamil, A. Assessing universality of DNA barcoding in geographically isolated selected desert medicinal species of Fabaceae and Poaceae. PeerJ 2018, 6, 4499. [Google Scholar] [CrossRef] [PubMed]
- Benson, D.; Lipman, D.J.; Ostell, J. GenBank. Nucleic Acids Res. 1993, 21, 2963–2965. [Google Scholar] [CrossRef] [PubMed]
- Tamura, K.; Stecher, G.; Peterson, D.; Filipski, A.; Kumar, S. MEGA6: Molecular evolutionary genetics analysis version 6.0. Mol. Biol. Evol. 2013, 30, 2725–2729. [Google Scholar] [CrossRef] [PubMed]
- Buquicchio, F.; Spruyt, M. Gene Runner. 1992. Available online: http://www.generunner.net (accessed on 1 March 2017).
- Ronquist, F.; Teslenko, M.; van der Mark, P.; Ayres, D.L.; Darling, A.; Höhna, S.; Larget, B.; Liu, L.; Suchard, M.A.; Huelsenbeck, J.P. MRBAYES 3.2: Efficient Bayesian phylogenetic inference and model selection across a large model space. Syst. Biol. 2012, 61, 539–542. [Google Scholar] [CrossRef] [PubMed]
- Rambaut, A.; Drummond, A.J.; Xie, D.; Baele, G.; Suchard, M.A. Posterior summarisation in Bayesian phylogenetics using Tracer 1.7. Syst. Biol. 2018, 67, 901–904. [Google Scholar] [CrossRef] [PubMed]
- Available online: https://www.researchgate.net/post/Whats-the-difference-between-neighbor-joining-maximum-likelihood-maximum-parsimony-and-Bayesian-inference (accessed on 19 November 2023).
- Meier, R.; Shiyang, K.; Vaidya, G.; Ng, P.K. DNA barcoding and taxonomy in Diptera: A tale of high intraspecific variability and low identification success. Syst. Biol. 2006, 55, 715–728. [Google Scholar] [CrossRef] [PubMed]
- Knott, M.G.; Mkwananzi, H.; Arendse, C.E.; Hendricks, D.T.; Bolton, J.J.; Beukes, D.R. Plocoralides A–C, polyhalogenated monoterpenes from the marine alga Plocamium corallorhiza. Phyto. Chem. 2005, 66, 1108–1112. [Google Scholar]
- McCombs, J.D.; Blunt, J.W.; Chambers, M.V.; Munro, M.H.; Robinson, W.T. Novel 2 (5H)-furanones from the red marine alga Delisea elegans (Lamouroux). Tetrahedron 1998, 44, 1489–1502. [Google Scholar] [CrossRef]
- Kladi, M.; Vagias, C.; Roussis, V. Volatile halogenated metabolites from marine red algae. Phytochem. Rev. 2004, 3, 337–366. [Google Scholar] [CrossRef]
Figure 1.
Photographs of the specimens sequenced in this study. Specimen numbers as in Table 2.
Figure 1.
Photographs of the specimens sequenced in this study. Specimen numbers as in Table 2.

Figure 2.
Bayesian Inference (BI) phylogenetic tree produced from rbcL sequence data from Algoa Bay red algae and GenBank sequences detected by the primers from Class Florideophyceae. Key to the support values shown as squares at each node, with the inset key (ML bootstrap percentages above the node, BI posterior probabilities below the node). Species in bold are the ones that were collected for this study.

Figure 3.
Frequency distribution of intraspecific and interspecific (congeneric) genetic divergence in red algae.
Figure 3.
Frequency distribution of intraspecific and interspecific (congeneric) genetic divergence in red algae.


Table 1.
Designed forward (f) and reverse (r) primers for rbcL region in Rhodophyta (R): Class Florideophyceae (F) for DNA barcoding, primer sequence, primer length, melting temperature (Tm), and GC content are shown.
Table 1.
Designed forward (f) and reverse (r) primers for rbcL region in Rhodophyta (R): Class Florideophyceae (F) for DNA barcoding, primer sequence, primer length, melting temperature (Tm), and GC content are shown.
| Primer | Primer Sequence (5′-3′) | Primer Length (bp) | Tm (°C) | GC% |
|---|---|---|---|---|
| RFrbcLf1 | GTCTAACTCTGTAGAAGAAC | 20 | 56 | 40.0 |
| RFrbcLr2 | GCCCAATCTTGTTCAAAG | 18 | 52 | 44.4 |
Table 2.
DNA barcode-verified specimen identities of red algae from Kenton-on-Sea. The sequence IDs, similarity percentages, and the collection data are shown.
Table 2.
DNA barcode-verified specimen identities of red algae from Kenton-on-Sea. The sequence IDs, similarity percentages, and the collection data are shown.
| Sample ID | Barcode of Life Data (Top%Speciesid) | E-Value | Collection Data | |||
|---|---|---|---|---|---|---|
| Location | Geographic Coordinates | Date | Genbank Accession Numbers | |||
| 1 | Callithamnion corymbosum (93.50) | 0.0 | South Africa | 33.6806° S, 26.6701° E | 10 September 2016 | OR939833 |
| 2 | Antithamnion pectinatum (96.90) | 0.0 | South Africa | 33.6806° S, 26.6701° E | 10 September 2016 | OR939834 |
| 4 | Hypnea spinella (91.80) | 0.0 | South Africa | 33.6806° S, 26.6701° E | 10 September 2016 | OR939835 |
| 5 | Gelidium pristoides (95.10) | 0.0 | South Africa | 33.6806° S, 26.6701° E | 10 September 2016 | OR939836 |
| 6 | Delisea flaccida (100.00) | 0.0 | South Africa | 33.6806° S, 26.6701° E | 10 September 2016 | OR939837 |
| 7 | Erythroclonium angustatum (90.50) | 0.0 | South Africa | 33.6806° S, 26.6701° E | 10 September 2016 | OR939838 |
| 8 | Plocamium coleorhiza (99.70) | 0.0 | South Africa | 33.6806° S, 26.6701° E | 10 September 2016 | OR939839 |
| 9 | Delisea flaccida (99.90) | 0.0 | South Africa | 33.6806° S, 26.6701° E | 10 September 2016 | OR939840 |
| 10 | Gelidium amansii (100.00) | 0.0 | South Africa | 33.6806° S, 26.6701° E | 10 September 2016 | OR939841 |
| K6 | Antithamnion pectinatum (96.80) | 0.0 | South Africa | 33.6806° S, 26.6701° E | 24 November 2017 | OR939842 |
| K7 | Gymnogongrus sp. (92.30) | 0.0 | South Africa | 33.6806° S, 26.6701° E | 24 November 2017 | OR939843 |
| K8 | Callithamnion bailey (92.80) | 0.0 | South Africa | 33.6806° S, 26.6701° E | 24 November 2017 | OR939844 |
| K9 | Ceramium obsoletum (97.20) | 0.0 | South Africa | 33.6806° S, 26.6701° E | 24 November 2017 | OR939845 |
| K10 | Erythroclonium angustatum (91.50) | 0.0 | South Africa | 33.6806° S, 26.6701° E | 24 November 2017 | OR939846 |
| K11 | Plocamium coleorhiza (96.30) | 0.0 | South Africa | 33.6806° S, 26.6701° E | 24 November 2017 | OR939847 |
| K12 | Gelidium pristoides (99.70) | 0.0 | South Africa | 33.6806° S, 26.6701° E | 24 November 2017 | OR939848 |
| K13 | Gelidium amansii (100.00) | 0.0 | South Africa | 33.6806° S, 26.6701° E | 24 November 2017 | OR939849 |
| K17 | Ceramium obsoletum (98.40) | 0.0 | South Africa | 33.6806° S, 26.6701° E | 24 November 2017 | OR939850 |
| K18 | Ceramium obsoletum (96.70) | 0.0 | South Africa | 33.6806° S, 26.6701° E | 24 November 2017 | OR939851 |
| K19 | Laurencia glomerata (98.24) | 0.0 | South Africa | 33.6806° S, 26.6701° E | 24 November 2017 | OR939852 |
| K20 | Laurencia glomerata (99.686.20) | 0.0 | South Africa | 33.6806° S, 26.6701° E | 24 November 2017 | OR939853 |
| K21 | Callithamnion collabens (95.50) | 0.0 | South Africa | 33.6806° S, 26.6701° E | 24 November 2017 | OR939854 |
| K22 | Hypnea spinella (93.90) | 0.0 | South Africa | 33.6806° S, 26.6701° E | 24 November 2017 | OR939855 |
| K26 | Hypnea flexicaulis (97.60) | 0.0 | South Africa | 33.6806° S, 26.6701° E | 24 November 2017 | OR939856 |
| K27 | Gymnogongrus sp. (99.90) | 0.0 | South Africa | 33.6806° S, 26.6701° E | 24 November 2017 | OR939857 |
Table 3.
Sequence divergence values between genera of Rhodophyta (given as percentages).
| Order | Family | Genus | 1 | 2 | 3 | 4 | 5 | 6 | 7 | 8 | 9 | 10 | 11 | |
|---|---|---|---|---|---|---|---|---|---|---|---|---|---|---|
| 1 | Ceremiales | Rhodomeiaceae | Laurencia | |||||||||||
| 2 | Ceremiales | Callithamniaceae | Calithamnion | 14.72 | ||||||||||
| 3 | Ceremiales | Ceramiaceae | Ceramium | 13.52 | 12.46 | |||||||||
| 4 | Gelidiales | Ceramiaceae | Antithamnion | 13.32 | 12.48 | 11.14 | ||||||||
| 5 | Gigartinales | Gelidiaceae | Gelidium | 17.23 | 16.15 | 15.12 | 15.98 | |||||||
| 6 | Gigartinales | Hypneaceae | Hypnea | 17.95 | 16.60 | 16.42 | 16.49 | 16.65 | ||||||
| 7 | Gigartinales | Areschougiaceae | Erythroclonium | 17.16 | 16.15 | 15.93 | 16.14 | 17.63 | 11.94 | |||||
| 8 | Gigartinales | Caulacanthaceae | Heringia | 17.36 | 15.68 | 15.74 | 16.66 | 17.16 | 12.64 | 8.67 | ||||
| 9 | Gigartinales | Phyllophoraceae | Gymnogongrus | 17.44 | 15.66 | 16.09 | 15.98 | 17.68 | 14.41 | 13.26 | 14.35 | |||
| 10 | Plocamiales | Plocamiaceae | Plocamium | 17.71 | 15.88 | 14.50 | 15.46 | 16.97 | 15.87 | 15.08 | 14.18 | 15.23 | ||
| 11 | Bonnemaisoniales | Bonnemaisoniaceae | Delisea | 15.55 | 15.43 | 14.41 | 14.13 | 16.77 | 15.60 | 15.70 | 15.73 | 14.30 | 12.54 | |
| 12 | Outgroup | 20.75 | 19.47 | 19.14 | 19.64 | 20.47 | 19.55 | 19.46 | 19.17 | 20.00 | 19.77 | 19.40 |
Table 4.
Intrageneric sequence divergence within genera of Rhodophyta (given as percentages) and the standard error of the mean are shown.
Table 4.
Intrageneric sequence divergence within genera of Rhodophyta (given as percentages) and the standard error of the mean are shown.
| %Distance | SE | |
|---|---|---|
| Calithamnion | 8.67 | 0.62 |
| Antithamnion | 4.86 | 0.55 |
| Gelidium | 5.90 | 0.50 |
| Heringia | 9.05 | 1.05 |
| Delisea | 3.74 | 0.44 |
| Ceramium | 7.72 | 0.62 |
| Plocamium | 5.15 | 0.51 |
| Erythroclonium | 8.29 | 0.81 |
| Laurencia | 4.27 | 0.43 |
| Hypnea | 7.32 | 0.56 |
| Gymnogongrus | 9.20 | 0.71 |
| Outgroup | 10.11 | 0.74 |
Disclaimer/Publisher’s Note: The statements, opinions and data contained in all publications are solely those of the individual author(s) and contributor(s) and not of MDPI and/or the editor(s). MDPI and/or the editor(s) disclaim responsibility for any injury to people or property resulting from any ideas, methods, instructions or products referred to in the content. |
© 2023 by the authors. Licensee MDPI, Basel, Switzerland. This article is an open access article distributed under the terms and conditions of the Creative Commons Attribution (CC BY) license (https://creativecommons.org/licenses/by/4.0/).
Share and Cite
MDPI and ACS Style
Mshiywa, F.M.; Edwards, S.; Bradley, G. Rhodophyta DNA Barcoding: Ribulose-1, 5-Bisphosphate Carboxylase Gene and Novel Universal Primers. Int. J. Mol. Sci. 2024, 25, 58. https://doi.org/10.3390/ijms25010058
AMA Style
Mshiywa FM, Edwards S, Bradley G. Rhodophyta DNA Barcoding: Ribulose-1, 5-Bisphosphate Carboxylase Gene and Novel Universal Primers. International Journal of Molecular Sciences. 2024; 25(1):58. https://doi.org/10.3390/ijms25010058
Chicago/Turabian StyleMshiywa, Faith Masilive, Shelley Edwards, and Graeme Bradley. 2024. "Rhodophyta DNA Barcoding: Ribulose-1, 5-Bisphosphate Carboxylase Gene and Novel Universal Primers" International Journal of Molecular Sciences 25, no. 1: 58. https://doi.org/10.3390/ijms25010058
Note that from the first issue of 2016, this journal uses article numbers instead of page numbers. See further details here.