
Electrical Double Layer Mechanism Analysis of PEM Water Electrolysis for Frequency Limitation of Pulsed Currents


Power Conversion System Research Center, Korea Electrotechnology Research Institute (KERI), Changwon 51543, Korea
*
Author to whom correspondence should be addressed.
Energies 2021, 14(22), 7822; https://doi.org/10.3390/en14227822
Submission received: 26 October 2021
/
Revised: 11 November 2021
/
Accepted: 19 November 2021
/
Published: 22 November 2021
(This article belongs to the Special Issue Advances in Hydrogen Energy Production and Storage)
Abstract
:This paper proposes a method for improving hydrogen generation using pulse current in a proton exchange membrane-type electrolyzer (PEMEL). Traditional methods of electrolysis using direct current are known as the simplest approach to produce hydrogen. However, it is highly dependent on environmental variables, such as the temperature and catalyst used, to enhance the rate of electrolysis. Therefore, we propose electrolysis using a pulse current that can apply several dependent variables rather than environmental variables. The proposed method overcomes the difficulties in selecting the frequency of the pulse current by deriving factors affecting hydrogen generation while changing the concentration generated by the cell interface during the pulsed water-electrolysis process. The correlation between the electrolyzer load and the frequency characteristics was analyzed, and the limit value of the applicable frequency of the pulse current was derived through electrical modeling. In addition, the operating characteristics of PEMEL could be predicted, and the PEMEL using the proposed pulse current was verified through experiments.
1. Introduction
A hydrogen-centered society that is likely to be realized in the near future has been taking shape lately. As the world is moving towards reducing carbon-emissions while simultaneously combating the depletion of fossil fuels such as natural gas, coal, and petroleum, hydrogen is one of the most attractive forms of energy for a sustainable future. Although hydrogen has very eco-friendly features and is abundantly available as universal energy on the Earth, it exists in the form of water or organic compounds. Therefore, various studies for producing hydrogen are being conducted [1,2,3].
Generally, hydrogen can be classified as gray hydrogen, blue hydrogen, and green hydrogen according to the production method. Among them, green hydrogen is obtained by directly electrolyzing water with electricity produced either from a renewable energy source or surplus energy. Because only hydrogen and oxygen are produced during the water electrolysis process, carbon dioxide is not emitted at all, making green hydrogen the most eco-friendly energy source [4,5]. Therefore, water electrolysis is essential to produce green hydrogen and it can be produced from various types of elctrolyzers (EL). In particular, PEM water electrolysis provides a sustainable solution for hydrogen production owing to its features, such as miniaturization, fast response, wide current range, and excellent operating flexibility [6]. Moreover, it is well suited for combination with other renewable energy sources such as solar and wind power. However, as a result of low demand in the last century, research on PEM electrolysis was restricted to membrane-electrode assembly [7,8,9], electrodes [10], electro-catalysts [11,12], and renewable energy linkage [13]; although there are many challenges, they have not yet been explored. Therefore, considering the difficulties and development level of past studies, a new research direction for green hydrogen production solutions and a roadmap needs to be developed. However, the PEMEL process in vogue still adheres to electrolysis using DC current. Water electrolysis using DC current is limited by environmental variables such as temperature, catalyst, pressure, etc. Electric energy input without considering the characteristics of the EL load may limit the green hydrogen production capability and consequently become a bottleneck in the wake of future growth in hydrogen demand. Therefore, an alternative method for increasing hydrogen productivity is needed. From the moment pulsed water electrolysis was first studied, many studies on PEMEL have been proposed in the literature.
The use of the pulse electrolysis technique began with its origins in the electroplating industry, and Bockris et al. studied the pulse electrolysis technique theoretically for the first time in 1952 [14]. They observed that a pulsed current which is generated by a pulsed electric field was followed by a continuous flow of current for a short time even after the electric field disappeared. Furthermore, their study suggested that hydrogen may be generated due to the rapid adsorption or desorption of hydrogen ions around the electrode and the surface and that the hydrogen generation process could be influenced by the condition of the pulsed electric field.
In 1976, Tseung et al. experimentally determined that the application of a voltage pulse affects the surface state of the electrode [15]. During conventional electrolysis, a film of bubbles is formed on the electrode surface, causing an increase in the overpotential of the resistor and the application of a pulse voltage negates the overpotential of the resistor. When a pulse potential is applied, the substrate near the electrode is rapidly consumed forming a concentration gradient between the electrode and the surface: this concentration gradient region is usually referred to as a diffusion layer. However, the relationship between the diffusion layer thickness and the diffusion limiting current in mass transfer has not been mentioned in the aforesaid study.
In 1980, Puippe et al. quantitatively studied that the value of the pulse on/off time during pulse electrolysis in electroplating could be limited by the charge/discharge rate of the electric double layer [16]. The charging of the bilayer requires a certain amount of time that depends on the current density and the physicochemical parameters of the system. This suggests that shorter on/off times comparable to the charging or discharging times of the double layer should be avoided. While the authors did conduct a study on the attenuation effect of the current that can occur due to the distortion of the pulse in the aspect of the Faraday process, they failed to explain the advantages of the non-Faraday process related to the diffusion.
In 1993, Shaaban conducted a comparative study of the losses at various frequencies and duty cycles in pulsed and non-pulse electrolysis. Although the findings of the study are certainly worth considering, rather than mentioning the positive effects of the existing pulse electrolysis processes, the study raised concerns about the following negative effects [17], viz., acceleration of corrosion due to current polarity reversal during pulse off period, high electrical energy requirement under pulsed current conditions, and reactive losses due to inductive reactance. However, because the range of frequencies applied in the author’s pulse experiment was very wide, the difficulties in selecting the right applied frequency were not considered. In addition, unlike in electroplating, in a water electrolyzer, current flow with opposite polarity does not occur. Moreover, application of a higher frequency has a negative effect on the reactive loss because of the higher inductive reactance.
In 2012, Mazloomi et al. concluded that the power efficiency of a water electrolysis cell can be increased by having minimum impedance at the resonant frequency [18]. According to them, in the current versus frequency graph for the electrolysis process, the least impedance occurs at a specific frequency, and this was used to reduce the cell voltage required to reach a certain level of current. In this study, it was assumed that the electrolyzer would be similar to that of the electrical equivalent circuit of a battery, and accordingly, the voltage required to reach a specific level of current at a specific frequency was derived. In reality, this assumption may not hold well because the equivalent circuit of an electrolyzer seems to require the additional work of predicting and analyzing the experimental results based on numerous test cases, to determine the relevant relationships between the physical setup and the frequency response.
In 2015, Manea et al. conducted a study on the optimal pulse shape to increase energy efficiency in water electrolysis [19]. According to them, the main purpose of the experiment was to minimize power consumption during electrolysis by choosing and applying the optimum frequency and waveform. Experimentally, three waveforms were used: sine, triangle and square waves. Particularly, the study helped to establish the effects of frequency and amplitude on the water electrolysis process in comparison with the conventional DC current method. Experimental results show the highest efficiency factor of electrolysis and the maximum volumetric flow rate of hydrogen products at a specific frequency while using a square wave shape. However, because the frequency was selected based on the experimental results, difficulties may arise in selecting the right frequency in experiments of other cells.
In previous studies, the capacitor characteristic component of the pulse (electrical double layer) [14], the effect of the pulse [15], the pulse on/off time condition [16], the applied frequency range [17], and modeling based on experimental cases [18], applied pulse type [19], etc., have been studied. Most of the problems with existing studies are related to the frequency of the applied pulse.
Therefore, this paper analyzes the frequency characteristics of the PEM-type electrolyzer to overcome the difficulties of selecting the applied frequency, derives considerations for pulse current injection, and predicts the operation characteristics of the electrolyzer using the electrical equivalent circuit modeling applied based on the pulse current test results. Moreover, the range of frequency selection was reduced by applying the limit value of the frequency of the applicable pulse. In addition, the current density of the electrolyzer was also increased using the diversity of the output current variable of the power supply, thereby increasing the generation of hydrogen.
2. Pulse Water Electrolysis
2.1. Pulse Operation of Electrolyzer
There are two types of pulse operation: voltage pulse (potentiostatic pulse) and current pulse (galvanostatic pulse). Because a method using voltage pulses is used in this study, a basic explanation is required. In particular, the reason for choosing the pulse operation by the voltage pulse is that the voltage pulse has a larger current density than the current pulse [20]. Figure 1 shows the pulse-potential waveform applied in this study, i.e., a single potential pulse and the resulting pulse current.
A voltage pulse changes from a default value, called base-potential , to a peak value called end-potential . Here, the subscript ““ means the default value or steady-state value and the subscript ““ means the final value or peak value. The sum of on-time () and off-time () is the pulse period. The ratio between the on-time and the pulse period is defined as the duty cycle and frequency is reciprocal of the pulse period. Pulse amplitude is the difference between base-potential and end-potential. The resulting current is the sum of the Faraday current (, if the peak current is in the potential range where the water’s electrolysis occurs) and the non-Faraday current () for charging/discharging the electrical double layer.
Water electrolysis using pulsed potential can be applied by changing parameters such as level, amplitude, and duty cycle of the operating point of the pulse waveform by the duty definition of PWM. In this paper, and are used to define the commonly used pulse potential experimental parameters including duty cycle (Equation (1)) and pulse frequency , applied pulsed potential (Equation (2)) as follows:
In water electrolysis, hydrogen production is strongly correlated to the current density. Therefore, to compare the difference in hydrogen generation, the difference between the conventional DC current density and the pulse current density is measured. In other words, it is possible to check how the pulse current flowing through the water electrolysis stack contributes to the volume of hydrogen generated from electrolysis using pulse potential. To summarize, the contribution can be confirmed from the difference in current density (Equation (3)) and the rate of increase in pulse current density (Equation (4)) defined as follows:
where is the high peak value of the pulse current, is the low peak value of the pulse current, and is the rate of increase in the pulse current density.
2.2. Effects of Voltage Pulse
When a voltage pulse is applied to the electrolyzer, a reaction occurs in the ions near the surface of the electrode resulting in an electrolyte concentration difference from the bulk layer to the electrode-electrolyte interface. To resolve this concentration difference, hydrogen cations in the bulk layer move through the electrolyte membrane to the negative electrode through diffusion. The initial hydrogen generation process starts with a non-Faraday process and subsequently hydrogen generation is sustained through a sequential process, i.e., the Faraday process. Here, the non-Faraday process generates an ideal polarized electrode (IPE) through which no charge is transferred and has characteristics similar to that of a capacitor. According to the self-capacitance definition, when an electric potential is applied across a capacitor , an electric charge accumulates on the metal plate until the equation in Equation (5) is satisfied.
Ignoring , the electric constant of Equation (5), and considering the characteristics of a capacitor, the way to have a larger accumulation of charge while applying the same electric potential is either by increasing the area (s) of the electrode plate or by shortening the distance (d) of the electrode plate to allow a larger amount of charge to flow. This provided an important key that applying voltage pulses to the water electrolyzer could affect the hydrogen production process by affecting the thickness of the diffusion layer in IPE (diffusion layer including electric double layer). Particularly, in the pulsed electrolysis on-time diffusion can help achieve a relatively high current density compared to DC current by speeding up both the transfer rate and consumption rate of ions, whereas the off-time diffusion replenishes the ions consumed by the electrolysis. Thus, the pulsed potential-driven mechanism reduces polarization and achieves a relatively higher current efficiency at a fixed potential which in turn improves the hydrogen production efficiency.
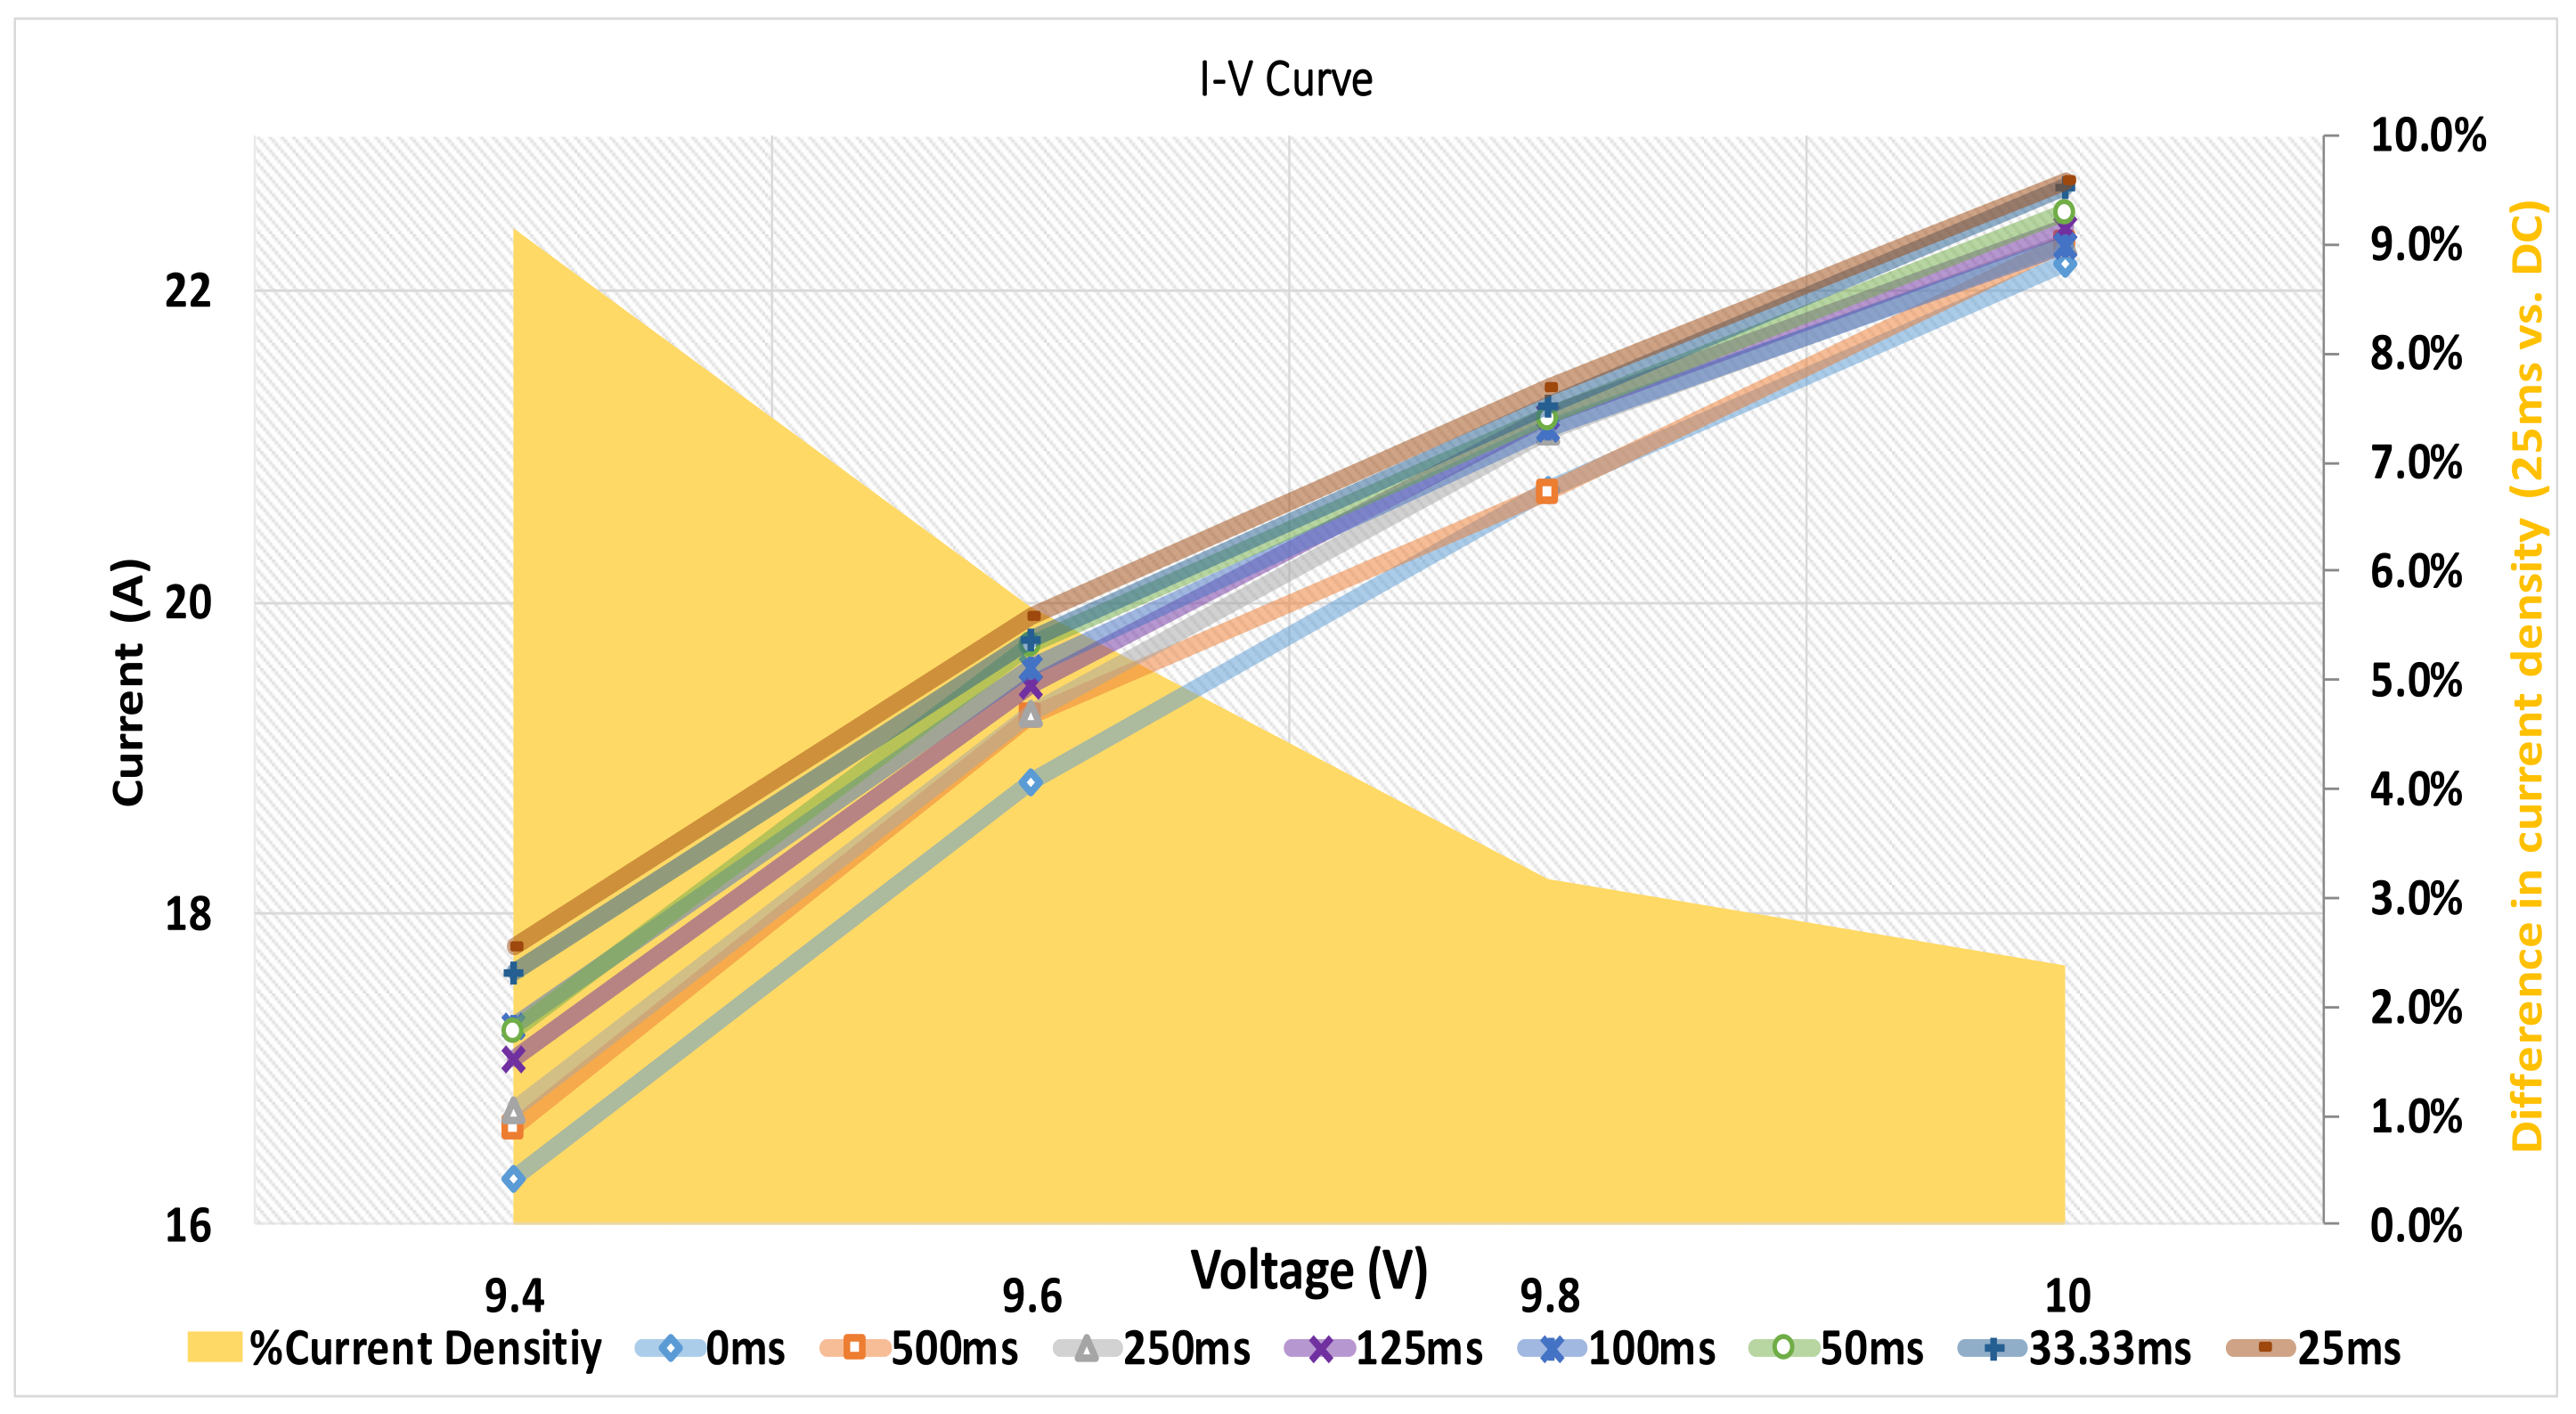
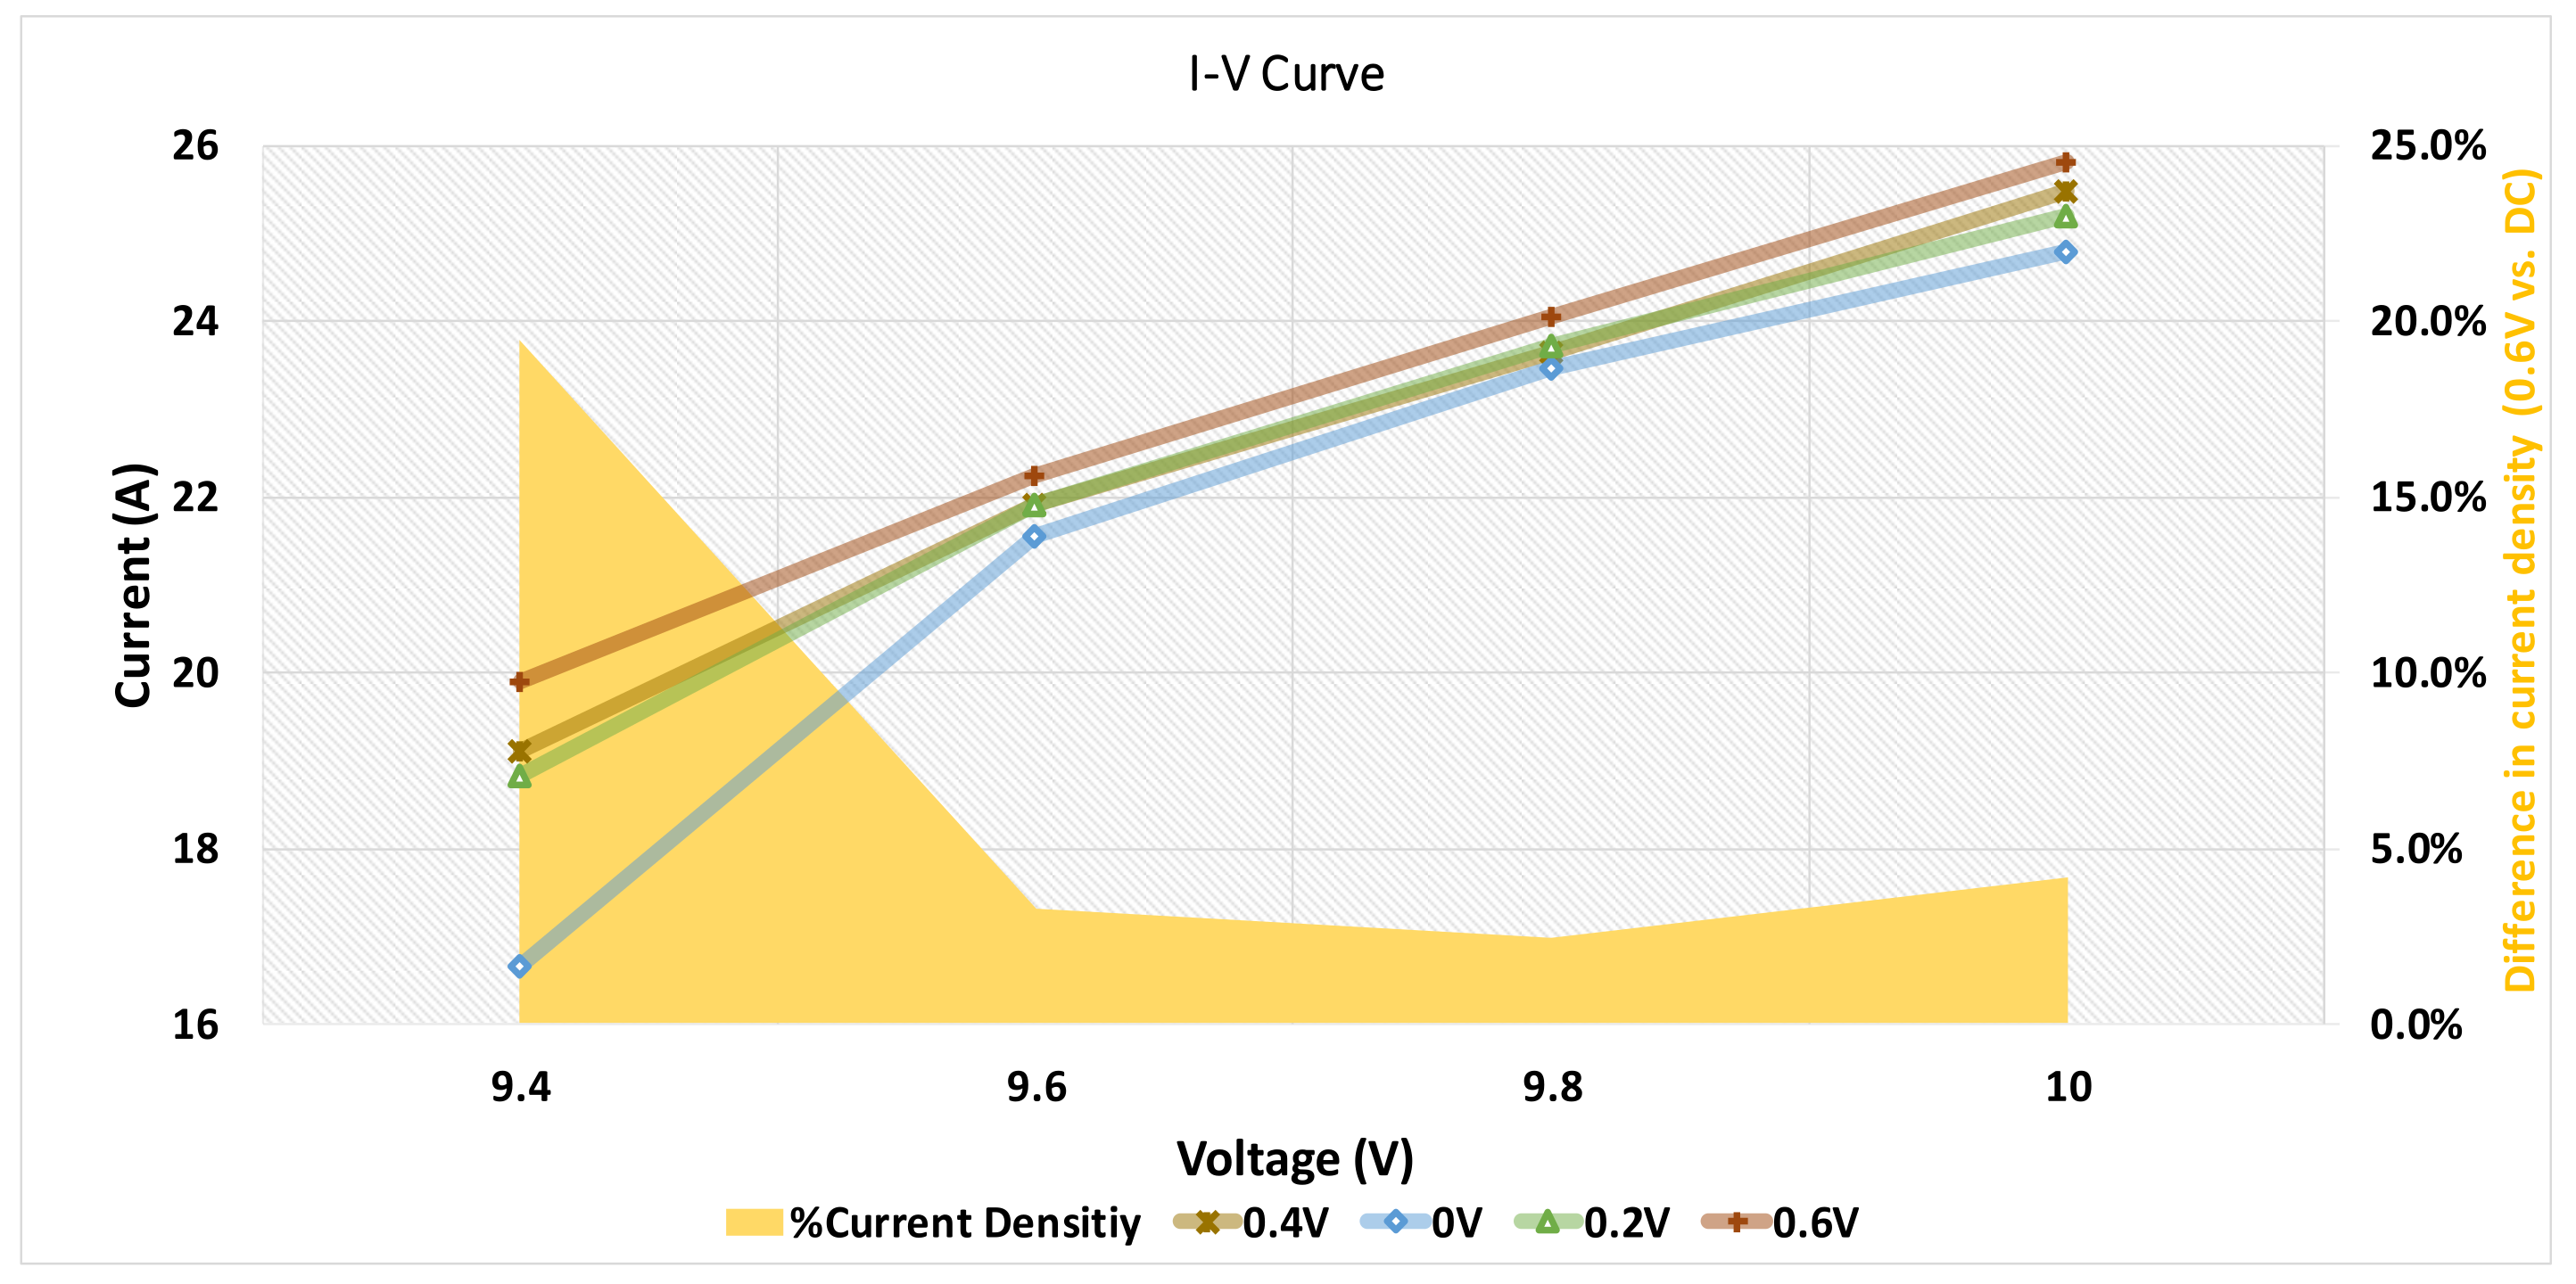
Figure 2 and Figure 3 present the experimental data obtained with a water electrolysis system constructed to investigate the effect of water electrolysis load on the pulse potential. The water electrolysis system configuration will be described in detail in another chapter. Figure 2 shows the I–V curves for single potential pulses with different pulse on-times in the 0.4 V amplitude range: current density for a DC potential is the lowest of them. It can be observed that current density increases with decreasing pulse on-time and the maximum current density occurs at 25 ms on-time ( = 3.5%). Figure 3 shows the I–V curves for single potential pulses with different pulse amplitudes in the 25 ms on-time range. Similarly to the results in Figure 2, the current density for a DC potential is the lowest among them. As the pulse amplitude increases, correspondingly, the current density also increases and the maximum current density occurs at 0.6 V amplitude ( = 4.95%).
To maximize the effect of the pulse, a pulse potential having an appropriate frequency is required and consideration of the diffusion electric double layer is essential. Detailed explanation of the mechanism analysis by pulse potential is presented in the next section.
2.3. Mechanism Analysis by Voltage Pulse
The generation of electric charge is due to component ionization on the material surface, adsorption of ionic components of the medium to the material surface, and ion dissolution. Consequently, the interaction between the attractive and repulsive forces between the generated charges results in the formation of an electric double layer around the surface of the electrode material, which consists of counter ions acting on the surface charge and attraction. Thus, polarization occurs between the surface charge around the electrode and the counter ions resulting in the formation of positive and negative poles similar to a capacitor. This electric double layer capacitor actually has characteristics similar to the case of a dielectric-inserted capacitor, and mainly exhibits a non-Faraday process.
The expression of the Faraday process is mainly in the form of a resistor connected in parallel with the electric double-layer capacitor. Moreover, because the strength of diffusion of hydrogen ions may vary due to the countless ions in the electrolyte itself, when this part is expressed as a resistance then the electrolyzer load equivalent circuit can be expressed in a simplified form as shown in Figure 4. Additionally, the actual voltage applied to the cell in the equivalent circuit can be expressed as the difference between the power supply voltage and the minimum voltage required by the electrolyzer to establish a current flow. The electrical polarization frequency characteristics can be checked from this equivalent circuit. When the electric field is changed in the equivalent circuit as shown in Figure 5, the polarization can be expressed as Equations (6) and (7).
When the electric field is changed in the equivalent circuit as shown in Figure 4, the polarization can be expressed as Equation (6). When the Fourier transform is taken to understand the frequency dependence of Equation (6) then it can be expressed as Equation (7). Here, is the polarization value in the electrostatic field, is a time constant, and is .
From Equation (7), it can be confirmed that the polarization value decreases as the frequency of the electric field increases. From the aforesaid discussion, it can be concluded that when the frequency of the electric field increases the polarization value decreases, thereby increasing the hydrogen production efficiency. However, the frequency cannot be increased indefinitely because it is limited by either the response time of the process of current movement across the electrode-electrolyte interface or the response time of diffusion, i.e., the frequency is dominated by the slowest of the two response times. Usually, charging of a capacitor means that the amount of charge due to diffusion is saturated and no more charge can be accumulated. For this reason, the frequency can be limited by the time constant of the capacitor.
The previous section reviewed the frequency dependence of electric polarization according to the alternating electric field, and the following section is to evaluate the relationship between current strength and frequency by examining the main factors that can be obtained from the main equations of diffusion dynamics. Equation (8) is the main equation of diffusion dynamics.
As shown in Figure 6, the concentration of the reactive species is kept constant in the bulk by convective transfer, whereas in the diffusion layer it exhibits a characteristic decrease as it approaches the electrode. Assuming that the concentration gradient in the diffusion layer is linear, it can be expressed as Equation (9). Here, is the current strength, is the number of electrons participating in the electrochemical reaction, is the Faraday constant, is the diffusion coefficient, is the concentration gradient of the flat electrode surface, and is the thickness of the diffusion layer. The equations establish that the current strength depends on the diffusion coefficient, the concentration gradient, and the thickness of the diffusion layer.
Because diffusion mainly occurs from high concentration to low concentration, all the reactive species reaching the electrode at some points are immediately consumed, as the reaction progresses rapidly. Therefore, in Equation (9), when the concentration on the electrode surface turns zero then it is termed as the diffusion-limited current and can be expressed by Equation (10). The diffusion limiting current is the maximum allowable current that can flow in a water electrolyzer.
From the time expression (11) at which becomes zero, the relational expression (12) between the thickness of the diffusion layer and the frequency can be obtained. From Equation (12) it can be observed that the thickness of the diffusion layer decreases as the frequency increases and that the diffusion-limiting current is proportional to the square root of the frequency.
To apply the knowledge commonly used in the electroplating field to the water electrolyzer, a mechanism analysis was conducted [21]. The results of the analysis of the mechanism revealed that the polarization by the electric field has an inversely proportional relationship with the frequency, whereas the diffusion limiting current has a directly proportional relationship with the frequency, in correspondence with the voltage pulse. Thus, it has been convincingly established that increasing the frequency contributes to the increase of hydrogen production. In the previous section, this empirical truth was briefly suggested, but in order to dispel doubts about the current analysis the experiment was conducted by varying the frequency of the pulse.
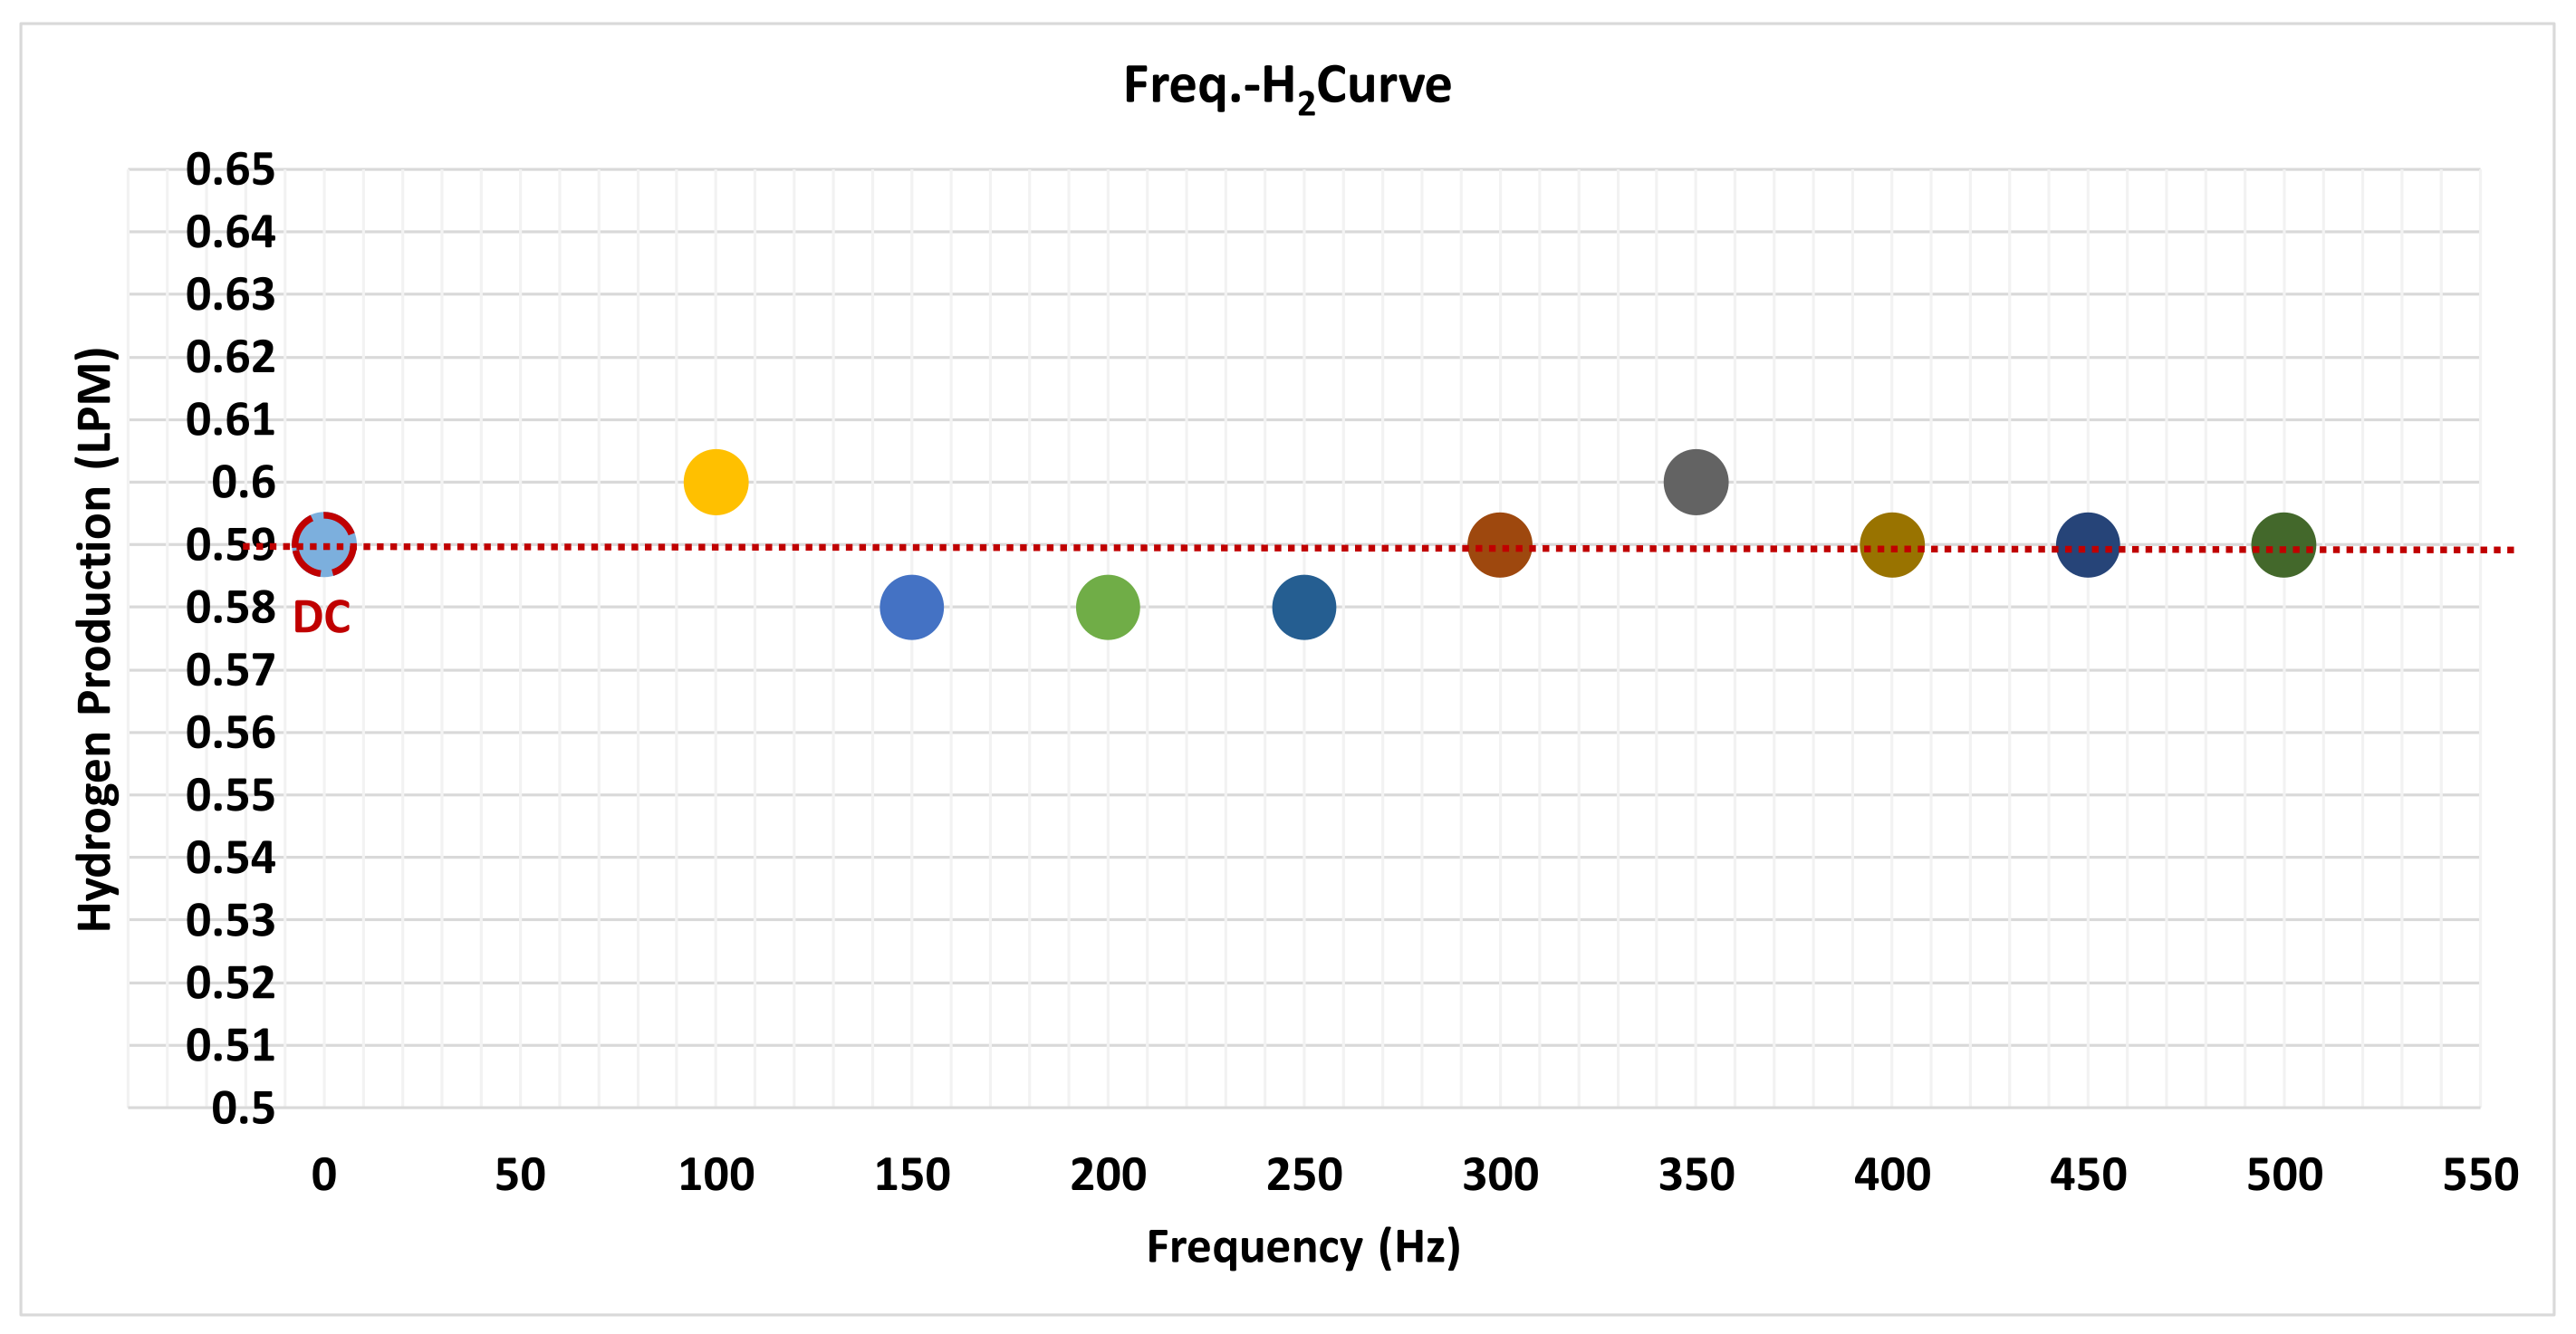
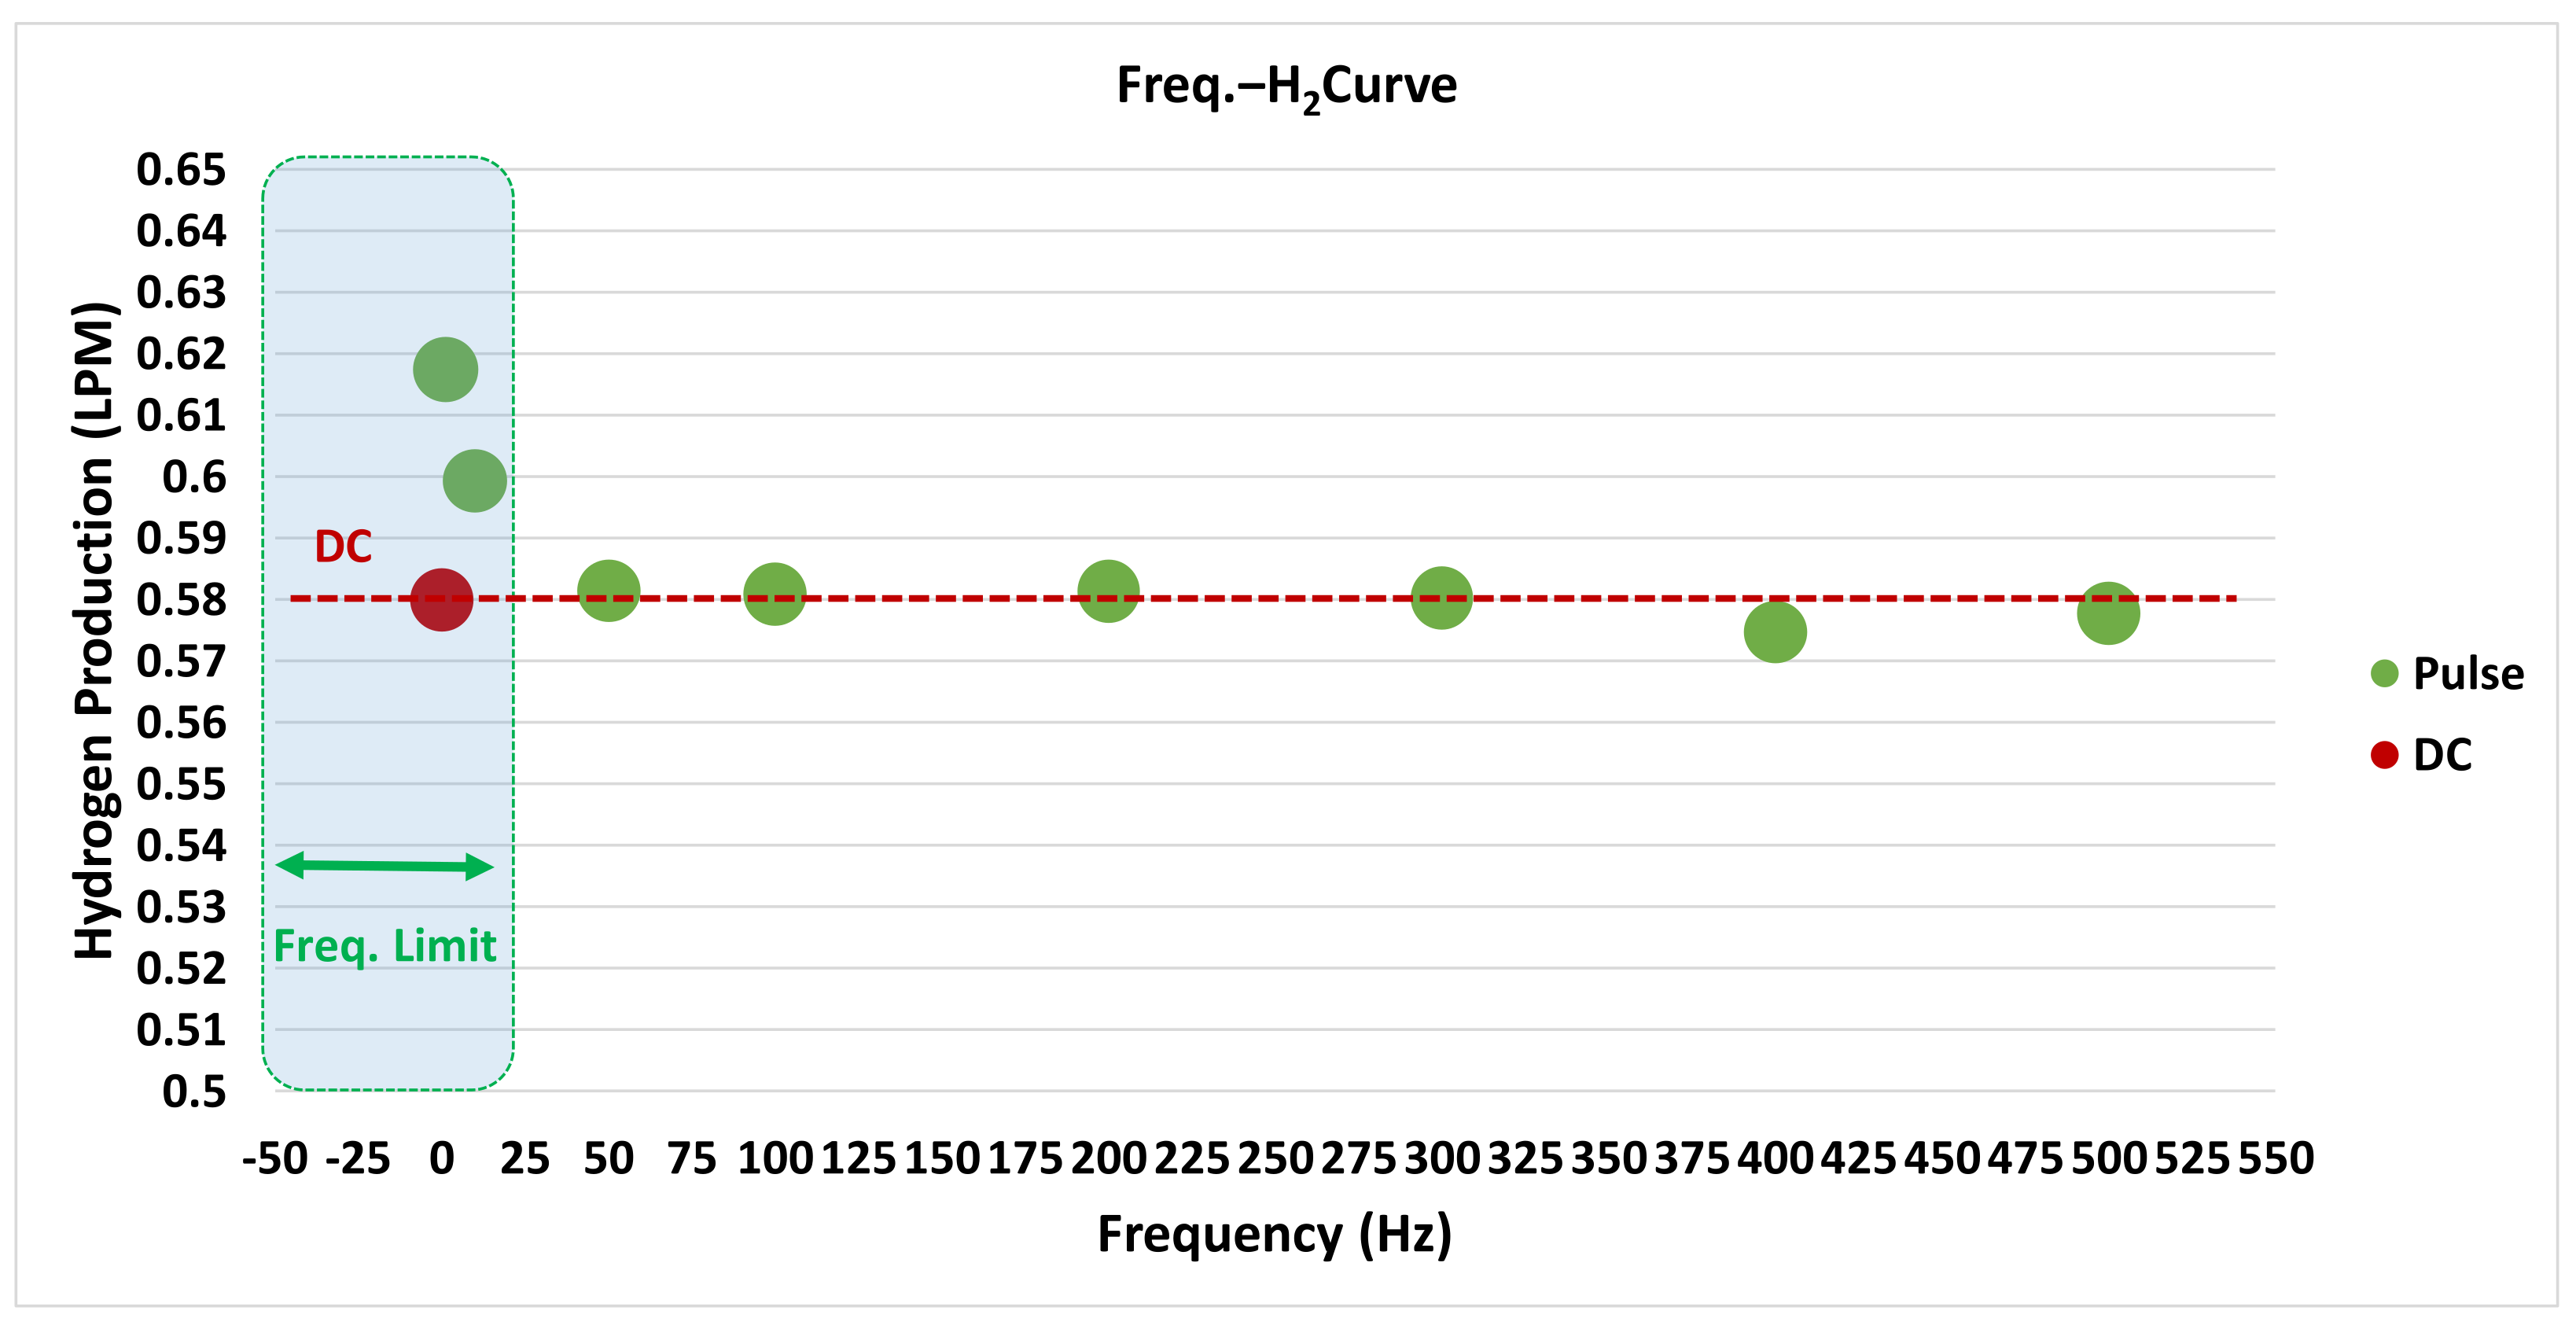
Figure 7 presents a frequency vs. hydrogen production graph obtained through the variable pulse frequency experiment: the amplitude of the pulse was fixed at 0.6 V. From the experimental results shown in Figure 7 it can be observed that when the pulse frequencies were 100 and 350 Hz the hydrogen generation was slightly higher compared to that with DC current. Furthermore, the experimental results emphasize the significance of the selection of the applied frequency when applying the pulse. In the next section, the electrical modeling for frequency selection and prediction of hydrogen generation are described.
3. Limitation of Pulse Frequency through Electrical Modeling
The following is a part of electrical modeling to predict hydrogen production in water electrolyzer based on experimental data and to obtain limits for applied frequencies. Figure 8a shows the I–V characteristic curve of the water electrolyzer. It is basic data obtained from a total of 21st experiments, and as the number of experiments increases, the I–V characteristic curve continues to change due to cell aging. This is because it can change depending on the activation of the cell, the composition of the surrounding environment, and the operating cycle.
For this reason, electrical modeling is required from real-time data during experiments. The equivalent circuit of the electrolyzer generally comprises of the equivalent circuit in the form shown in Figure 4. In this generalized structure, both complex and specific modeling can be performed. However, for electrical modeling of real-time data of a water electrolysis device, a simple model may be more intuitive than a complex model and the parameters of the equivalent circuit can be obtained through a simple experiment.
First, an I–V characteristic curve as shown in Figure 8b can be obtained through a water electrolysis experiment by applying DC. In particular, Figure 8b is a representation of the data from the 17th experiment as an I–V characteristic curve. Equation (13) can be obtained from the curve presented in Figure 8b, while and can be obtained from the equivalent circuit of the water electrolysis cell shown in Figure 4, and it all follows Kirchhoff’s law. Parameter refers to a value obtained by subtracting the voltage required for cell activation from the applied voltage and is the total equivalent resistance of the cell.
Next, as shown in Figure 9, the remaining parameters can be obtained from the current waveform when the pulse potential is applied. It has a state of at before applying the intermittent pulse potential. Since , it can be shown that the . Thus, is an open circuit at in Figure 4. First, can be obtained from the instantaneous charging current charged to when the pulse having is first applied at .
Next, as shown in Figure 10, the pulse on-time () is increased until the moment when the steady-state current occurs and can be obtained from this when the steady-state current occurs. Finally, the time constant for charging the double-layer capacitor can be obtained from the time when the rate of change of current becomes zero when the pulse is applied, and the value of the double-layer capacitor can be obtained using this time constant. Here, represents the Thevenin equivalent circuit resistance. Equations (14)–(16) were used to obtain the parameters of electrical modeling according to Kirchhoff’s law.
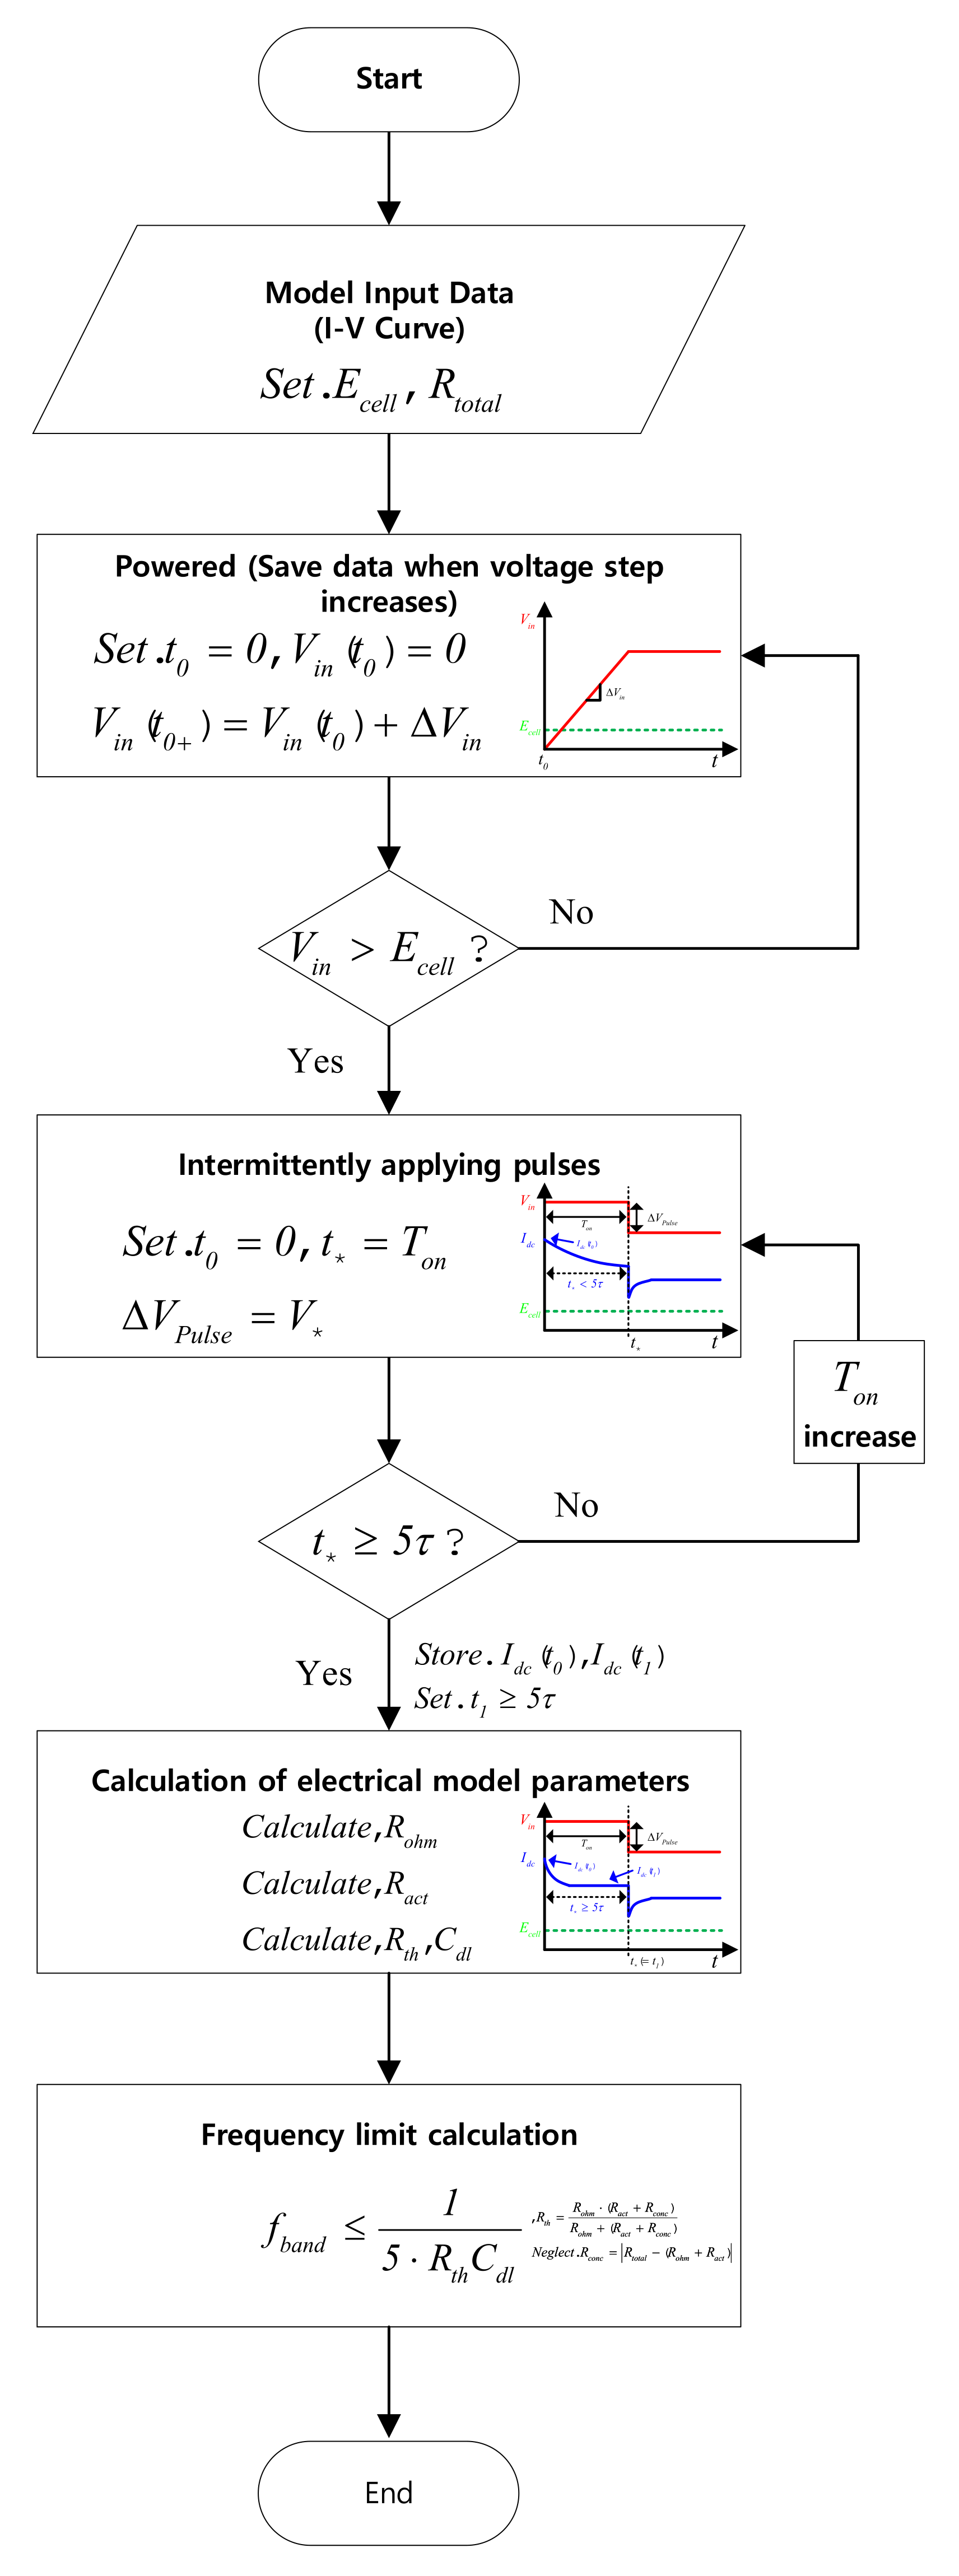
Finally, the frequency limit range for selecting the applied frequency when the pulse is applied is obtained by the RC time constant law. When calculating the frequency limit range using Equations (17) and (18), a more accurate frequency limit value can be obtained by considering the resistance which is caused by the concentration overvoltage. This is because can be obtained by Ohm’s law. Although can be neglected because its value is not large enough in the actual experiment, it is necessary to take it into consideration because the pattern of each experiment varies as it progresses. As a result, as can be seen from the flowchart shown in Figure 11, the final output can obtain a limited value of the applied frequency during pulse operation, and by applying this the hydrogen production within a specified frequency range can be obtained. Table 1 below presents the parameter values of the equivalent circuit obtained based on the experiment.
A pulse electrolysis experiment was performed based on the frequency limit obtained as described above: the amplitude of the pulse was fixed at 0.4 V. Figure 12 shows the results of the pulse electrolysis experiment considering the frequency limit. In conclusion, there was an increase in hydrogen production of up to 5.79% (operating point: 8.9 V/23 A) compared to the DC experiment at frequencies below 20 Hz. However, as the data in Figure 3 show, the effect of the pulse can vary with voltage level. Therefore, it is necessary to conduct an experiment near the rated voltage range which is the reference point.
4. Experimental Results
In this section, the equivalent circuit obtained through electrical modeling was built using the PLECS simulation tool; simulation and experimental results were used to check whether the current density, which has a direct effect on the hydrogen production, derived similar values.
First, the water electrolyzer used in the experiment was configured as shown in Figure 13. A Water electrolyzer is comprised of mainly the PEM stack, a power supply, a heat exchanger, and hydrogen metering devices.
A single stack of 400-W class was used for the PEM stack, and NF’s DP045M model was used as the power supply. This part will be changed to the configuration of the power converter in the future. Finally, the heat exchanger and hydrogen metering devices include a deionized water (D.I. water) reservoir, heat exchanger, water trap, mass flow meter, and temperature controller. In DC and pulse experiments, it is important to keep the temperature as a control variable at 45 °C and the outlet temperature of the stack was controlled in this water electrolysis system. Moreover, DI water was replaced for every experiment to minimize the impact of impurities on the hydrogen production rate. A 5-LPM class flowmeter whose readings can be checked on the laptop through a DAQ device was used for measuring the hydrogen production rate. Table 2 shows the system specifications for a single PEM stack.
Figure 14 shows the simulation results of the DC and pulsed water electrolysis systems obtained through simulations built with electrical modeling. In particular, regarding the pulse used in the simulation, a square wave with a 1 Hz frequency was applied, the same pulse was applied in the experiment. Based on the voltage of the operating point, time and amplitude are 400 ms/+0.2 V for pulse On, and 600 ms/−0.15 V for pulse Off. The simulation results were used as a measure for the prediction of hydrogen production through the DC and pulsed water electrolysis. Details of the hydrogen production, stack voltage, stack current, activation resistance, and current flow through the double layer capacitor for both the DC and pulsed water electrolysis are presented in Figure 14a,b, respectively: the red line represents the average value for each result. In the DC and pulse simulation, the hydrogen production values were 0.8244 LPM and 0.8342 LPM, respectively. Further, the operating stack voltage, stack current, and current density are 10.62 V, 25.48 A, respectively, for the DC test and 9.77 V, 25.79 A, respectively, for the pulse test. Based on the simulation, the applied pulse pattern was predicted to increase the current density by = 8.3% in comparison to the DC test at the rated operating voltage.
Figure 15 shows the voltage and current applied to the PEM stack from the pulse pattern obtained through trial and error in the experiment. Table 3 shows the average values of simulation and experimental results. As can be seen from Table 3, the voltage and power consumption required for a similar operating current to flow in the stack while applying pulse are reduced by 8.16% and 6.78%, respectively, in comparison to DC, while the current density increased by = 8.28% at the rated voltage. From this experimental result, the effect of pulsed water electrolysis can be confirmed. Moreover, the results of the simulation and the experiment are in close agreement; therefore, the validity of the electrical model obtained by the intermittent pulse experiment could be verified.
5. Conclusions
In this paper, based on the pulse current test results, the frequency characteristics of the PEM type electrolyzer were analyzed, considerations for pulse current injection were derived, and the operating characteristics of the electrolyzer were predicted using the electric equivalent circuit model. By applying the frequency limit value of the corresponding pulse, the range of frequency selection was reduced, and the amount of hydrogen generated was increased by increasing the current density of the electrolyzer. The current density variation could be achieved owing to the diversity of the output current variable of the power supply used for the experiment. Furthermore, by applying the proposed pulse type, it was verified that it can contribute to the improvement in hydrogen production through simulations and experiments. The proposed pulse type used in the simulations and experiments utilizes asymmetric pulses with different times and amplitudes in pulse On/Off modes. This was adopted among various pulse types because it showed slightly more pronounced experimental results in hydrogen production. In the future, when designing power sources for power converters, it would be necessary to study hydrogen production in correspondence to the shape/patterns of the applied pulses such as symmetric pulses and asymmetric pulses.
Author Contributions
Conceptualization, and investigation, J.-H.K., T.-J.K.; Methodology, J.-H.K., C.-Y.O., K.-R.K.; Software, J.-H.K., C.-Y.O., K.-R.K.; Validation and formal analysis, J.-H.K., C.-Y.O., K.-R.K., J.-P.L., T.-J.K.; Resources, J.-P.L., T.-J.K.; Data curation, J.-H.K., C.-Y.O., K.-R.K.; Writing—Original draft preparation, J.-H.K.; Writing—Review and editing, J.-H.K., C.-Y.O., K.-R.K., J.-P.L., T.-J.K.; Visualization, J.-H.K., C.-Y.O., K.-R.K.; Supervision, T.-J.K.; Project administration, T.-J.K.; Funding acquisition, J.-P.L., T.-J.K. All authors have read and agreed to the published version of the manuscript.
Funding
This research was supported by Korea Electrotechnology Research Institute(KERI) Primary research program through the National Research Council of Science &Technology(NST) funded by the Ministry of Science and ICT (MSIT) (No. 21A01061).
Institutional Review Board Statement
Not applicable.
Informed Consent Statement
Not applicable.
Data Availability Statement
Not applicable.
Conflicts of Interest
The authors declare no conflict of interest.
References
- Turner, J.; Sverdrup, G.; Mann, M.K.; Maness, P.-C.; Kroposki, B.; Ghirardi, M.; Evans, R.J.; Dan, B. Renewable hydrogen production. Int. J. Energy Res. 2008, 32, 379–407. [Google Scholar] [CrossRef] [Green Version]
- Nikolaidis, P.; Poullikkas, A. A comparative overview of hydrogen production processes. Renew. Sustain. Energy Rev. 2017, 67, 597–611. [Google Scholar] [CrossRef]
- Guilbert, D.; Collura, S.M.; Scipioni, A. DC/DC converter topologies for electrolyzers: State-of-the-art and remaining key issues. Int. J. Hydrog. Energy 2017, 42, 23966–23985. [Google Scholar] [CrossRef]
- Javaid, R. Catalytic Hydrogen Production, Storage and Application. Catalysts 2021, 11, 836. [Google Scholar] [CrossRef]
- Kumar, S.S.; Himabindu, V. Hydrogen production by PEM water electrolysis—A review. Mater. Sci. Energy Technol. 2019, 2, 442–454. [Google Scholar] [CrossRef]
- Carmo, M.; Fritz, D.L.; Mergel, J.; Stolten, D. A comprehensive review on PEM water electrolysis. Int. J. Hydrog. Energy 2013, 38, 4901–4934. [Google Scholar] [CrossRef]
- Millet, P.; Mbemba, N.; Grigoriev, S.; Fateev, V.; Aukauloo, A.; Etiévant, C. Electrochemical performances of PEM water electrolysis cells and perspectives. Int. J. Hydrog. Energy 2011, 36, 4134–4142. [Google Scholar] [CrossRef]
- Immerz, C.; Paidar, M.; Papakonstantinou, G.; Bensmann, B.; Bystron, T.; Vidakovic-Koch, T.; Bouzek, K.; Sundmacher, K.; Hanke-Rauschenbach, R. Effect of the MEA design on the performance of PEMWE single cells with different sizes. J. Appl. Electrochem. 2018, 48, 701–711. [Google Scholar] [CrossRef] [Green Version]
- Burnat, D.; Schlupp, M.; Wichser, A.; Lothenbach, B.; Gorbar, M.; Zuttel, A.; Vogt, U. Composite membranes for alka line electrolysis based on polysulfone and mineral fillers. J. Power Sources 2015, 291, 163–172. [Google Scholar] [CrossRef]
- Lettenmeier, P.; Wang, R.; Abouatallah, R.; Saruhan, B.; Freitag, O.; Gazdzicki, P.; Morawietz, T.; Hiesgen, R.; Gago, A.; Friedrich, K.A. Low-Cost and Durable Bipolar Plates for Proton Exchange Membrane Electrolyzers. Sci. Rep. 2017, 7, srep44035. [Google Scholar] [CrossRef] [PubMed] [Green Version]
- Xu, W.; Scott, K. The effects of ionomer content on PEM water electrolyser membrane electrode assembly performance. Int. J. Hydrog. Energy 2010, 35, 12029–12037. [Google Scholar] [CrossRef]
- Rozain, C.; Millet, P. Electrochemical characterization of Polymer Electrolyte Membrane Water Electrolysis Cells. Electrochim. Acta 2014, 131, 160–167. [Google Scholar] [CrossRef]
- Tesfahunegn, S.G.; Ulleberg, Ø.; Vie, P.J.S.; Undeland, T.M. Optimal shifting of photovoltaic and load fluctuations from fuel cell and electrolyzer to lead acid battery in a photovoltaic/hydrogen standalone power system for improved performance and lifetime. J. Power Sources 2011, 196, 10401–10414. [Google Scholar] [CrossRef]
- Bockris, J.O.; Potter, E.C. The Mechanism of Hydrogen Evolution at Nickel Cathodes in Aqueous Solutions. J. Chem. Phys. 1952, 20, 614–628. [Google Scholar] [CrossRef]
- Tseung, A.; Vassie, P. A study of gas evolution in teflon bonded porous electrodes—III. Performance of teflon bonded Pt black electrodes for H2 evolution. Electrochim. Acta 1976, 21, 315–318. [Google Scholar] [CrossRef]
- Puippe, J.C.; Ibl, N. Influence of charge and discharge of electric double layer in pulse plating. J. Appl. Electrochem. 1980, 10, 775–784. [Google Scholar] [CrossRef]
- Shaaban, A.H. Water Electrolysis and Pulsed Direct Current. J. Electrochem. Soc. 1993, 140, 2863–2867. [Google Scholar] [CrossRef]
- Mazloomi, K.; Sulaiman, N.; Moayedi, H. An Investigation into the Electrical Impedance of Water Electrolysis Cells—With a View to Saving Energy. Int. J. Electrochem. Sci. 2012, 7, 3466–3481. [Google Scholar]
- Manea, D.; Al-Hasnawi, H. Experimental Study of Wave Shape and Frequency of the Power Supply on the Energy Efficiency of Hydrogen Production by Water Electrolysis. Int. J. Innov. Res. Sci. Eng. Tech. 2015, 4, 12239–12250. [Google Scholar]
- Kireev, S.Y. Intensification of Processes of Electrodeposition of Metals by Use of Various Modes of Pulse Electrolysis. Inorg. Mater. Appl. Res. 2017, 8, 203–210. [Google Scholar] [CrossRef]
- Gamburg, Y.D.; Zangari, G. Theory and Practice of Metal Electrodeposition; Springer Science & Business Media: New York, NY, USA, 2011; pp. 1–378. [Google Scholar]
Figure 1.
Pulse operation by voltage pulse.

Figure 2.
I–V characteristic curve of electrolyzer according to pulse-on time variable.

Figure 3.
I–V characteristic curve of electrolyzer according to pulse-amplitude variable.

Figure 4.
Equivalent circuit of water electrolysis load.

Figure 5.
Frequency dependence of electrical polarization.

Figure 6.
Concentration gradients of internal chemical species in the water electrolyzer.

Figure 7.
Frequency vs. H2 production characteristic curve of electrolyzer according to pulse-frequency variable.
Figure 7.
Frequency vs. H2 production characteristic curve of electrolyzer according to pulse-frequency variable.

Figure 8.
I–V characteristic curve of water electrolyzer: (a) the whole experiment, (b) a specific operating point.
Figure 8.
I–V characteristic curve of water electrolyzer: (a) the whole experiment, (b) a specific operating point.

Figure 9.
Initial instantaneous charging current when intermittent pulse potential is applied.

Figure 10.
Steady-state current when intermittent pulse potential is applied.

Figure 11.
Flowchart of electrical modeling.

Figure 12.
Frequency vs. H2 characteristic curves of electrolyzer with pulse-frequency variable limits applied.
Figure 12.
Frequency vs. H2 characteristic curves of electrolyzer with pulse-frequency variable limits applied.

Figure 13.
A PEM electrolysis system.

Figure 14.
DC and pulsed operation simulation results: (a) DC, (b) Pulse operation.

Figure 15.
Stack voltage and current pulse patterns applied to the experiment.


Table 1.
Electric modeling parameters.
| Parameter | Value |
|---|---|
| 6.58 V | |
| 0.1498 Ω | |
| 0.0089 Ω | |
| 1.1821 F | |
| ≤20 Hz |
Table 2.
System specifications.
| Parameter | Value |
|---|---|
| Cell diameter | 8 [cm] |
| Single cell area | 50.265 [cm2] |
| Single stack area | 201.061 [cm2] |
| Rated voltage | 10 [Vrms] |
| Rated current | 40 [Arms] |
| Hydrogen production | 1 [LPM] |
| Operating temperature | 45 [°C] |
| Operating voltage | 9.8 [Vrms] |
| Operating current | 25 [Arms] |
| Pulse frequency band | ≤20 [Hz] |
Table 3.
A PEM electrolysis experimental result data.
| DC (Simulation/Experiment) | Pulse (Simulation/Experiment) | |
|---|---|---|
| Operating voltage | 10.62/10.6 [Vrms] | 9.77/9.8 [Vrms] |
| Operating current | 25.48/25.49 [Arms] | 25.79/25.82 [Arms] |
| Operating Power | 270.59/270.19 [W] | 251.96/253.03 [W] |
| Hydrogen production | 0.8244/0.8243 [LPM] | 0.8342/0.8375 [LPM] |
| Current Density | 0.506/0.507 [A/cm2, @10.6 Vrms/25.49 Arms] | 0.548/0.549 [A/cm2, @10 Vrms/27.60 Arms] |
Publisher’s Note: MDPI stays neutral with regard to jurisdictional claims in published maps and institutional affiliations. |
© 2021 by the authors. Licensee MDPI, Basel, Switzerland. This article is an open access article distributed under the terms and conditions of the Creative Commons Attribution (CC BY) license (https://creativecommons.org/licenses/by/4.0/).
Share and Cite
MDPI and ACS Style
Kim, J.-H.; Oh, C.-Y.; Kim, K.-R.; Lee, J.-P.; Kim, T.-J. Electrical Double Layer Mechanism Analysis of PEM Water Electrolysis for Frequency Limitation of Pulsed Currents. Energies 2021, 14, 7822. https://doi.org/10.3390/en14227822
AMA Style
Kim J-H, Oh C-Y, Kim K-R, Lee J-P, Kim T-J. Electrical Double Layer Mechanism Analysis of PEM Water Electrolysis for Frequency Limitation of Pulsed Currents. Energies. 2021; 14(22):7822. https://doi.org/10.3390/en14227822
Chicago/Turabian StyleKim, Jae-Hoon, Chang-Yeol Oh, Ki-Ryong Kim, Jong-Pil Lee, and Tae-Jin Kim. 2021. "Electrical Double Layer Mechanism Analysis of PEM Water Electrolysis for Frequency Limitation of Pulsed Currents" Energies 14, no. 22: 7822. https://doi.org/10.3390/en14227822
Note that from the first issue of 2016, this journal uses article numbers instead of page numbers. See further details here.