Article

Parameter Identification of Electrical Equivalent Circuits including Mass Transfer Parameters for the Selection of the Operating Frequencies of Pulsed PEM Water Electrolysis

Power Conversion System Research Center, Korea Electrotechnology Research Institute (KERI), Gwangju-si 61751, Republic of Korea
*
Author to whom correspondence should be addressed.
Energies 2022, 15(24), 9303; https://doi.org/10.3390/en15249303
Submission received: 4 November 2022 / Revised: 29 November 2022 / Accepted: 30 November 2022 / Published: 8 December 2022

Abstract

:
This paper proposes a parameter identification method for a PEM electrolyzer electrical equivalent circuit for pulse electrolysis. Since general water electrolysis mainly uses DC currents, identifying equivalent circuit parameters using electrical characteristics mostly ignores the operation frequency and unnecessarily adheres to the secondary RC model. However, looking at the Nyquist plot of the PEM electrolyzer, it can be confirmed that identifying the operational frequency is necessary, and the secondary RC model correction is essential. Therefore, the proposed method confirms the necessity of reconstructing an electrical equivalent circuit with a primary RC model by analyzing the transient cell voltage using step current inputs and calculating an appropriate operating frequency by identifying the parameters of the reconstructed equivalent circuit. To verify the proposed parameter identification method, a simulation was constructed from the raw test data of a 400 W commercial PEM electrolyzer. In addition, the hydrogen production amount was compared to DC using a pulse electrolysis experiment at the operating frequency obtained by the proposed method.

1. Introduction

Currently, hydrogen is considered a next-generation clean energy that does not emit pollutants that harm the environment in terms of global carbon neutrality and has higher efficiency than conventional fossil fuels (natural combustion, coal, and oil) [1]. For this reason, many water electrolysis research projects dealing with hydrogen have been proposed [2]. In particular, water electrolysis is performed using an electrolyzer (EL). An electrolyzer is a device that uses DC [3] and pulses current [4] to induce an electrochemical reaction that separates pure water into oxygen and hydrogen. There are various methods for producing hydrogen; in particular, the electrolysis of water is essential for producing clean hydrogen, which can be produced by using various types of EL.
Water electrolysis is usually classified based on electrolytes and charge carriers as follows: alkaline EL (AEL), proton exchange membrane EL (PEMEL), and solid oxide EL (SOEL). Unlike the SOEL process, which is still in the developmental stage, AEL and PEMEL are currently going through an implementation phase on a commercial scale. Among them, PEM water electrolysis provides solutions for next-generation carbon neutrality with respect to hydrogen production in conjunction with renewable energy sources (RES) due to features such as its small size, wide current density range, no use of toxic electrolytes, and excellent operating flexibility when manufactured [5].
On the other hand, since expensive catalyst materials are used for both the anode and the cathode, constituting the PEMEL membrane, it is necessary to consider the high initial system construction cost and the reduction in the lifespan of the PEMEL cell that may occur during operations. For this reason, modeling the PEMEL is essential. In the past, models considering electrochemical reactions were dominant [6,7], and Nyquist plots related to mass transfer were also analyzed in applications that required the analysis of electric double-layer capacitors [8,9]. In the past, electrochemical reactions focused on static and slow reactions relative to external environments, such as temperature and pressure, and had a complex form for mathematical expression; thus, intuitions were inevitably reduced. In addition, only the characteristics of each parameter’s change were considered via the analysis of the Nyquist plots related to mass transfers in various applications where electric double-layer capacitors exist. Therefore, it is necessary to intuitively model an electrical equivalent circuit by using the dynamic voltage or dynamic current characteristics of the water electrolyzer, breaking away from the existing model and considering the electrochemical reaction. In addition, since there is an electric double-layer capacitor, only analyzing the characteristics of the water electrolyzer related to the frequency is inevitable. This is because it is obvious that these frequency characteristics are related to the amount of hydrogen production.
Several models of electrical equivalent circuits have been reported in the literature on EL in recent years [10,11,12,13,14,15,16]. Most of the modeling was performed using a secondary RC ladder circuit based on the static–dynamic modeling of the electrolysis cell. Most literature focuses only on parameter extraction and model accuracy, and modeling considering diffusion kinetics has been neglected. There is an observation that diffusion kinetics is in line with the meaning of considering hydrogen production. For this reason, it is also a part that cannot be completely excluded from modeling electrical equivalent circuits. Electrolyzers are electrochemical devices that require some time (time constant) to stabilize their steady-state operation due to rapid changes in operating conditions (e.g., input current and input voltage) due to the effect of mass transfer by diffusion. This is a result of the effect of the electric double-layer. In order to model an electrical equivalent circuit considering the dynamic characteristics of a water electrolyzer, a process or scenario suitable for it is required. (1) The I-V characteristic curve is obtained by conducting experiments on the cell or the stack of water electrolyzers, and the steady-state characteristics are confirmed. (2) The transient state characteristics of the output cell’s voltage in the input current region where the water electrolyzer operates mainly are verified. (3) An electrical equivalent circuit model is constructed by considering diffusion dynamics using the characteristics of steady and transient states. (4) An operating frequency that contributes to hydrogen production from the configured equivalent circuit’s modeling parameters is selected.
Therefore, in this paper, considering the steady and transient characteristics of cell voltages by step input, we reconstructed an electrical equivalent circuit comprising the primary RC model type, which is more intuitive rather than the existing secondary RC model. The required operating frequency was selected by pulse electrolysis from the parameters of the reconstructed equivalent circuit. To validate the proposed parameter identification method, a simulation was constructed with raw test data of a 400 W commercial PEM electrolyzer, and the hydrogen evolution versus DC was compared by conducting pulsed electrolysis experiments at the operating frequency obtained by the proposed method.

2. Electrical Equivalent Circuit Modeling

2.1. PEM Cell Voltage Transient Characteristics

The conventional electrical equivalent circuit configuration is modeled after the actual configuration of the membrane electrode assembly (MEA) of the PEM stack, as shown in Figure 1. It has a secondary RC model in the form of a cathode, membrane, and anode. The parameters of the equivalent circuit mainly consist of a resistance element and a constant phase element (CPE) component. CPE is mainly used as a double-layer capacitor, and it is expressed in the form of an electrode in parallel with the electrode’s resistance.
When the step input current is applied to the PEM stack, the cell’s voltage in the primary and secondary transient states can be checked in the conventional MEA electrical equivalent circuit configuration, as shown in Figure 2. These two transients are typical of PEM stacks. The first-order transient means a very fast transient that appears at the cathode, and its time constant has a very small value. Conversely, the second-order transient state means a very slow transient state appearing at the anode, and its time constant has a very large value.
Figure 3 shows the Nyquist plot of a PEM MEA electrical equivalent circuit model possessing such a transient state. Nyquist plots are used as a visual illustration of the impedance spectrum. At very high frequencies, the imaginary impedance is zero, so the pure resistance is equal to the membrane’s resistance, R o h m . At high frequencies, the resistance is the sum of R o h m and R a c t . c from which the charge transfer resistance from the negative electrode can be calculated. At low frequencies, the resistance is the sum of R o h m and R a c t . a from which the charge transfer resistance from the positive electrode can be calculated. Due to this fast first-order transient of the cathode, it can be neglected when modeling the electrical equivalent circuit.

2.2. Electrical Equivalent Circuit Modeling Considering the Secondary Transient State

Figure 4 shows the electrical equivalent circuit considering the secondary transient state of the anode. It is composed of a membrane, an activation resistor of the anode, and an electric double-layer capacitor. However, the Nyquist plot of the typical RC ladder model considers the Warburg impedance related to the mass transfer loss in the low frequency band [8,9]. This needs to be considered in water electrolysis processes that operate by using DC currents. For this reason, in this paper, the justification for pulsed water electrolysis is given. Figure 5 shows the Nyquist plot of a typical PEMEL with secondary transient characteristics reflected. In addition, a line with a 45-degree slope can be observed in the low-frequency region close to DC due to the influence of Warburg impedance.
An inflection point occurs due to the Warburg impedance in the Nyquist plot. The frequency at this inflection point was experimentally confirmed in 2021 in which the application of a voltage pulse affects the amount of hydrogen generated, and it has a frequency that is similar to the value of the frequency five times the time constant considered at this time [17]. Therefore, as shown in Figure 6, the final electrical equivalent circuit configuration includes the Warburg impedance to select the operating frequency.
The final configuration of the electrical equivalent circuit is shown in Figure 6 considering ohmic, activation, and mass transfer, which are major losses in the PEM cell. The parameters of the electrical equivalent circuit consist of membrane resistance ( R o h m ) related to ohmic loss, activation resistance ( R a c t ) and electric double-layer capacitor ( C d l ) related to activation loss, and Warburg impedance ( Z W ) related to mass transfer. In addition, V r e v is a value obtained by subtracting the voltage, E c e l l , required for cell activation from the applied voltage V E L and R t o t is the total equivalent resistance of the cell. Figure 7 shows the actual I-V curve of a 400 W class commercial PEM cell.
The relational expression that can be inferred from Figure 6 and Figure 7 can be expressed as Equation (1).
V E L = R t o t I E L + E c e l l R t o t = R o h m + Z c t Z c t = R a c t + Z w

3. Parameter Identification Using Current Step Input

Recently, a method for identifying the parameters of an electrical equivalent circuit using voltage pulses has been reported [17]. The reported method used the charge saturation of electric double-layer capacitors in equivalent circuits. Charge saturation is a method that considers the time when the time constant is multiplied five times. The proposed method identifies parameters by acquiring macroscopic data using I-V characteristic curves and by acquiring microscopic data at a specific current level. In particular, the difference from the existing method is that the experimental value is measured before the electric double-layer capacitor is saturated using current pulses, and the corresponding parameters are identified, and then the operating frequency for pulsed water electrolysis is selected.
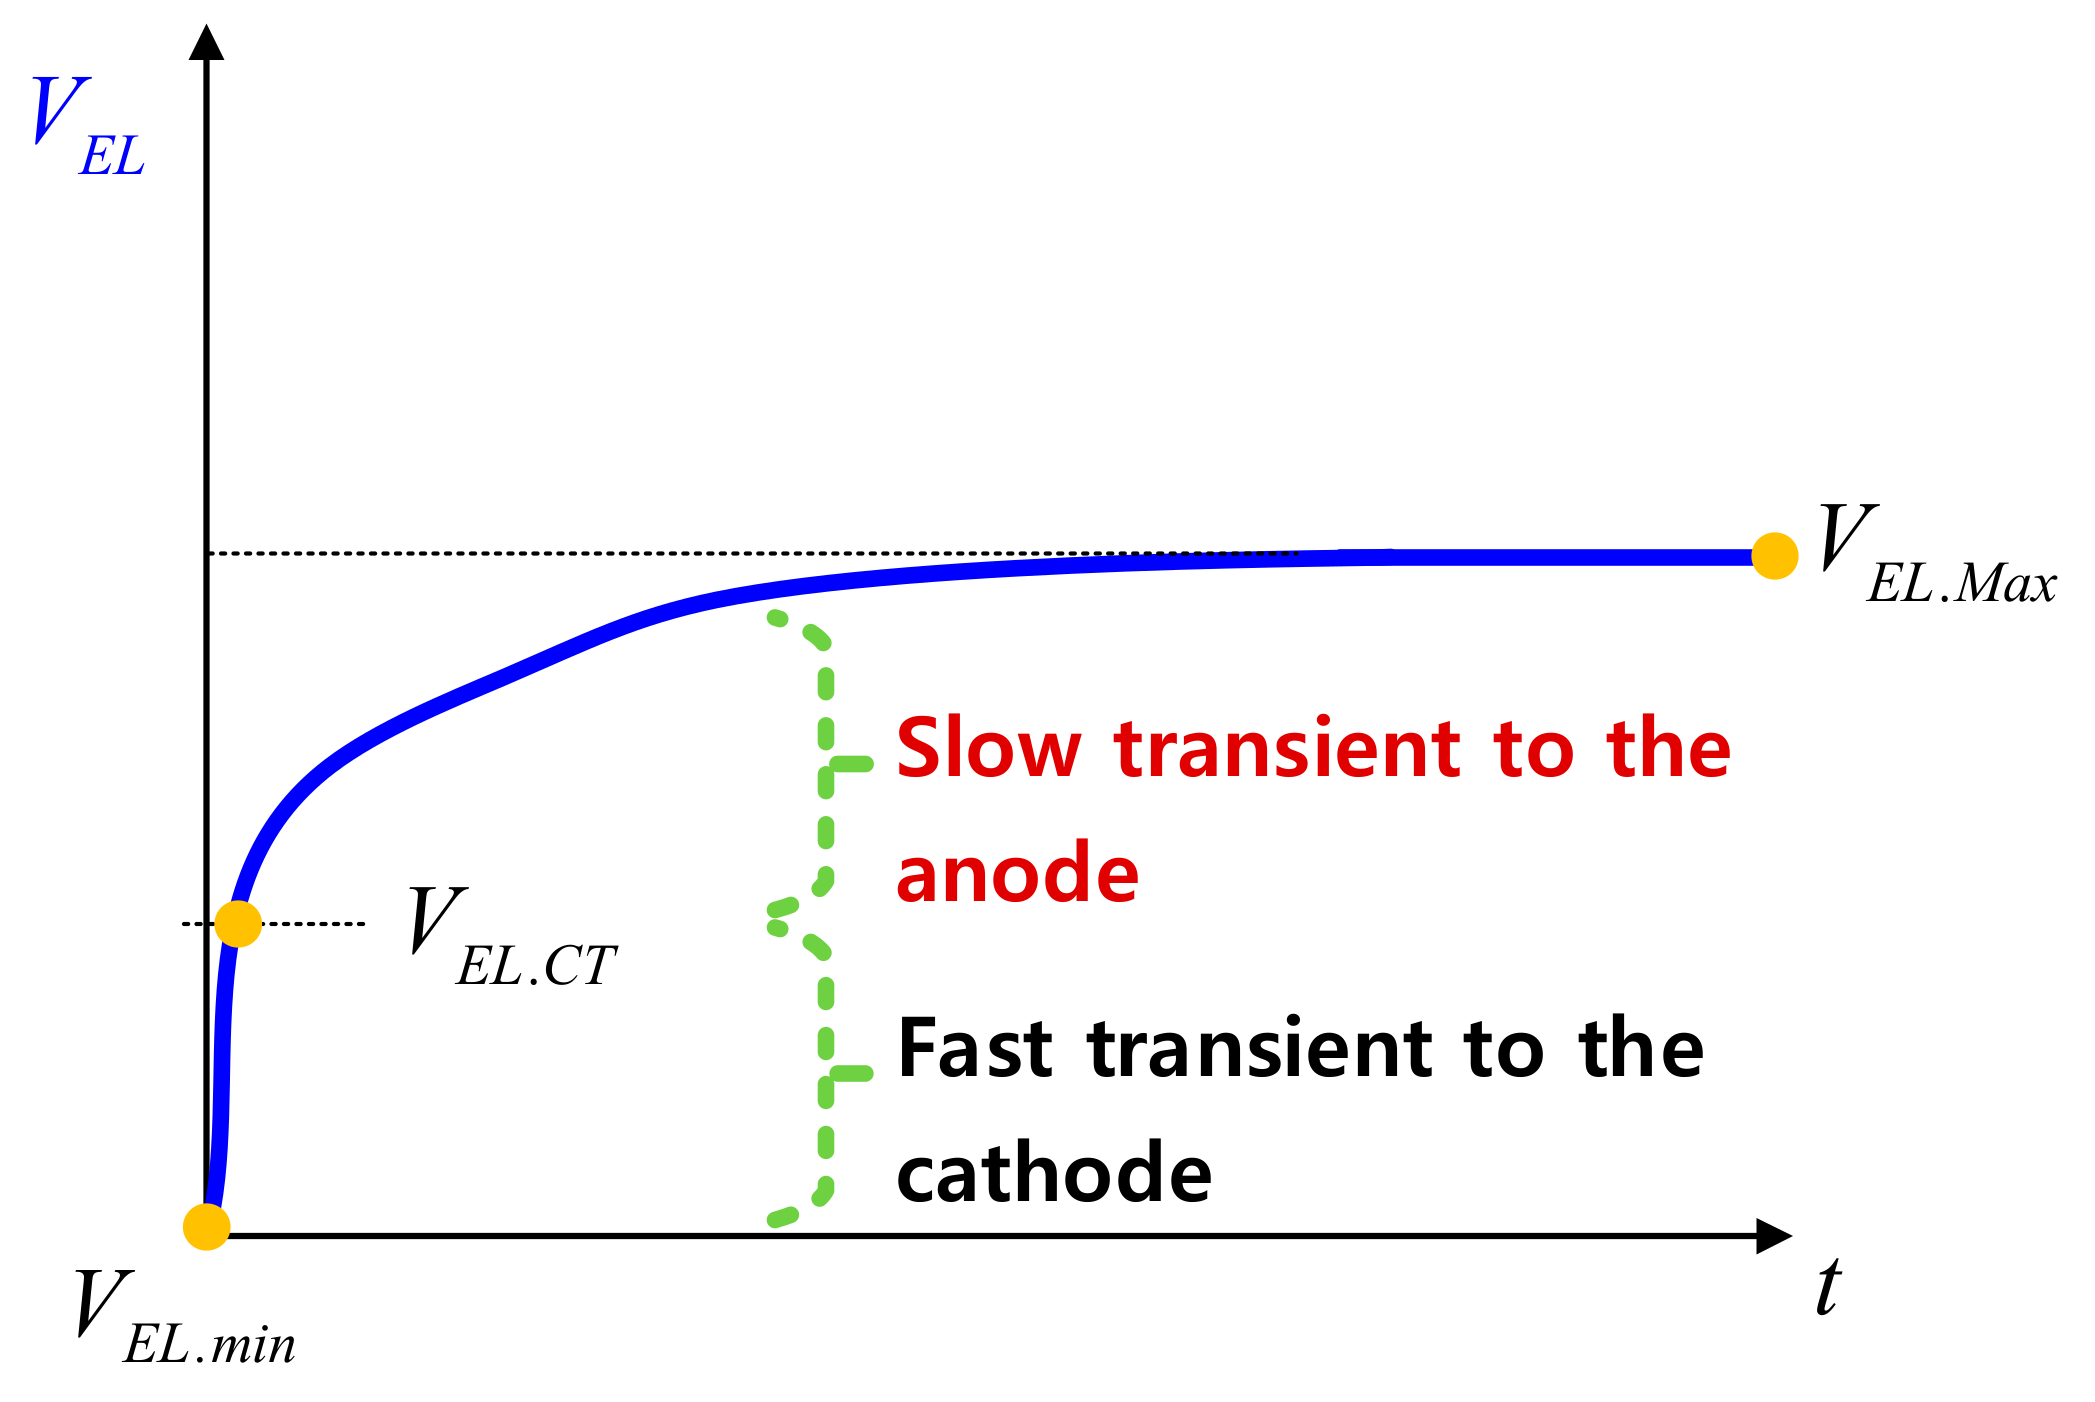
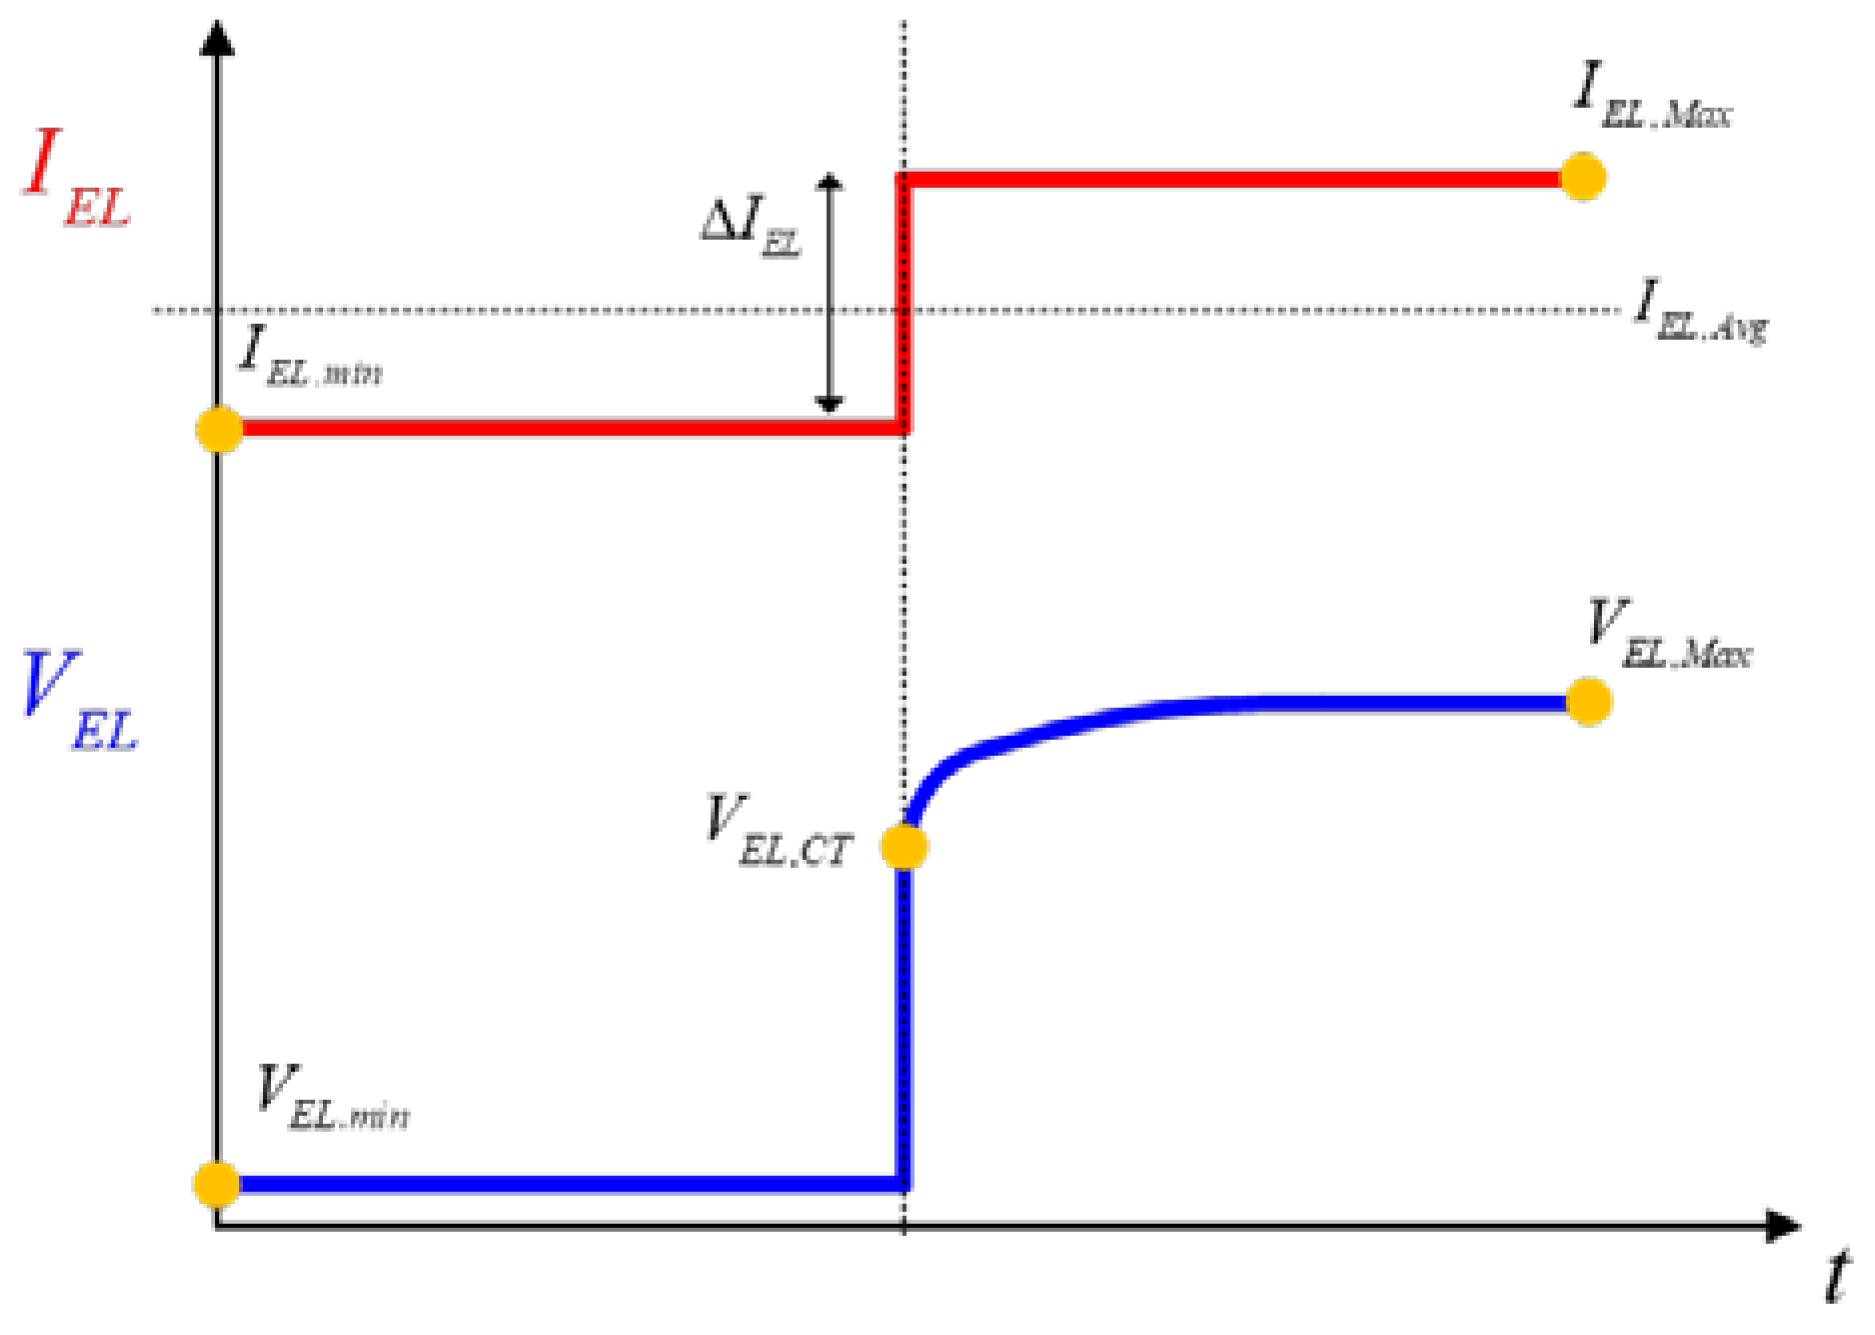
The output voltage of the PEM cell to the current step input is shown in Figure 8. As shown in 
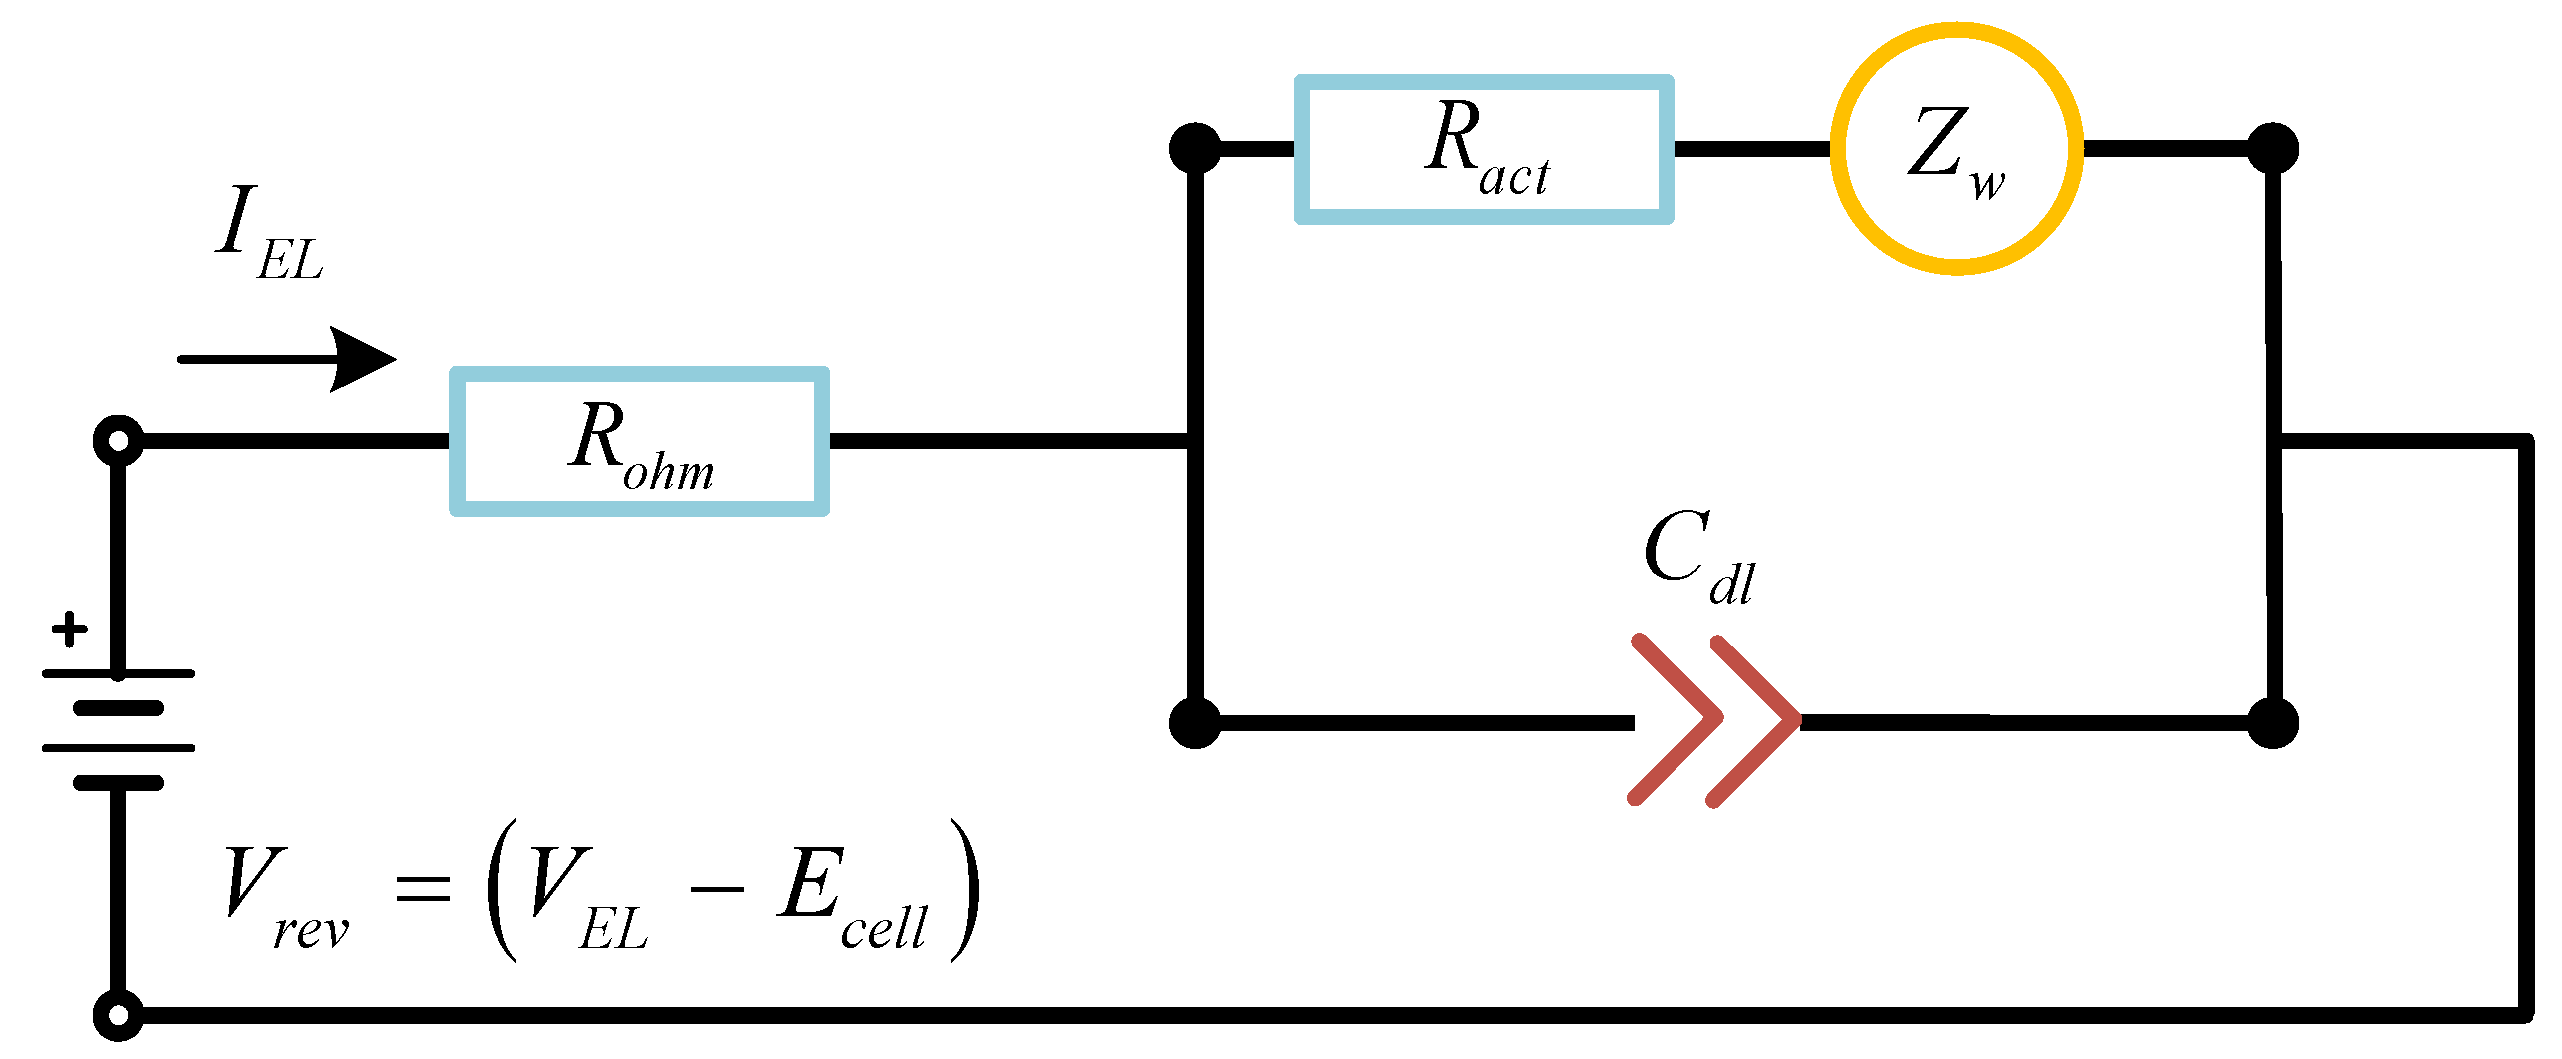
Figure 8, it takes a certain amount of time for the charge to be saturated under the influence of the electric double-layer capacitor. We want to find the parameters of the equivalent circuit shown in Figure 6 from the values of each specific point in Figure 8. Here, I E L . min denotes the base current at the current’s step input, and I E L . M a x denotes the end current at the current step input. Δ I E L denotes the difference in the base–end current at the step input. The cell output voltage refers to the voltage value according to the base–end current. First, the method of obtaining R t o t can be expressed as Equation (2). R t o t 
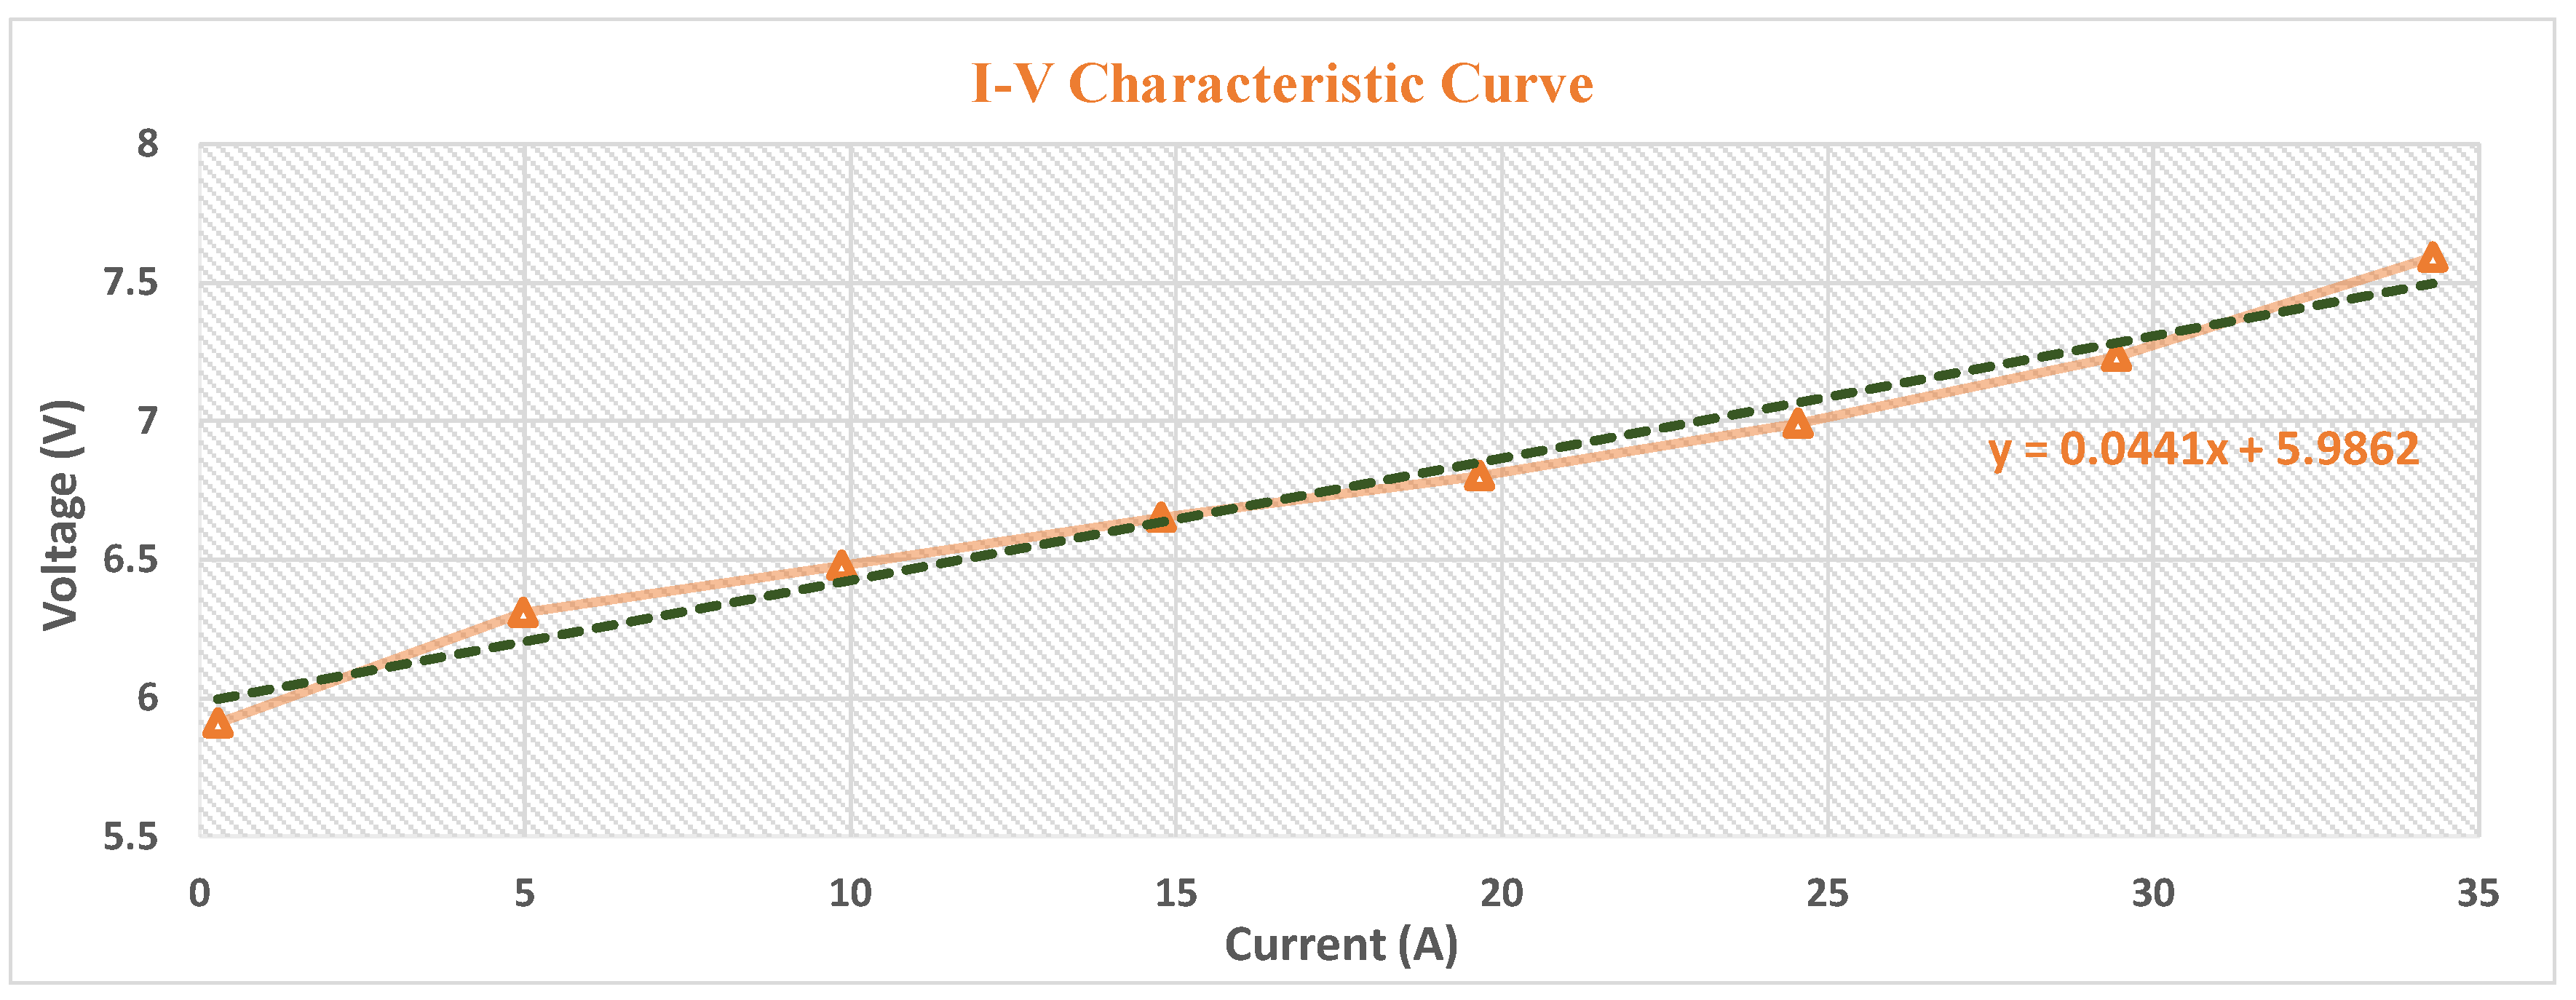
can be calculated using Equation (2), but it has a value that can be immediately known via the I-V characteristic curve in Figure 7. Additionally, information about E c e l l can be found. The reason why the equation is divided into two cases is that there may be a case in which a step input must be applied in a voltage region where no current flows.
R t o t = V E L . M a x V E L . min I E L . M a x I E L . min = V E L . M a x E c e l l I E L . M a x
Next, R o h m can be calculated with Equation (3), and R a c t can be calculated with Equation (4). Here, N s denotes the number of cells in the unit stack.
R o h m = V E L . min E c e l l I E L . min 1 N s R t o t R a c t
R a c t = V E L . M a x V E L . C T I E L . M a x I E L . min R t o t R o h m
From Equation (2) to (4), it can be seen that various data values are required. In particular, there are data values ( V E L . C T ) that have not yet been described in Equation (4). To explain this, it is necessary to look at the rating diagram for the data, as shown in Figure 9.
The macroscopic data are mainly related to the I-V characteristic curves obtained using DC tests. From these characteristic curves, the values of R t o t and E c e l l can be roughly inferred. However, it is necessary to proceed with the same process as observed in Equation (2) because some errors may occur during the linearization operation.
Next, microscopic data are divided into two areas. The first area is the value that can be seen from the step input/output at a specific current level. Approximate values can be known when testing the I-V characteristic curve. Since this can also make an error in the linearization step, it needs to be checked according to the amplitude of the step input. Moreover, if this step is passed, it is possible to check the aging state of the unit stack or cell to some extent. In addition, since the step output value is different depending on the current level, it has been limited to a specific current level so far. The second area is actually defined as values necessary for parameter extraction. V E L . C T is defined as the voltage at which active charging begins. It is also the point at which secondary transients begin to occur. Next, the time constant part is related to the convergence time from the secondary transient state to the steady state. By the definition of this rating diagram, the output voltage of the cell for the step current input can be expressed as Equation (5). It can be seen from Equation (5) that the model of the actual output voltage can be similarly expressed via parameter identification.
V ( t ) = ( V E L . C T V E L . M a x ) e ( t / R a c t C d l ) + V E L . M a x
In the case of V E L . C T , it can be obtained from Equation (6), but in order to increase the accuracy of the data’s value, an experimental measurement value is used. V E L . min and V E L . M a x are also expressed as (7).
V E L . C T = R o h m I E L . M a x + R a c t I E L . min + E c e l l
V E L . min = R o h m I E L . min + R a c t I E L . min + E c e l l V E L . M a x = R o h m I E L . M a x + R a c t I E L . M a x + E c e l l
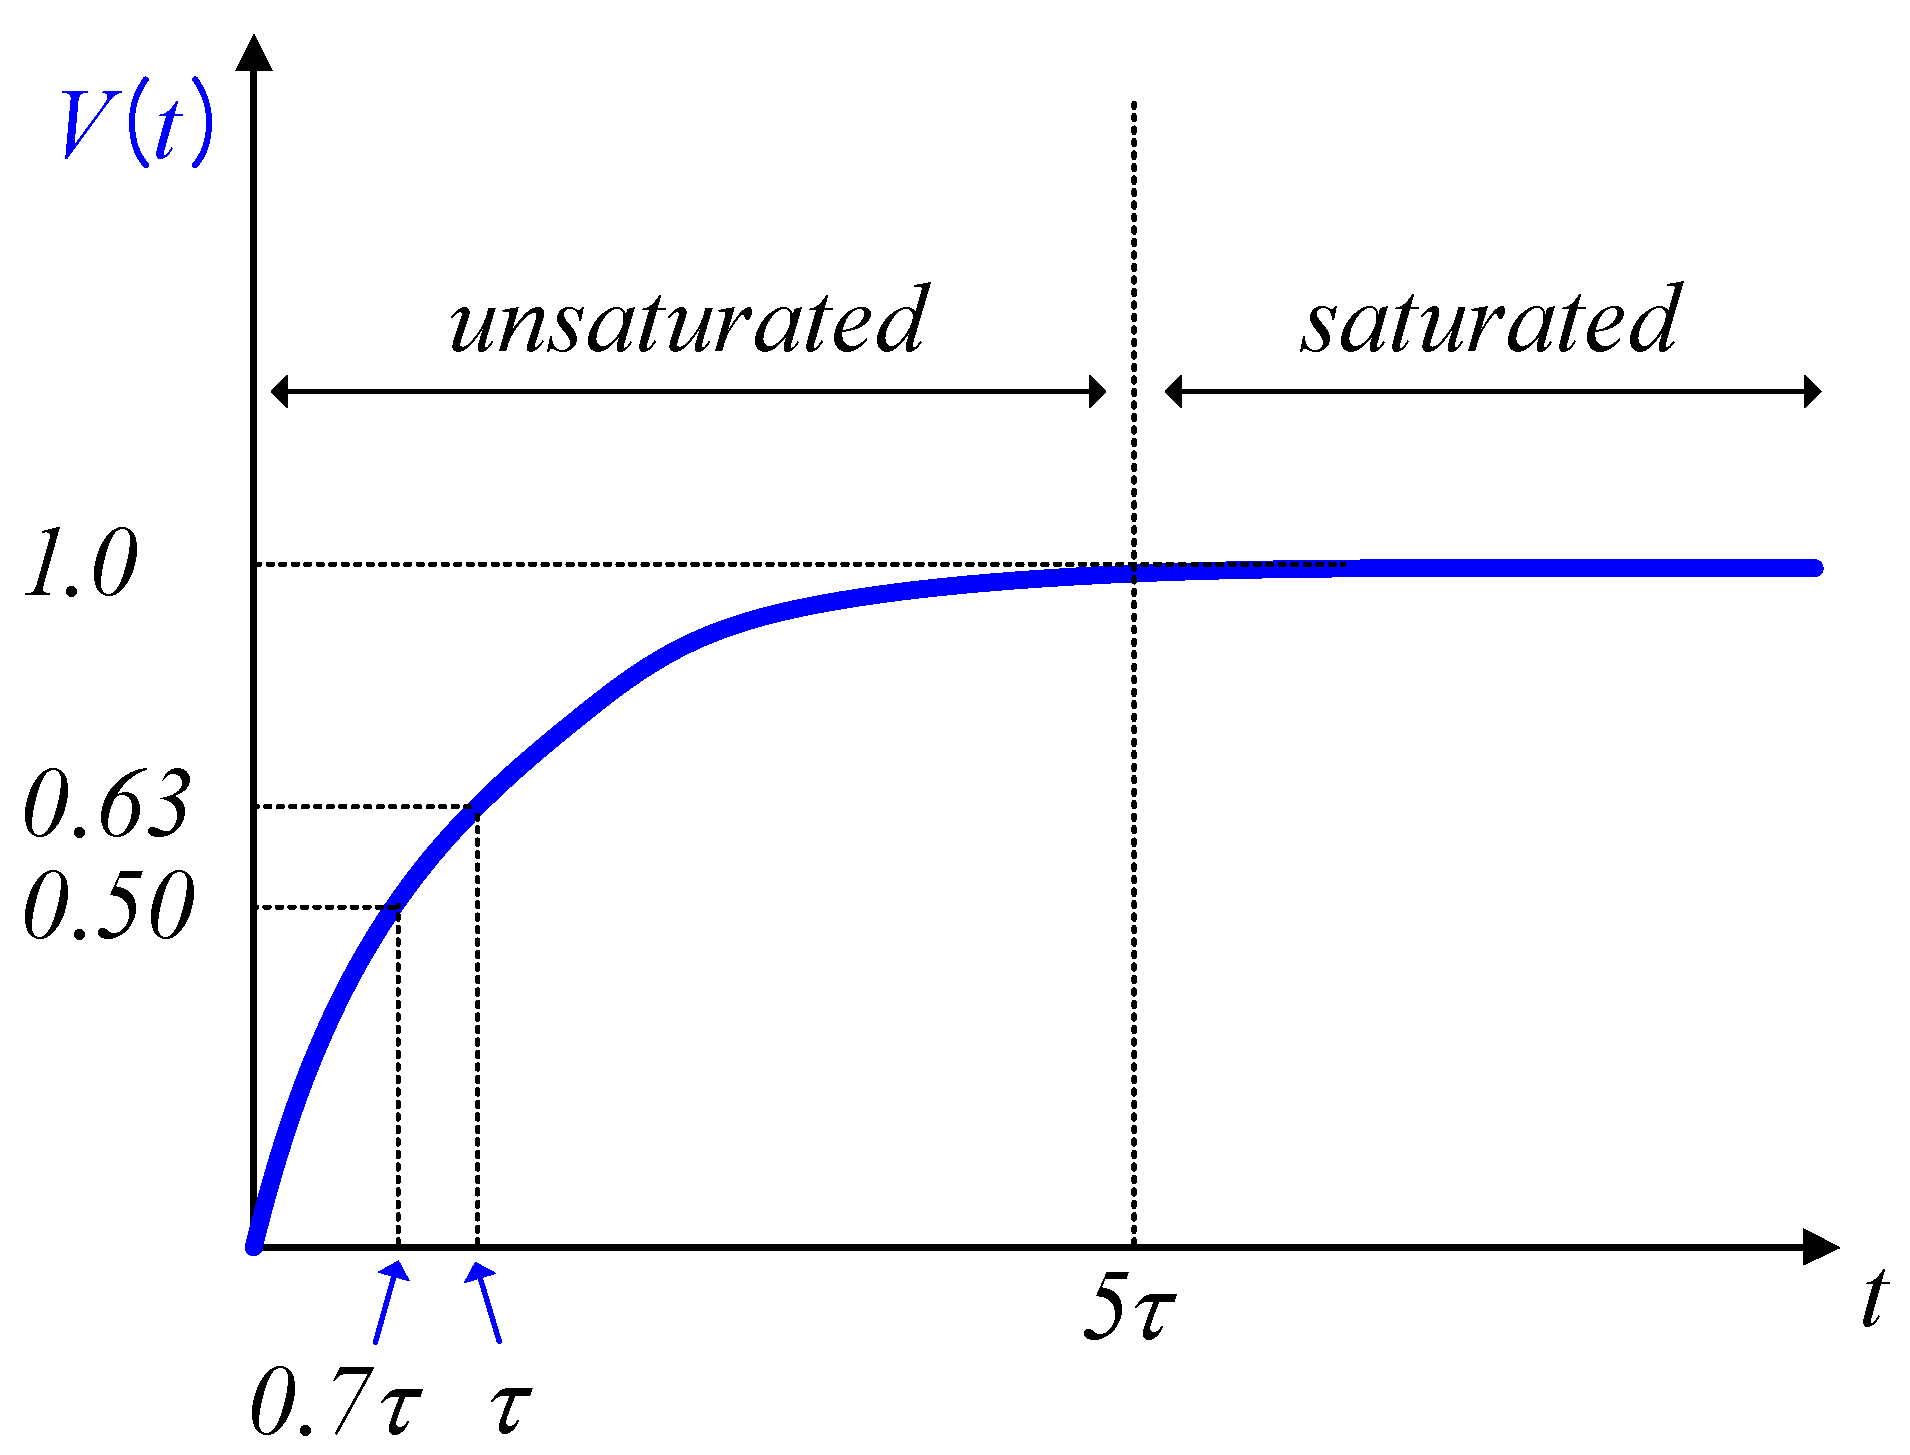
The next step involves a method for obtaining a double-layer capacitor ( C d l ) to express Equation (5). Before calculating C d l , it is necessary to consider the charging characteristics of the capacitor according to the time constant. The charging characteristic of the capacitor can be expressed as Figure 10 and Equation (8).
V ( t ) = 1 e t / τ i f t = 1 τ , V ( t ) = 1 e x = 0.63 i f t = 0.7 τ , V ( t ) = 1 e y = 0.50
The reason for considering the charging characteristics is to obtain C d l by acquiring the value before the electric double-layer capacitor is saturated and charged, unlike the existing method. This is because each commercial cell has different characteristics, so the time until saturation charge is also different.
For example, if you measure an arbitrary voltage at the point t x = τ o r 0.7 τ based on the charging characteristics, as shown in Figure 11, and obtain time t at that particular time, C d l can be obtained from this, as shown in Equation (9). Strictly speaking, time t x can be any value.
V E L @ 0.63 = 0.63 × ( V E L . M a x V E L . C T ) + V E L . C T = V E L . M a x 0.37 × ( V E L . M a x V E L . C T ) V E L @ 0.50 = 0.50 × ( V E L . M a x V E L . C T ) + V E L . C T = V E L . M a x 0.50 × ( V E L . M a x V E L . C T ) t = t @ 0.63 1 e x = 0.63 , x = 1 t @ 0.63 = τ = R a c t C d l C d l = τ R a c t t = t @ 0.50 1 e y = 0.50 , y = 0.7 t @ 0.50 = 0.7 τ = R a c t C d l C d l = 0.7 τ R a c t
After parameter identification, Equation (5) can be completed, and finally, similar results can be obtained, as shown in Figure 12, by comparisons with the experimental values. Additionally, Table 1 summarizes the values related to parameter identification. From Figure 12, it was confirmed that the experimental data values for the secondary transient voltage part were similar to the mathematical approximation obtained by parameter identification. Additionally, polynomials of the 3rd and 4th order were compared. It can be confirmed that there is sufficient similarity with the experimental values. Additionally, Figure 13 is a flow chart representing a simplified parameter identification process.
In Section 5, we conducted comparison verifications with experimental values using simulations. The next chapter will select the operating frequency from the Nyquist plot using the various parameters obtained via the parameter identification of the first-order RC model.

4. Selection of Operating Frequency

This section presents key points not only for pulsed water electrolysis but also for general DC water electrolysis. Electrochemical impedance spectroscopy (EIS) helps determine the characteristics of a cell. The data generated by the EIS device can be interpreted to distinguish the different components of the electrolyzer. However, although the EIS device itself is reliable, it can be cumbersome and requires paying a high cost. In this section, the complex impedance as a function of frequency from the transfer function on the equivalent circuit is displayed on the Nyquist plot to identify the characteristics of the cell. The obtained results determine the operating frequency during pulsed water electrolysis. A PEMEL Nyquist plot is shown in Figure 14. Moreover, Equation (10) shows the impedance equation of the equivalent circuit.
Z = R o h m + Z c t / ( 1 + Z c t C d l j ω ) , j = 1 Z c t = R a c t + σ / j ω
As can be seen from Figure 14a, the loss related to mass transfers has a dominant effect in the frequency region close to DC. From these results, water electrolysis using DC is not a good option in terms of efficiency. If you look at the Nyquist plot, it has a low capacitive impedance as a response to the low-frequency band at the point where it begins bending 45 degrees by the Warburg impedance. Moreover, the frequency at the point where mass transfer loss occurs, that is, the point at which 45-degree bending begins, is similar to the frequency at five times the time constant (=5 tau) obtained from the equivalent circuit. Therefore, it can be expected that improved hydrogen production compared with DC can be obtained by selecting the operating frequency during pulsed water electrolysis. The procedure for selecting the operating frequency is schematically illustrated in Figure 14b. (1) The capacitive impedance data value is first verified. The data values between 0.4 Hz and 4 Hz are selected. The frequency with the lowest capacitive impedance is selected. (2) Next, the resistive impedance data value is verified. As with capacitive impedance, data values between 0.4 Hz and 4 Hz are selected. The frequency with the lowest resistive impedance is selected. Multiple values can be selected depending on the resolution of the frequency. If the frequency is split more closely, multiple values can be selected, but that particular part is ignored in this procedure. Pulsed water electrolysis is then performed at this selected frequency.

5. Verification

In this section, the experimental and simulation environments were configured, as shown in Figure 15, to verify the production of hydrogen for the proposed parameter identification and operating frequency. Figure 15a shows a simplified diagram of a water electrolyzer. Moreover, Figure 15b shows the actual configuration of the water electrolysis device. The water electrolyzer consists of a control PC, PEM stack, heat exchanger, temperature controller, hydrogen metering device, power supply, water chiller, reservoir, and pump. In particular, a 400 W single stack was used for the PEM stack, and a TCGSS Bidirectional DC PSU model from Regatron AG was used for power. Finally, Figure 15c shows the electrical equivalent circuit modeling of PEMEL using simulation tools. In particular, the simulation used the PLECS developed by Plexim. Table 2 below shows the parameters related to the system’s configuration.
Figure 16 shows the parameter identification of the electric equivalent circuit by the proposed method. In particular, Figure 16a shows the values that were measured while verifying the proposed method in the actual experiment. Figure 16b shows the verification of the proposed method using simulations. The measured values are V E L . C T , t @ 0.63 , and V E L @ 0.63 . The measured values were 7.20 (V), 40 (ms), and 7.44 (V) for the experiment and 7.19 (V), 38 (ms), and 7.41 (V) for the simulation, respectively. Most of the measured values are similar.
Figure 17 is a waveform of pulsed water electrolysis using a fixed operating frequency. Experiments in pulsed water electrolysis require a closer look at the data values rather than the waveforms. 
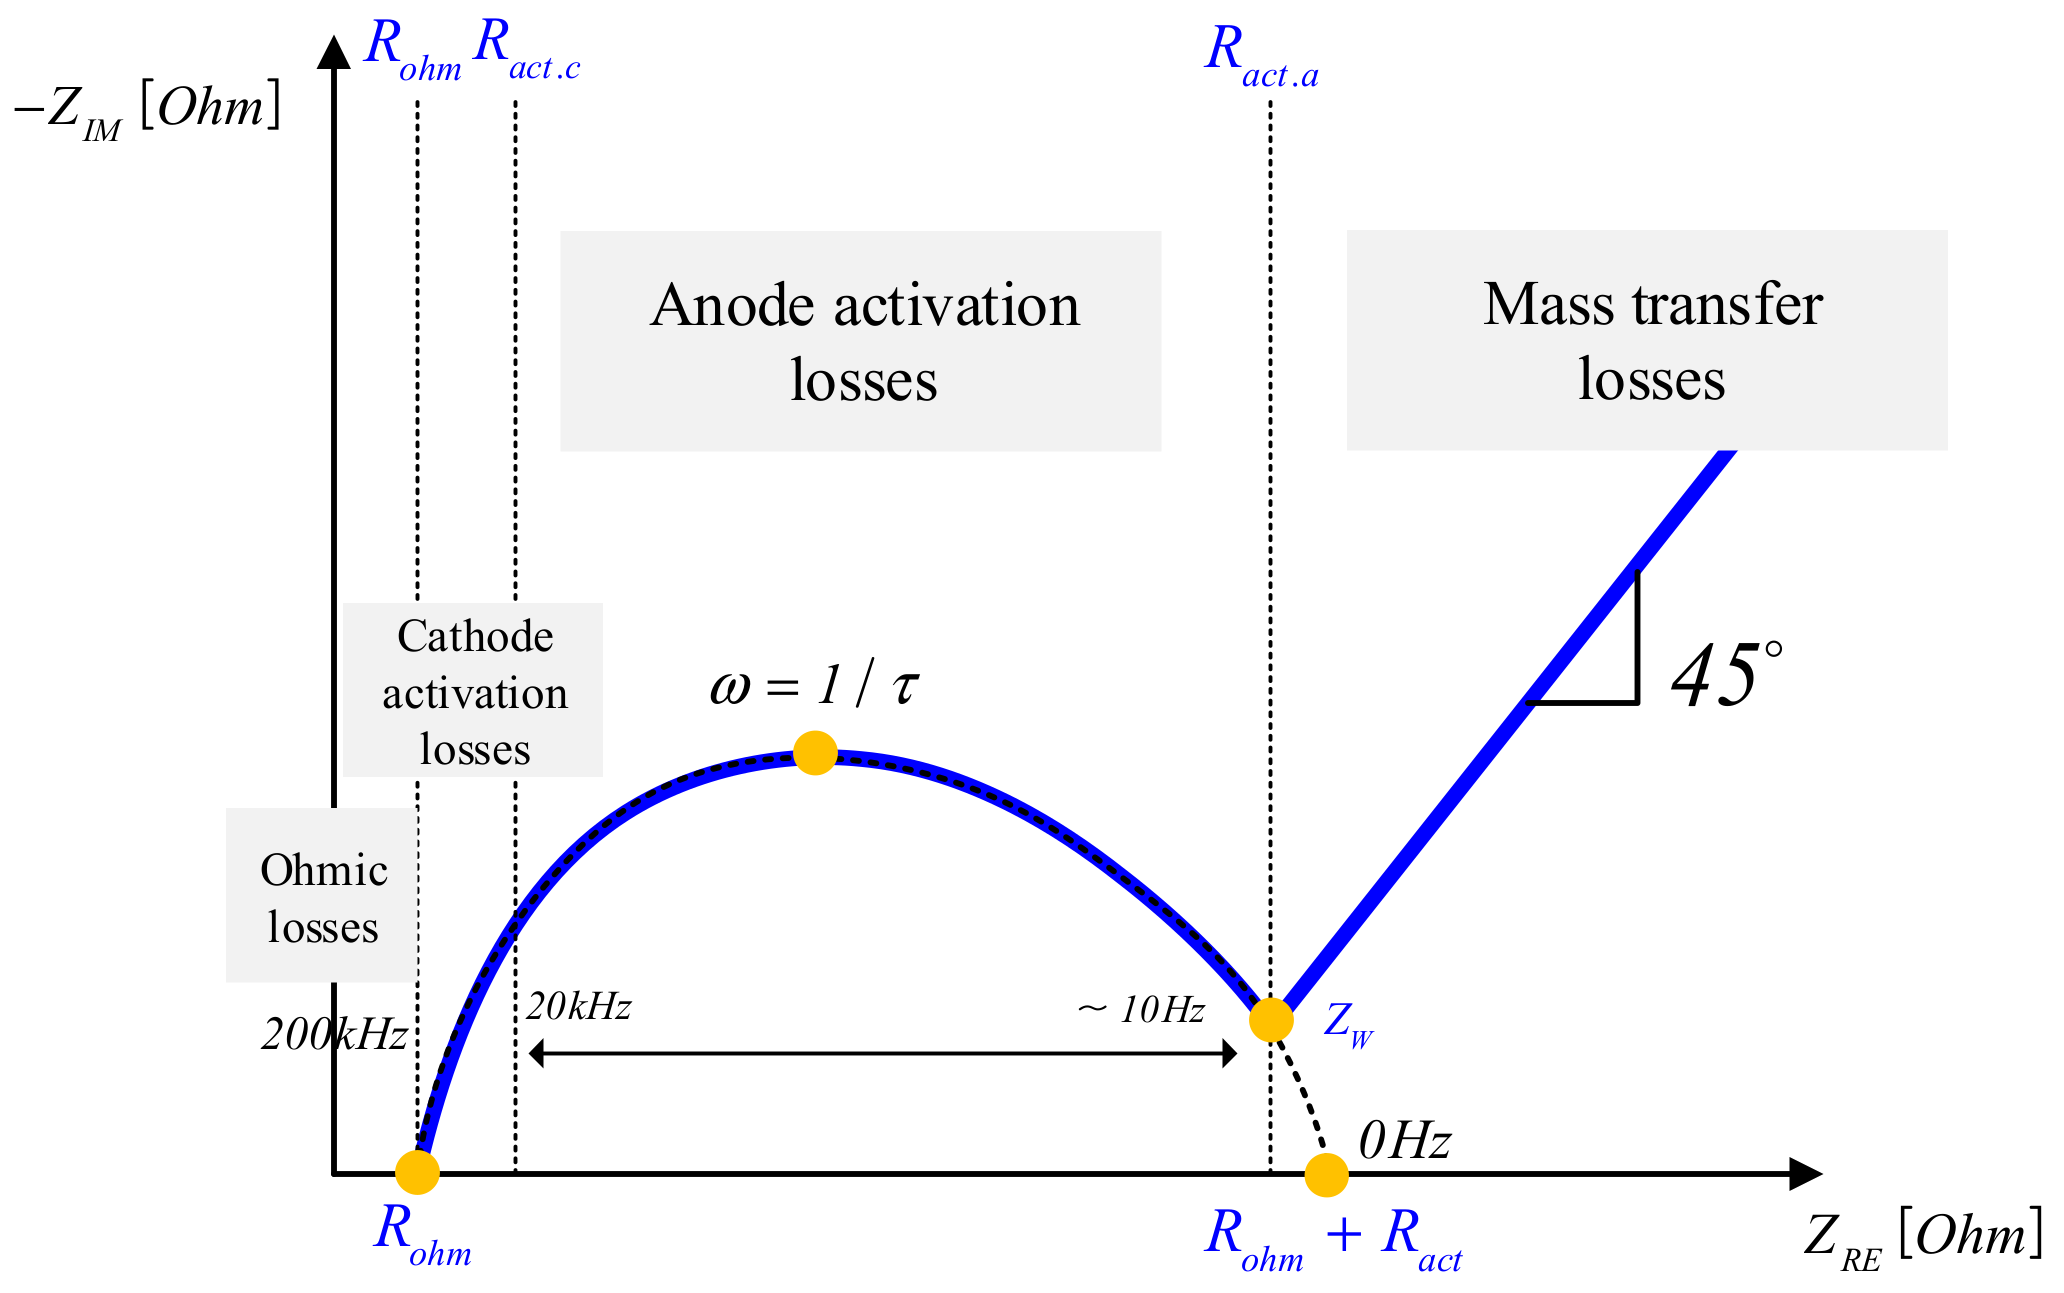
Table 3 shows the pulsed water electrolysis data values for a given operating frequency. Overall, it showed better results in terms of power and hydrogen production compared to DC, especially at a frequency of 0.8 Hz. Therefore, it seems that the operation’s frequency near the inflection point on the Nyquist plot showed better performance with respect to the amount of hydrogen generated. In addition, it was confirmed that the operating frequency at the inflection point where mass transfer loss occurs is similar to the frequency at five times the time constant (=5 tau), which is the time required for hydrogen ions to accumulate in the electric double-layer capacitor.
As an additional explanation for these results, as mentioned in Reference [17], a layer structure in which different charges are disposed of at the interface between the electrode and the electrolyte solution is called an electric double layer. A polarization layer is formed near the electrode’s surface and is separated from the existing electrolyte layer to render the charge of the ions present in the electrolyte electrically neutral. This double layer has a charge accumulation characteristic similar to that of a capacitor. Considering these characteristics from the perspective of an electrolytic cell, when a potential is applied to the electric double-layer capacitor, hydrogen ions accumulate on the metal plate. When voltage or current pulses are applied to the water electrolyzer, the thickness and diffusion rate of the diffusion layer of the electric double-layer capacitor can be affected, contributing to quicker hydrogen production. The time required for hydrogen ions to accumulate in the electric double-layer capacitor is theoretically and experimentally affected by the time constant. In particular, it is affected by the time corresponding to five times the time constant. Depending on whether or not the time required for accumulation is satisfied, the amount of hydrogen generated will show a difference. The frequency corresponding to five times the current time constant is 0.8 Hz. In fact, the difference in the amount of hydrogen production at 1 Hz close to this frequency is insignificant, but at 1.25 Hz, which indicates a slight lack of time required for accumulation, the amount of hydrogen production appears to be lower than at 0.8 Hz. However, the operation with the three operating frequencies presented in this paper shows improved hydrogen production performances compared to the operation with the existing DC current.

6. Conclusions

In this paper, a parameter identification method of the PEM electrolyzer electrical equivalent circuit for pulse electrolysis is proposed. The proposed method constructs an electrical equivalent circuit by simplifying the existing secondary RC model into a primary RC model by analyzing the transient cell voltage and by inputting the step current. The parameters were identified according to the electrical equivalent circuit’s configuration, and an appropriate operating frequency was calculated from the identified parameters. To verify the proposed parameter identification method, a simulation was constructed with the raw test data of a 400 W commercial PEM electrolyzer; moreover, the amount of produced hydrogen compared to DC was compared using a pulse electrolysis experiment at the operating frequency obtained from the identified parameters. Using the verification’s results, we felt that the parameter identification and operating frequency selection method for the water electrolysis system mainly operating with the DC current needed to provide good direction. In reality, forming a complete DC current in a water electrolyzer that is associated with a renewable energy system is not possible; thus, if there is a slight improvement in hydrogen production at lower frequencies, it is worth considering in the future.

Author Contributions

Conceptualization and investigation, J.-H.K. and T.-J.K.; methodology, J.-H.K., C.-Y.O. and K.-R.K.; software, J.-H.K., C.-Y.O. and K.-R.K.; validation and formal analysis, J.-H.K., C.-Y.O., K.-R.K., J.-P.L. and T.-J.K.; resources, J.-P.L. and T.-J.K.; data curation, J.-H.K., C.-Y.O. and K.-R.K.; writing—original draft preparation, J.-H.K.; writing—review and editing, J.-H.K., C.-Y.O., K.-R.K., J.-P.L. and T.-J.K.; visualization, J.-H.K., C.-Y.O. and K.-R.K.; supervision, T.-J.K.; project administration, T.-J.K.; funding acquisition, J.-P.L. and T.-J.K. All authors have read and agreed to the published version of the manuscript.

Funding

This research was supported by the Korea Electrotechnology Research Institute (KERI) Primary research program through the National Research Council of Science & Technology (NST) funded by the Ministry of Science and ICT (MSIT) (No. 22A01012).

Institutional Review Board Statement

Not applicable.

Informed Consent Statement

Not applicable.

Data Availability Statement

Not applicable.

Conflicts of Interest

The authors declare no conflict of interest.

References

  1. Turner, J.; Sverdrup, G.; Mann, M.K.; Maness, P.-C.; Kroposki, B.; Ghirardi, M.; Evans, R.J.; Dan, B. Renewable hydrogen production. Int. J. Energy Res. 2008, 32, 379–407. [Google Scholar] [CrossRef] [Green Version]
  2. Nikolaidis, P.; Poullikkas, A. A comparative overview of hydrogen production processes. Renew. Sustain. Energy Rev. 2017, 67, 597–611. [Google Scholar] [CrossRef]
  3. Kumar, S.S.; Himabindu, V. Hydrogen production by PEM water electrolysis—A review. Mater. Sci. Energy Technol. 2019, 2, 442–454. [Google Scholar]
  4. Manea, D.; Al-Hasnawi, H. Experimental Study of Wave Shape and Frequency of the Power Supply on the Energy Efficiency of Hydrogen Production by Water Electrolysis. Int. J. Innov. Res. Sci. Eng. Tech. 2015, 4, 12239–12250. [Google Scholar]
  5. Carmo, M.; Fritz, D.L.; Mergel, J.; Stolten, D. A comprehensive review on PEM water electrolysis. Int. J. Hydrog. Energy 2013, 38, 4901–4934. [Google Scholar] [CrossRef]
  6. Espinosa-López, M.; Darras, C.; Poggi, P.; Glises, R.; Baucour, P.; Rakotondrainibe, A.; Besse, S.; Serre-Combe, P. Modelling and experimental validation of a 46 kW PEM high pressure water electrolyzer. Renew. Energy 2018, 119, 160–173. [Google Scholar] [CrossRef]
  7. Rahim, A.A.; Tijani, A.S.; Kamarudin, S.; Hanapi, S. An overview of polymer electrolyte membrane electrolyzer for hydrogen production: Modeling and mass transport. J. Power Sources 2016, 309, 56–65. [Google Scholar] [CrossRef]
  8. Bing-Ang, M.; Obaidallah, M.; Jonathan, L.; Laurent, P. Physical Interpretations of Nyquist Plots for EDLC Electrodes and Devices. J. Phys. Chem. 2018, 122, 194–206. [Google Scholar]
  9. Choi, W.; Shin, H.-C.; Kim, J.M.; Choi, J.-Y.; Yoon, W.-S. Modeling and Applications of Electrochemical Impedance Spectroscopy (EIS) for Lithium-ion Batteries. J. Electrochem. Sci. Technol. 2020, 11, 1–13. [Google Scholar] [CrossRef] [Green Version]
  10. Guilbert, D.; Vitale, G. Dynamic Emulation of a PEM Electrolyzer by Time Constant Based Exponential Model. Energies 2019, 12, 750. [Google Scholar] [CrossRef] [Green Version]
  11. Lin, M.-Y.; Hourng, L.-W. Effects of magnetic field and pulse potential on hydrogen production via water electrolysis. Int. J. Energy Res. 2013, 38, 106–116. [Google Scholar] [CrossRef]
  12. Nation, D.; Smith, K. Modelling the Dynamics of a Polymer Electrolyte Membrane (PEM) Electrolyser at Start-Up, Caribbean Annals; Northern Caribbean University: Mandeville, Jamaica, 2016; pp. 1–23. [Google Scholar]
  13. Ursúa, A.; Sanchis, P. Static-dynamic modelling of the electrical behaviour of a commercial advanced alkaline water electrolyser. Int. J. Hydrog. Energy 2012, 37, 18598–18614. [Google Scholar] [CrossRef]
  14. Hernández-Gómez, Á.; Ramirez, V.; Guilbert, D.; Saldivar, B. Development of an adaptive static-dynamic electrical model based on input electrical energy for PEM water electrolysis. Int. J. Hydrog. Energy 2020, 45, 18817–18830. [Google Scholar] [CrossRef]
  15. Yodwong, B.; Guilbert, D.; Hinaje, M.; Phattanasak, M.; Kaewmanee, W.; Vitale, G. Proton Exchange Membrane Electrolyzer Emulator for Power Electronics Testing Applications. Processes 2021, 9, 498. [Google Scholar] [CrossRef]
  16. Gambou, F.; Guilbert, D.; Zasadzinski, M.; Rafaralahy, H. A Comprehensive Survey of Alkaline Electrolyzer Modeling: Electrical Domain and Specific Electrolyte Conductivity. Energies 2022, 15, 3452. [Google Scholar] [CrossRef]
  17. Kim, J.-H.; Oh, C.-Y.; Kim, K.-R.; Lee, J.-P.; Kim, T.-J. Electrical Double Layer Mechanism Analysis of PEM Water Electrolysis for Frequency Limitation of Pulsed Currents. Energies 2021, 14, 7822. [Google Scholar] [CrossRef]
Figure 1. Conventional electrical equivalent circuit.
Energies 15 09303 g001
Figure 2. PEM cell voltage transient characteristics.
Energies 15 09303 g002
Figure 3. Nyquist plot of a PEM MEA electrical equivalent circuit model.
Energies 15 09303 g003
Figure 4. Electrical equivalent circuit considering the secondary transient state.
Energies 15 09303 g004
Figure 5. Nyquist plot of PEM MEA electrical equivalent circuit considering the secondary transient state.
Energies 15 09303 g005
Figure 6. PEMEL electrical equivalent circuit considering the Warburg impedance.
Energies 15 09303 g006
Figure 7. I-V characteristic curve of a 400 W class commercial PEMEL.
Energies 15 09303 g007
Figure 8. Electrolyzer voltage according to current step input.
Energies 15 09303 g008
Figure 9. Data class diagram of PEMEL for parameter identification.
Energies 15 09303 g009
Figure 10. Capacitor charging characteristics.
Energies 15 09303 g010
Figure 11. PEMEL cell voltage based on charging characteristics.
Energies 15 09303 g011
Figure 12. Similarities between the mathematical approximation formula and experimental value.
Energies 15 09303 g012
Figure 13. Simplified parameter identification process flow chart.
Energies 15 09303 g013
Figure 14. Nyquist plot of the electrical equivalent circuit (a) Nyquist plot of PEMEL, (b) operating frequency selection.
Energies 15 09303 g014aEnergies 15 09303 g014b
Figure 15. A 400 W class commercial PEMEL system configuration (a) simplified diagram, (b) actual configuration, and (c) electrical equivalent circuit modeling.
Energies 15 09303 g015
Figure 16. Parameter identification using the proposed method (a) actual experiment, and (b) simulation.
Energies 15 09303 g016
Figure 17. Experimental results of pulse water electrolysis (a) 0.8 Hz, (b) 1 Hz, (c) 1.25 Hz.
Energies 15 09303 g017
Table 1. Electric modeling parameters.
ParameterValue
R t o t 0.044 (Ω)
E c e l l 5.9862 (V)
Current step input25 (A) → 35 (A)
Output voltage7.08 (V) → 7.52 (V)
V E L . C T 7.19 (V)
t @ 0.63 / V E L @ 0.63 38 (ms)/7.41 (V)
R o h m 0.011 (Ω)
R a c t 0.033 (Ω)
C d l 1.1212 (F)
Table 2. System specifications.
ParameterValue
Cell diameter8 (cm)
Single cell area50.265 (cm2)
Single stack area201.061 (cm2)
Rated voltage10 (V)
Rated current40 (A)
Hydrogen production1 (LPM)
Operating temperature45 (°C)
DC offset current30 (A)
Duty ratio50 (%)
Pulse frequency0.8/1/1.25 (Hz)
Table 3. A PEM electrolysis experimental result data (CC Mode).
Frequency (Hz)Voltage (V)Current (A)Power (W)H2 (LPM)
0.0 (DC)9.33529.724277.5850.975
0.89.069 (−2.85%)29.812 (+0.30%)270.365 (−2.60%)0.987 (+1.23%)
1.09.202 (−1.42%)29.813 (+0.30%)274.339 (−1.17%)0.987 (+1.23%)
1.259.121 (−2.29%)29.825 (+0.34%)272.033 (−2.00%)0.985 (+1.03%)
Publisher’s Note: MDPI stays neutral with regard to jurisdictional claims in published maps and institutional affiliations.

