
Effect of Light Treatment and Maturity Stage on Biomass Production and Bioactive Compounds of Two Pepper Cultivars under a Deep Water Culture Hydroponic System

Abstract
:1. Introduction
2. Materials and Methods
2.1. Experimental Design, Plant Material, Hydroponic System, Nutrient Supply and Fruit Maturity Stage
2.2. Biomass Determination with Water Use Efficiency
2.3. Analytical Assays of Bioactive Compounds
2.3.1. Vitamin C Determined by the α-α′ Dipyridyl Method
2.3.2. Total Flavonoid Content Determined by Spectrophotometric Method
2.3.3. Antioxidant Capacity Determined by FRAP Method
2.3.4. Total Polyphenol Content—TPC
2.4. Statistical Analysis
3. Results
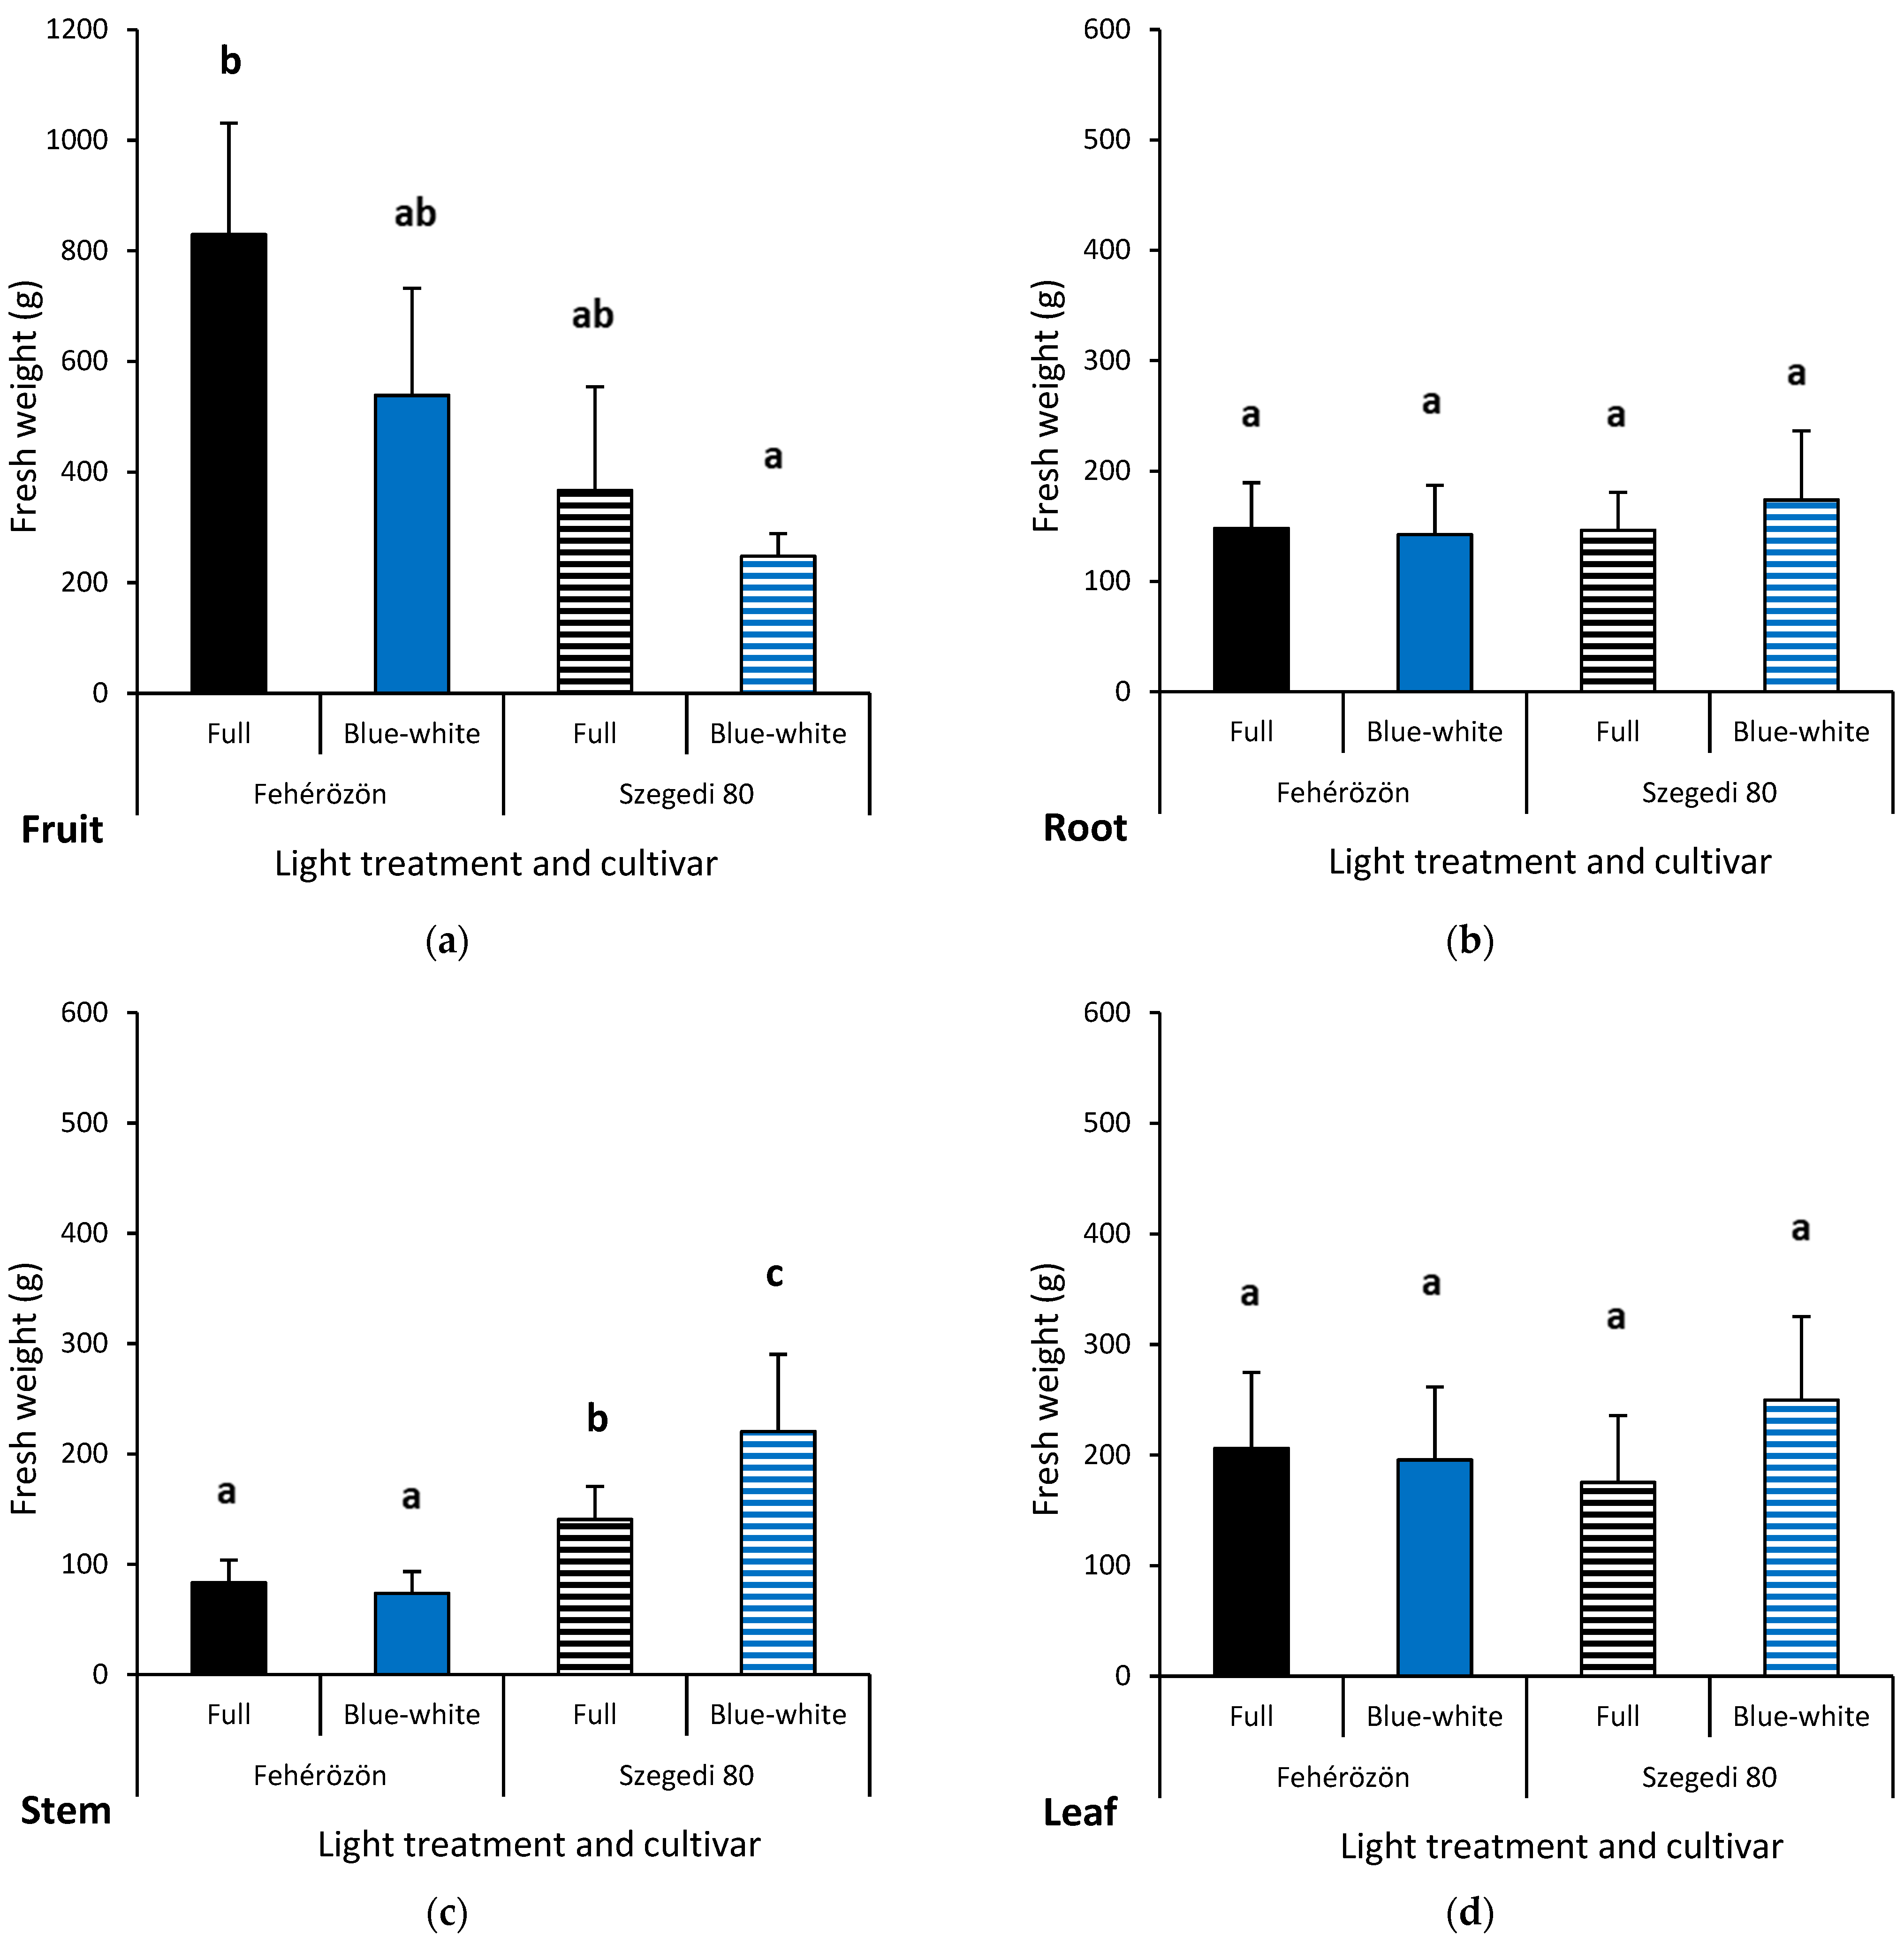
3.1. Effect of Light and Cultivar on Biomass of Fruit, Root, Stem and Leaf
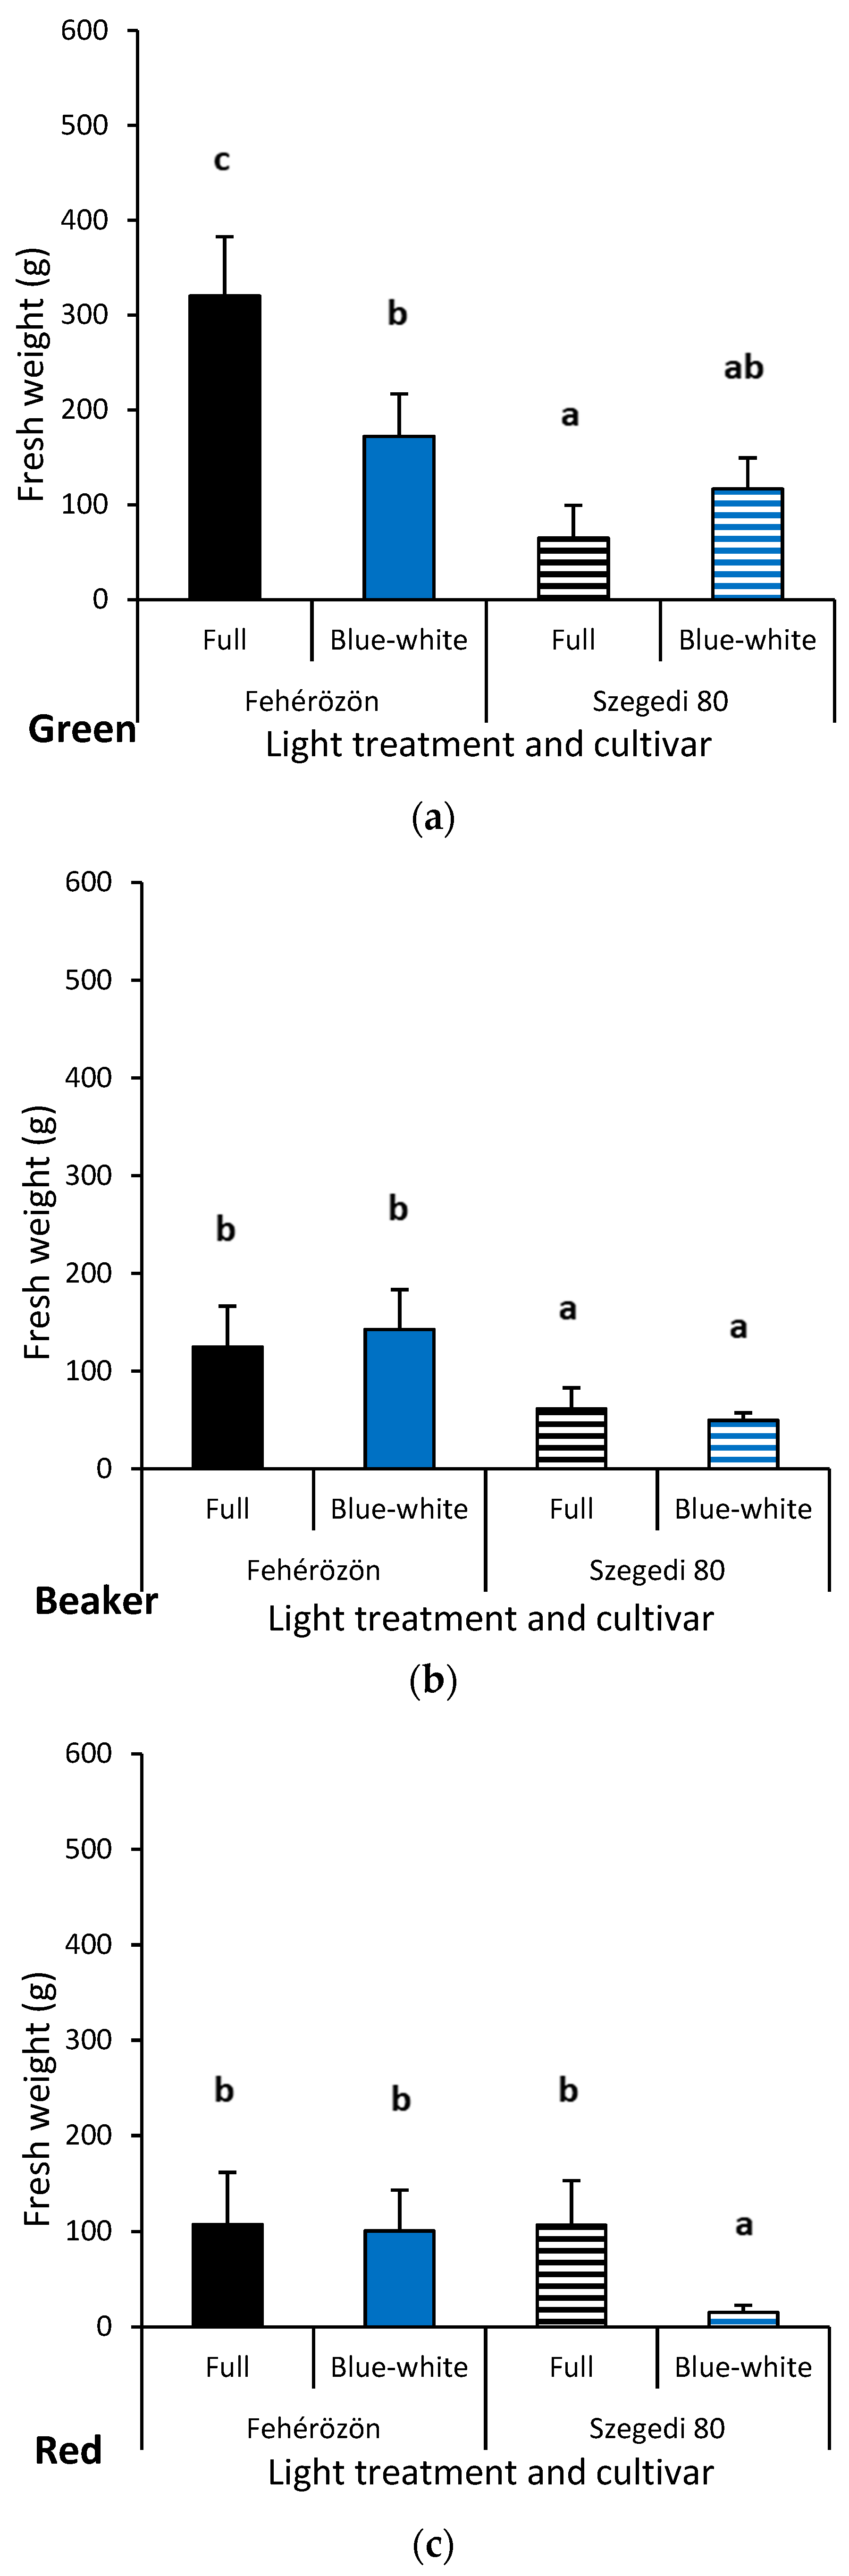
3.2. Effect of Light, Cultivar and Maturity on Fruit Biomass
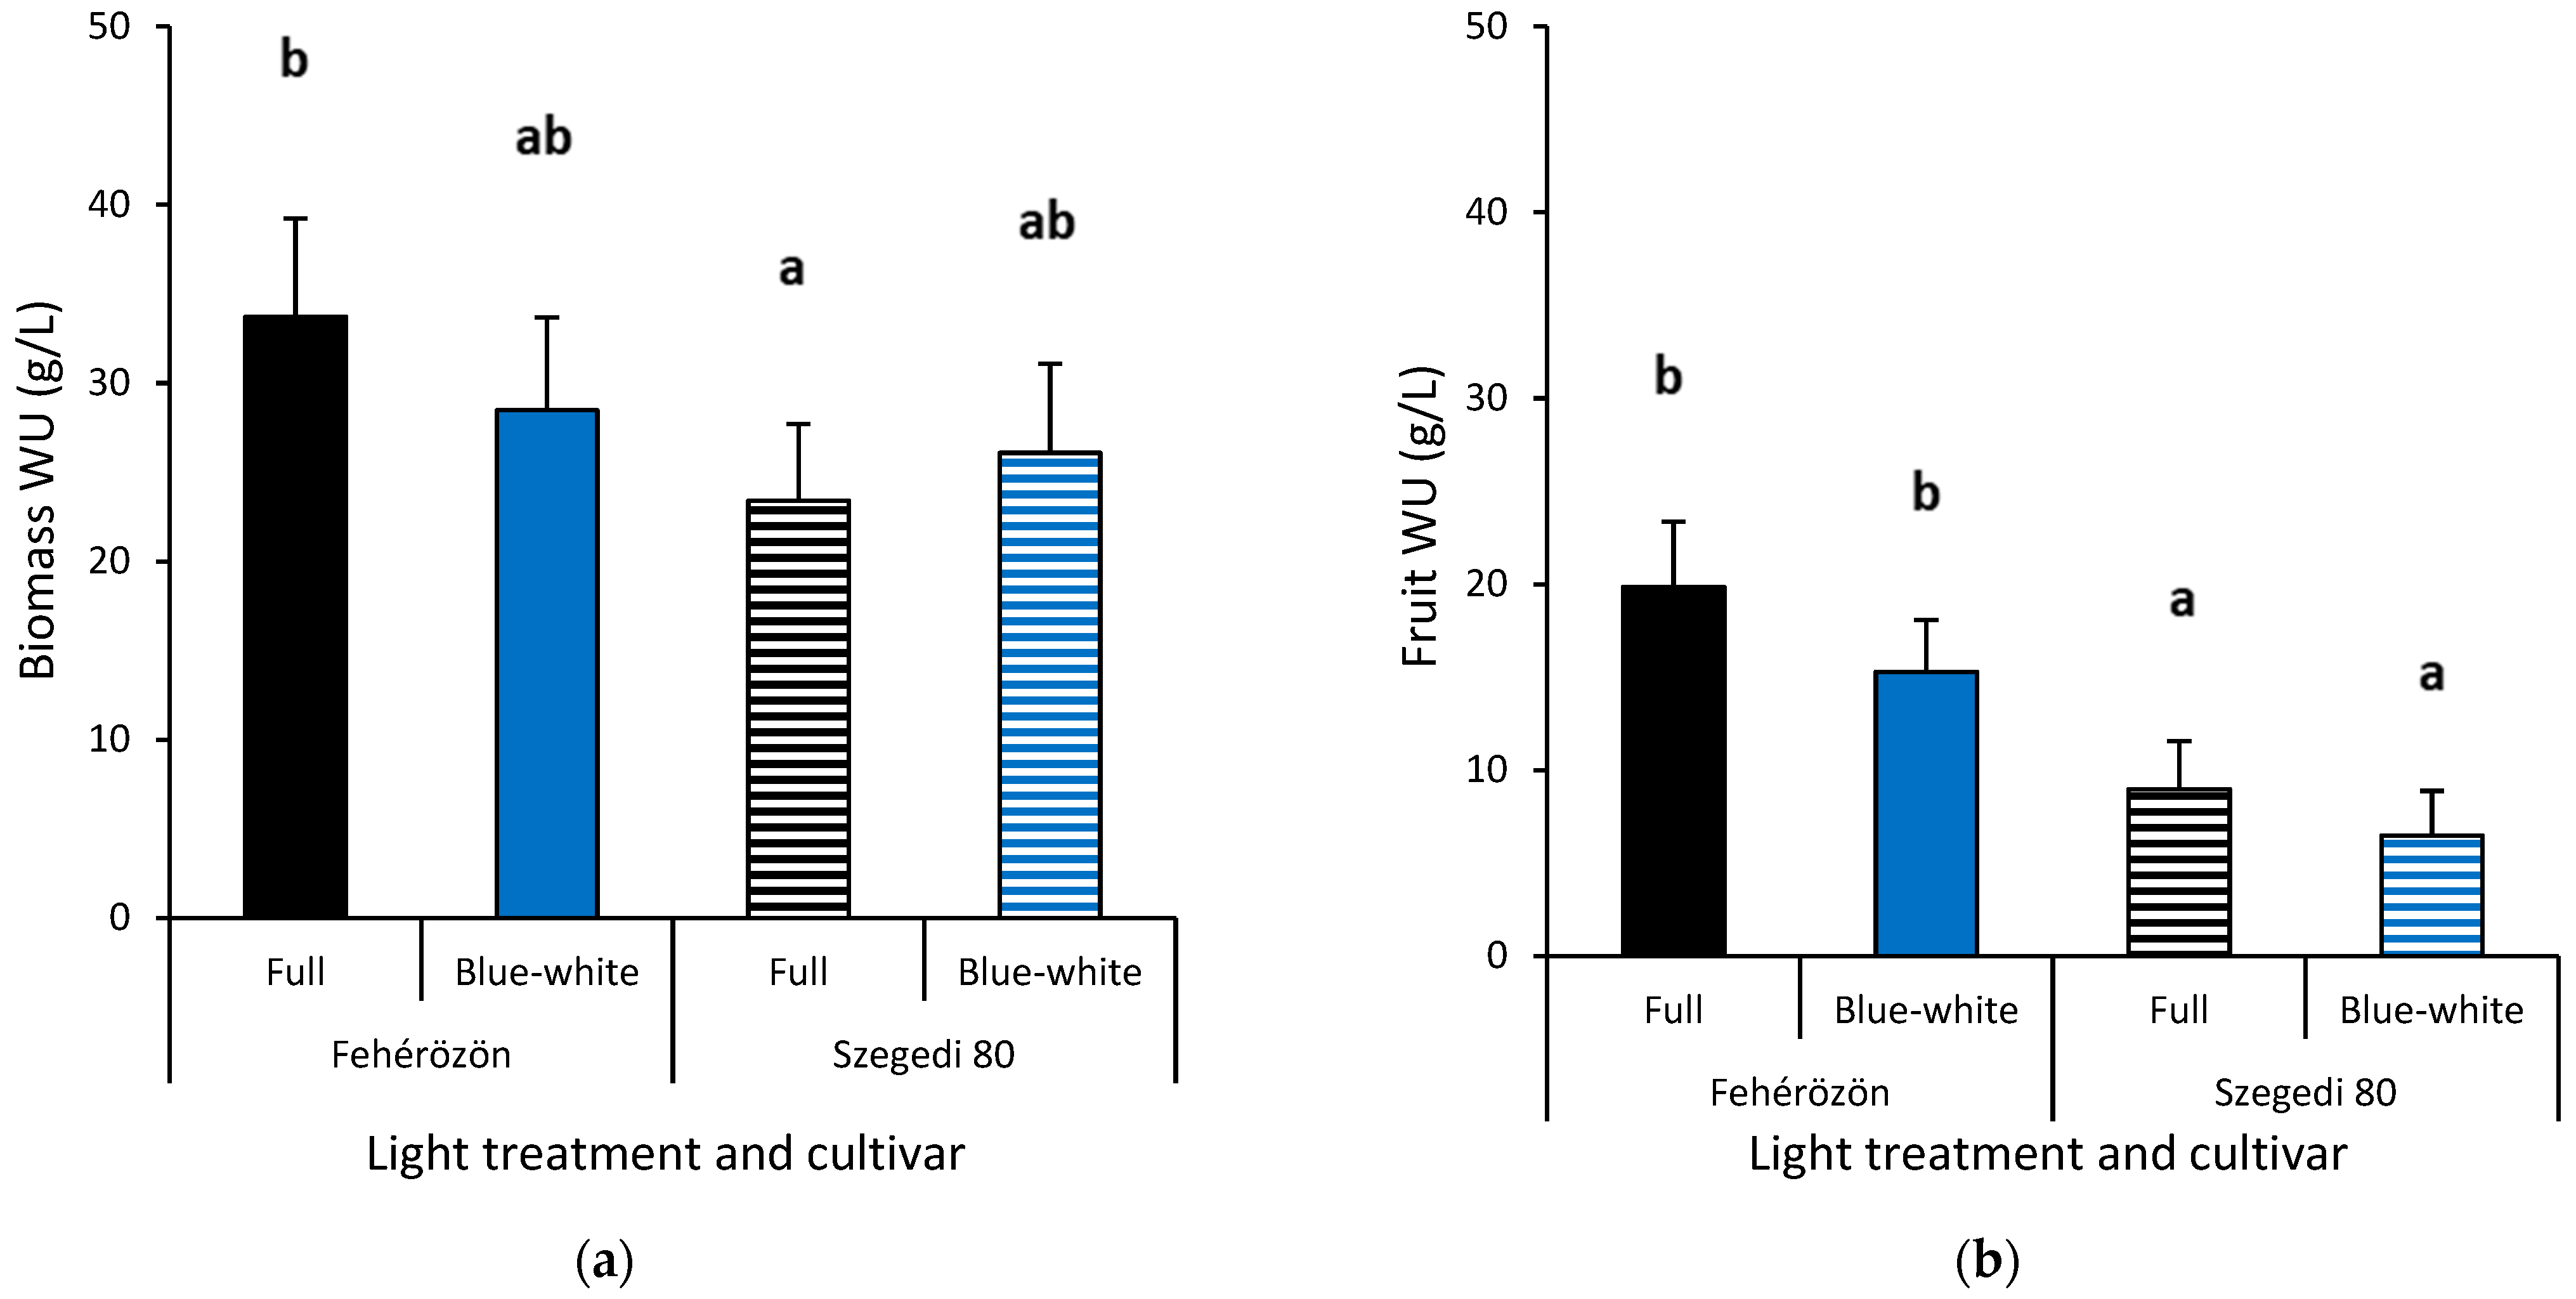
3.3. Water Use for Total and Fruit Biomass
3.4. Vitamin C
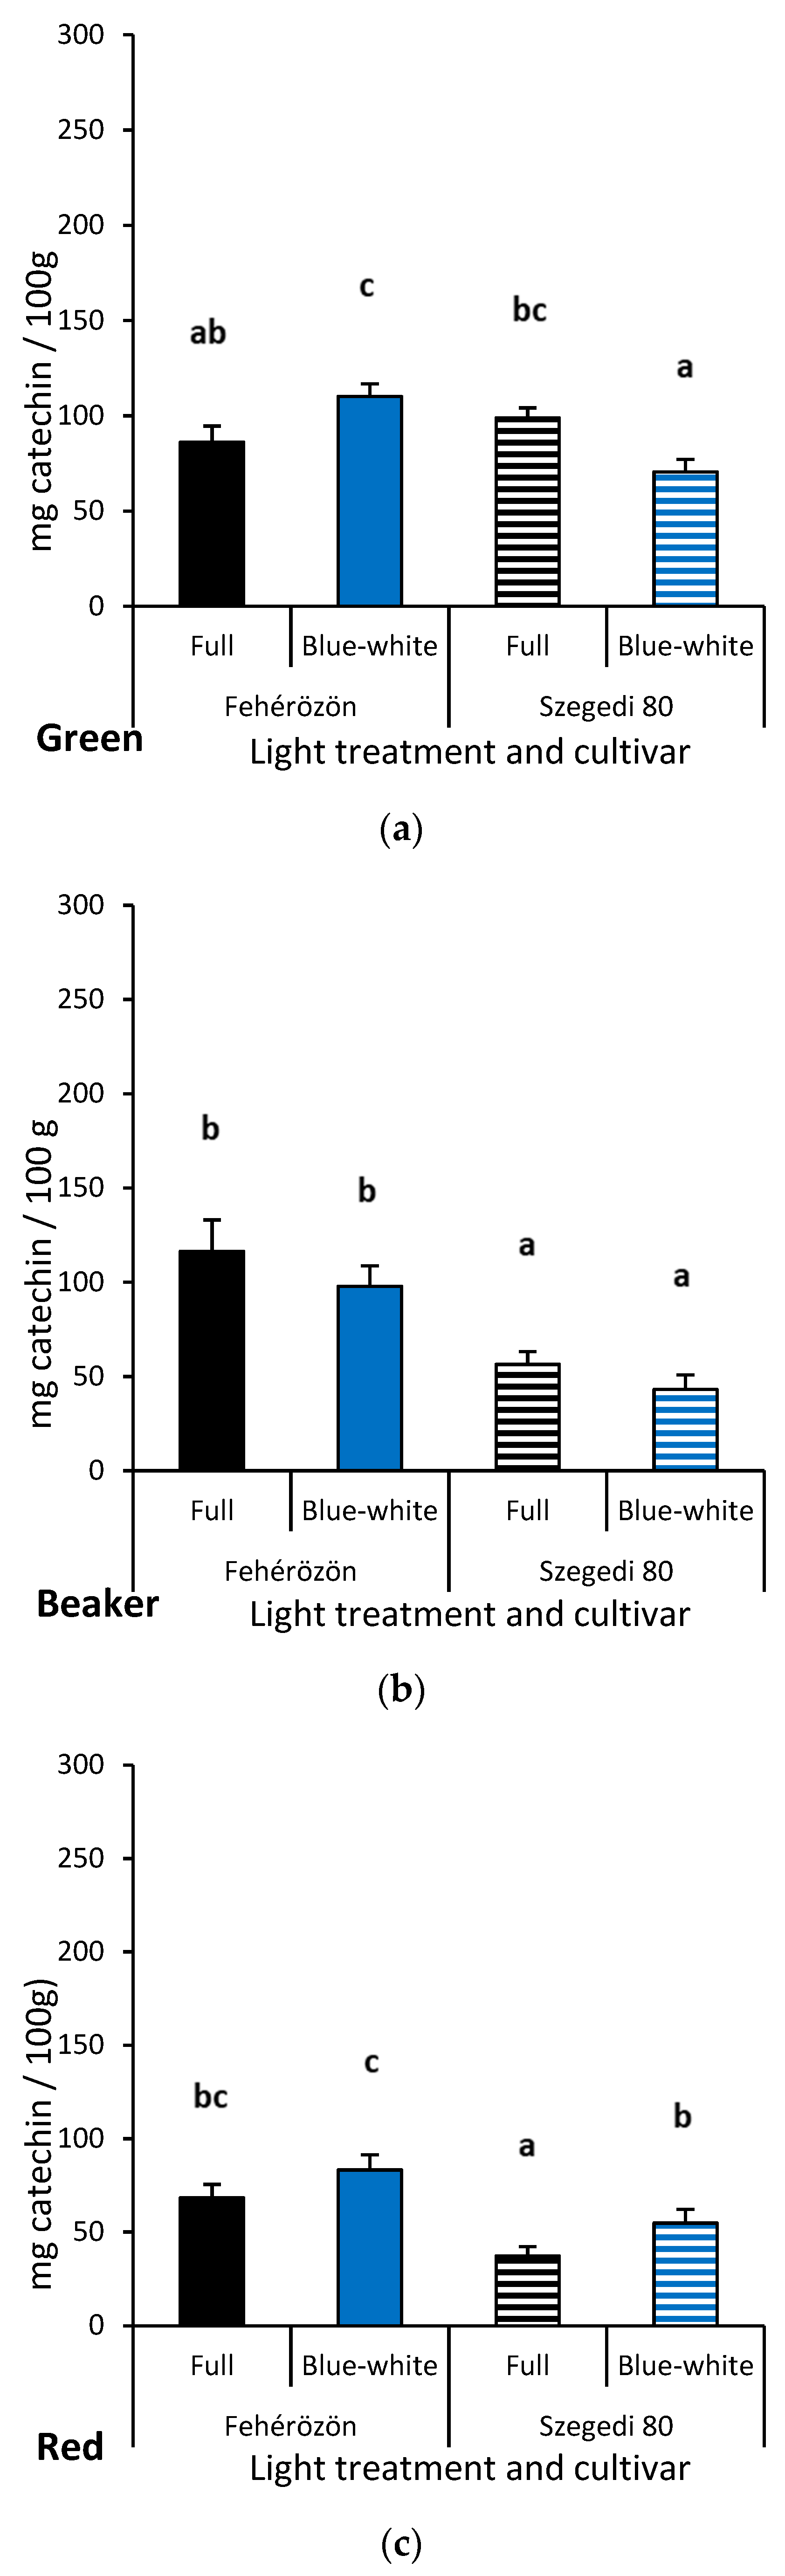
3.5. Flavonoid
3.6. AC-FRAP
3.7. TPC
3.8. Correlation among Parameters
4. Discussion
4.1. Light and Cultivar Effect on Plant Parts, Fruit Yield and Maturity Stages
4.2. Bioactive Compounds: Vitamin-C, Flavonoid, AC-FRAP and TPC
5. Conclusions
Author Contributions
Funding
Institutional Review Board Statement
Informed Consent Statement
Data Availability Statement
Conflicts of Interest
References
- Pickersgill, B. Genetic resources and breeding of Capsicum spp. Euphytica 1997, 96, 129–133. [Google Scholar] [CrossRef]
- Bosland, P.; Votava, E. Peppers: Vegetable and Spice Capsicums; CAB International Publishing: Wallingford, CT, USA, 2000; pp. 204–231. [Google Scholar]
- Farhad, M.; Kailasapathy, K.; Tamang, J.P. Health aspects of fermented foods. In Fermented Foods and Beverages of the World; Tamang, J.P., Kailasapathy, K., Eds.; CRC Press: Boca Raton, FL, USA, 2021; pp. 391–414. [Google Scholar]
- KSH-Hungarian Central Statistical Office. Data resources. Available online: https://www.ksh.hu/stadat (accessed on 11 July 2023).
- Schnitzler, W.; Sharma, A.; Gruda, N.; Heuberger, H. A low-tech hydroponic system for bell pepper (Capsicum annuum L.) production. Int. Symp. Grow. Media Hydroponics 2001, 644, 47–53. [Google Scholar] [CrossRef]
- Silber, A.; Bruner, M.; Kenig, E.; Reshef, G.; Zohar, H.; Posalski, I.; Yehezkel, H.; Shmuel, D.; Cohen, S.; Dinar, M. High fertigation frequency and phosphorus level: Effects on summer-grown bell pepper growth and blossom-end rot incidence. Plant Soil 2005, 270, 135–146. [Google Scholar]
- Son, J.E.; Kim, H.J.; Ahn, T.I. Hydroponic systems. In Plant Factory: An Indoor Vertical Farming System for Efficient Quality Food Production, 2nd ed.; Kozai, T., Niu, G., Takagaki, M., Eds.; Academic Press: Cambridge, MA, USA, 2020; pp. 273–283. [Google Scholar]
- Albaho, M.; Thomas, B.; Christopher, A. Evaluation of hydroponic techniques on growth and productivity of greenhouse grown bell pepper and strawberry. Int. J. Vegetable Sci. 2008, 14, 23–40. [Google Scholar]
- Savvas, D.; Stamati, E.; Tsirogiannis, I.L.; Mantzos, N.; Barouchas, P.E.; Katsoulas, N.; Kittas, C. Interactions between salinity and irrigation frequency in greenhouse pepper grown in closed-cycle hydroponic systems. Agric. Water Manag. 2007, 91, 102–111. [Google Scholar]
- Sharma, N.; Acharya, S.; Kumar, K.; Singh, N.; Chaurasia, O.P. Hydroponics as an advanced technique for vegetable production: An overview. J. Soil Water Conserv. 2018, 17, 364–371. [Google Scholar]
- Bione, M.A.A.; Soares, T.M.; Cova, A.M.W.; da Silva Paz, V.P.; Gheyi, H.R.; Rafael, M.R.S.; das Neves, B.S.L. Hydroponic production of ‘Biquinho’ pepper with brackish water. Agric. Water Manag. 2021, 245, 106607. [Google Scholar]
- Massa, D.; Magán, J.J.; Montesano, F.F.; Tzortzakis, N. Minimizing water and nutrient losses from soilless cropping in southern Europe. Agric. Water Manag. 2020, 241, 106395. [Google Scholar]
- Singh, H.; Dunn, B.L.; Payton, M.; Brandenberger, L. Selection of fertilizer and cultivar of sweet pepper and eggplant for hydroponic production. Agronomy 2019, 9, 433. [Google Scholar] [CrossRef]
- Al Murad, M.; Razi, K.; Jeong, B.R.; Samy, P.M.A.; Muneer, S. Light emitting diodes (LEDs) as agricultural lighting: Impact and its potential on improving physiology, flowering, and secondary metabolites of crops. Sustainability 2021, 13, 1985. [Google Scholar]
- Trivellini, A.; Toscano, S.; Romano, D.; Ferrante, A. The role of blue and red light in the orchestration of secondary metabolites, nutrient transport and plant quality. Plants 2023, 12, 2026. [Google Scholar] [PubMed]
- Javanmardi, J.; Emami, S. Response of tomato and pepper transplants to light spectra provided by light emitting diodes. Int. J. Veg. Sci. 2013, 19, 138–149. [Google Scholar]
- Murakami, K.; Matsuda, R.; Fujiwara, K. Effects of supplemental lighting to a lower leaf using light-emitting diodes with different spectra on the leaf photosynthetic rate in sweet pepper. J. Agric. Meteorol. 2013, 69, 55–63. [Google Scholar] [CrossRef]
- Claypool, N.B.; Lieth, J.H. Physiological responses of pepper seedlings to various ratios of blue, green, and red light using LED lamps. Sci. Hortic. 2020, 268, 109371. [Google Scholar]
- Li, Y.; Xin, G.; Shi, Q.; Yang, F.; Wei, M. Response of photomorphogenesis and photosynthetic properties of sweet pepper seedlings exposed to mixed red and blue light. Front. Plant Sci. 2023, 13, 984051. [Google Scholar] [PubMed]
- Kim, D.; Son, J.E. Adding far-red to red, blue supplemental light-emitting diode interlighting improved sweet pepper yield but attenuated carotenoid content. Front. Plant Sci. 2022, 13, 938199. [Google Scholar]
- Kim, D.; Ra, I.; Son, J.E. Fruit quality and volatile compounds of greenhouse sweet peppers as affected by the LED spectrum of supplementary interlighting. J. Sci. Food Agric. 2023, 103, 2593–2601. [Google Scholar]
- Yap, E.S.P.; Uthairatanakij, A.; Laohakunjit, N.; Jitareerat, P.; Vaswani, A.; Magana, A.A.; Morre, J.; Maier, C.S. Plant growth and metabolic changes in ‘Super Hot’chili fruit (Capsicum annuum) exposed to supplemental LED lights. Plant Sci. 2021, 305, 110826. [Google Scholar]
- Kim, Y.; Bae, J.; Park, M. Effects of supplemental lighting on growth and yield of sweet pepper (Capsicum annuum L.) in hydroponic culture under low levels of natural light in winter. Korean J. Hortic. Sci. Technol. 2011, 29, 317–325. [Google Scholar]
- Sobczak, A.; Kowalczyk, K.; Gajc-Wolska, J.; Kowalczyk, W.; Niedzińska, M. Growth, yield and quality of sweet pepper fruits fertilized with polyphosphates in hydroponic cultivation with LED lighting. Agronomy 2020, 10, 1560. [Google Scholar] [CrossRef]
- Yoon, S.; Kim, J.H.; Hwang, I.; Kim, D.; Shin, J.; Son, J.E. Effect of stem number on growth, fruit quality, and yield of sweet peppers grown in greenhouses under supplemental lighting with high pressure sodium lamps in winter. J. Bio-Environ. Control 2021, 30, 237–243. [Google Scholar]
- Azad, M.O.K.; Chun, I.-J.; Jeong, J.-H.; Kwon, S.-T.; Hwang, J.-M. Response of the growth characteristics and phytochemical contents of pepper (Capsicum annuum L.) seedlings with supplemental LED light in a glass house. J. Bio-Environ. Control 2011, 20, 182–188. [Google Scholar]
- Bae, J.H.; Park, Y.J.; Namiesnik, J.; Gülçin, I.; Kim, T.C.; Kim, H.C.; Heo, B.G.; Gorinstein, S.; Ku, Y.G. Effects of artificial lighting on the bioactivity of sweet red pepper (Capsicum annuum L.). Int. J. Food Sci. Technol. 2016, 51, 1378–1385. [Google Scholar]
- Gangadhar, B.H.; Mishra, R.K.; Pandian, G.; Park, S.W. Comparative study of color, pungency, and biochemical composition in chili pepper (Capsicum annuum) under different light-emitting diode treatments. HortScience 2012, 47, 1729–1735. [Google Scholar]
- Jiménez-Viveros, Y.; Núñez-Palenius, H.G.; Fierros-Romero, G.; Valiente-Banuet, J.I. Modification of light characteristics affect the phytochemical profile of peppers. Horticulturae 2023, 9, 72. [Google Scholar]
- Daood, H.G.; Vinkler, M.; Markus, F.; Hebshi, E.; Biacs, P. Antioxidant vitamin content of spice red pepper (paprika) as affected by technological and varietal factors. Food Chem. 1996, 55, 365–372. [Google Scholar] [CrossRef]
- Gnayfeed, M.H.; Daood, H.G.; Biacs, P.A.; Alcaraz, C.F. Content of bioactive compounds in pungent spice red pepper (paprika) as affected by ripening and genotype. J. Sci. Food Agric. 2001, 81, 1580–1585. [Google Scholar]
- Oboh, G.; Rocha, J.B.T. Distribution and antioxidant activity of polyphenols in ripe and unripe tree pepper (Capsicum pubescens). J. Food Biochem. 2007, 31, 456–473. [Google Scholar] [CrossRef]
- Pérez-López, A.J.; del Amor, F.M.; Serrano-Martínez, A.; Fortea, M.I.; Núñez-Delicado, E. Influence of agricultural practices on the quality of sweet pepper fruits as affected by the maturity stage. J. Sci. Food Agric. 2007, 87, 2075–2080. [Google Scholar]
- Martí, M.C.; Camejo, D.; Vallejo, F.; Romojaro, F.; Bacarizo, S.; Palma, J.M.; Sevilla, F.; Jiménez, A. Influence of fruit ripening stage and harvest period on the antioxidant content of sweet pepper cultivars. Plant Foods Human Nutr. 2011, 66, 416–423. [Google Scholar]
- Bhandari, S.R.; Jung, B.-D.; Baek, H.-Y.; Lee, Y.-S. Ripening-dependent changes in phytonutrients and antioxidant activity of red pepper (Capsicum annuum L.) fruits cultivated under open-field conditions. HortScience 2013, 48, 1275–1282. [Google Scholar] [CrossRef]
- Shaha, R.K.; Rahman, S.; Asrul, A. Bioactive compounds in chilli peppers (Capsicum annuum L.) at various ripening (green, yellow and red) stages. Ann. Biol. Res. 2013, 4, 27–34. [Google Scholar]
- Oney-Montalvo, J.; Uc-Varguez, A.; Ramírez-Rivera, E.; Ramírez-Sucre, M.; Rodríguez-Buenfil, I. Influence of soil composition on the profile and content of polyphenols in habanero peppers (Capsicum chinense Jacq.). Agronomy 2020, 10, 1234. [Google Scholar] [CrossRef]
- Stevens, R.; Buret, M.; Garchery, C.; Carretero, Y.; Causse, M. Technique for rapid, small-scale analysis of vitamin C levels in fruit and application to a tomato mutant collection. J. Agric. Food Chem. 2006, 54, 6159–6165. [Google Scholar] [CrossRef] [PubMed]
- da Silva, M.P.; Lisboa, D.R.; Santos, S.F.; Andrade, C.M.B.; de Lima Yamaguchi, K.K.; Carvalho, R.P.; de Oliveira Souza, A. Protective effect of Amazonian Himatanthus sucuuba extracts in Drosophila melanogaster exposed to Paraquat. Res. Soc. Develop. 2022, 11, e148111738931. [Google Scholar] [CrossRef]
- Georgé, S.; Brat, P.; Alter, P.; Amiot, M.J. Rapid determination of polyphenols and vitamin C in plant-derived products. J. Agric. Food Chem. 2005, 53, 1370–1373. [Google Scholar] [CrossRef]
- Singleton, V.L.; Orthofer, R.; Lamuela-Raventós, R.M. Analysis of total phenols and other oxidation substrates and antioxidants by means of Folin-Ciocalteu reagent. Methods Enzymol. 1999, 299, 152–178. [Google Scholar]
- Schuerger, A.C.; Brown, C.S.; Stryjewski, E.C. Anatomical features of pepper plants (Capsicum annuum L.) grown under red light-emitting diodes supplemented with blue or far-red light. Ann. Botany 1997, 79, 273–282. [Google Scholar] [CrossRef]
- Liu, N.; Ji, F.; Xu, L.; He, D. Effects of LED light quality on the growth of pepper seedling in plant factory. Int. J. Agric. Biol. Eng. 2019, 12, 44–50. [Google Scholar] [CrossRef]
- Bagdonavičienė, A.; Jankauskienė, J.; Čeidaitė, A.; Januškaitienė, I.; Duchovskis, P.; Brazaitytė, A. The impact of the supplemental blue and green LED and HPS lamps lighting effects on the photosynthesis parameters of sweet pepper transplants. Vital Nature Sign 2015, 34, 37–45. [Google Scholar]
- Kaiser, E.; Ouzounis, T.; Giday, H.; Schipper, R.; Heuvelink, E.; Marcelis, L.F. Adding blue to red supplemental light increases biomass and yield of greenhouse-grown tomatoes, but only to an optimum. Front. Plant Sci. 2019, 9, 2002. [Google Scholar] [CrossRef] [PubMed]
- Naznin, M.T.; Lefsrud, M.; Gravel, V.; Azad, M.O.K. Blue light added with red LEDs enhance growth characteristics, pigments content, and antioxidant capacity in lettuce, spinach, kale, basil, and sweet pepper in a controlled environment. Plants 2019, 8, 93. [Google Scholar] [CrossRef] [PubMed]
- Lanoue, J.; Little, C.; Hawley, D.; Hao, X. Addition of green light improves fruit weight and dry matter content in sweet pepper due to greater light penetration within the canopy. Sci. Hortic. 2022, 304, 111350. [Google Scholar] [CrossRef]
- Antoniali, S.; Leal, P.A.M.; Magalhães, A.M.D.; Fuziki, R.T.; Sanches, J. Physico-chemical characterization of 'Zarco HS' yellow bell pepper for different ripeness stages. Sci. Agricola 2007, 64, 19–22. [Google Scholar] [CrossRef]
- Buczkowska, H.; Sałata, A.; Rożek, E. Diversity of the utility and biological value of fruits of some sweet pepper cultivars. Acta Sci. Polonorum Hortorum Cultus 2014, 13, 49–62. [Google Scholar]
- Lee, S.K.; Kader, A.A. Preharvest and postharvest factors influencing vitamin C content of horticultural crops. Postharvest Biol. Technol. 2000, 20, 207–220. [Google Scholar] [CrossRef]
- Ohashi-Kaneko, K.; Takase, M.; Kon, N.; Fujiwara, K.; Kurata, K. Effect of light quality on growth and vegetable quality in leaf lettuce, spinach and komatsuna. Environ. Control Biol. 2007, 45, 189–198. [Google Scholar] [CrossRef]
- Palma, J.M.; Terán, F.; Contreras-Ruiz, A.; Rodríguez-Ruiz, M.; Corpas, F.J. Antioxidant profile of pepper (Capsicum annuum L.) fruits containing diverse levels of capsaicinoids. Antioxidants 2020, 9, 878. [Google Scholar] [CrossRef]


| Variance Sources | Fruit Weight | Vitamin C | Flavonoid | AC-FRAP | TPC | ||||||
|---|---|---|---|---|---|---|---|---|---|---|---|
| df | MS | p | MS | p | MS | p | MS | p | MS | p | |
| Light treatment (L) | 1 | 80,701 | 0.000 | 32,525,125 | 0.000 | 13,486 | 0.000 | 11,028,999 | 0.000 | 34,052,216 | 0.000 |
| Cultivar (C) | 1 | 1600 | 0.048 | 235,435 | 0.021 | 3032 | 0.009 | 324,391 | 0.042 | 577,676 | 0.002 |
| Maturity (M) | 2 | 3029 | 0.039 | 363,293 | 0.004 | 3151 | 0.012 | 436,568 | 0.032 | 267,561 | 0.011 |
| L × C | 1 | 2633 | 0.052 | 8241 | 0.067 | 620 | 0.080 | 61,376 | 0.081 | 47,087 | 0.057 |
| L × M | 2 | 1023 | 0.064 | 3243 | 0.137 | 156 | 0.256 | 34,542 | 0.098 | 31,541 | 0.069 |
| C × M | 2 | 480 | 0.422 | 2601 | 0.231 | 131 | 0.237 | 45,372 | 0.077 | 34,527 | 0.065 |
| L × C × M | 2 | 294 | 0.691 | 3581 | 0.112 | 151 | 0.251 | 35,887 | 0.099 | 53,022 | 0.052 |
| Error | 24 | 311 | 4237 | 82 | 24,371 | 6451 | |||||
| Total | 36 | ||||||||||
| Full Light | Vitamin C | Flavonoid | AC-FRAP | TPC |
|---|---|---|---|---|
| Fruit weight | 0.953 ** | 0.598 ** | 0.953 ** | 0.935 ** |
| Vitamin C | 0.511 | 0.929 ** | 0.939 ** | |
| Flavonoid | 0.607 * | 0.714 ** | ||
| AC-FRAP | 0.970 ** | |||
| cv. ‘Fehérözön’ in full light | Vitamin C | Flavonoid | AC-FRAP | TPC |
| Fruit weight | 0.563 | 0.594 | 0.603 * | 0.579 |
| Vitamin C | 0.682 * | 0.253 | 0.652 * | |
| Flavonoid | 0.676 * | 0.823 ** | ||
| AC-FRAP | 0.827 ** | |||
| cv. ‘Szegedi 80’ in full light | Vitamin C | Flavonoid | AC-FRAP | TPC |
| Fruit weight | 0.507 | 0.058 | 0.380 | 0.153 |
| Vitamin C | −0.496 | −0.154 | −0.360 | |
| Flavonoid | 0.714 ** | 0.972 ** | ||
| AC-FRAP | 0.746 ** | |||
| Blue-white light | Vitamin C | Flavonoid | AC-FRAP | TPC |
| Fruit weight | 0.691** | 0.757** | 0.624 ** | 0.772 ** |
| Vitamin C | 0.643** | 0.892 ** | 0.924 ** | |
| Flavonoid | 0.479 | 0.599 * | ||
| AC-FRAP | 0.922 ** | |||
| cv. ‘Fehérözön’ in blue-white light | Vitamin C | Flavonoid | AC-FRAP | TPC |
| Fruit weight | −0.511 | 0.053 | −0.452 | −0.263 |
| Vitamin C | −0.626 * | 0.767 ** | 0.802 ** | |
| Flavonoid | −0.752 ** | −0.842 ** | ||
| AC-FRAP | 0.791 ** | |||
| cv. ‘Szegedi 80’ in blue-white light | Vitamin C | Flavonoid | AC-FRAP | TPC |
| Fruit weight | 0.315 | −0.179 | 0.582 | 0.726 * |
| Vitamin C | 0.464 | −0.126 | −0.024 | |
| Flavonoid | −0.583 | −0.455 | ||
| AC-FRAP | 0.431 |
Disclaimer/Publisher’s Note: The statements, opinions and data contained in all publications are solely those of the individual author(s) and contributor(s) and not of MDPI and/or the editor(s). MDPI and/or the editor(s) disclaim responsibility for any injury to people or property resulting from any ideas, methods, instructions or products referred to in the content. |
© 2023 by the authors. Licensee MDPI, Basel, Switzerland. This article is an open access article distributed under the terms and conditions of the Creative Commons Attribution (CC BY) license (https://creativecommons.org/licenses/by/4.0/).
Share and Cite
Kurucz, E.; Antal, G.; Kincses, I.; Sipos, M.; Fári, M.G.; Holb, I.J. Effect of Light Treatment and Maturity Stage on Biomass Production and Bioactive Compounds of Two Pepper Cultivars under a Deep Water Culture Hydroponic System. Sustainability 2023, 15, 13205. https://doi.org/10.3390/su151713205
Kurucz E, Antal G, Kincses I, Sipos M, Fári MG, Holb IJ. Effect of Light Treatment and Maturity Stage on Biomass Production and Bioactive Compounds of Two Pepper Cultivars under a Deep Water Culture Hydroponic System. Sustainability. 2023; 15(17):13205. https://doi.org/10.3390/su151713205
Chicago/Turabian StyleKurucz, Erika, Gabriella Antal, Ida Kincses, Marianna Sipos, Miklós Gábor Fári, and Imre J. Holb. 2023. "Effect of Light Treatment and Maturity Stage on Biomass Production and Bioactive Compounds of Two Pepper Cultivars under a Deep Water Culture Hydroponic System" Sustainability 15, no. 17: 13205. https://doi.org/10.3390/su151713205