Article

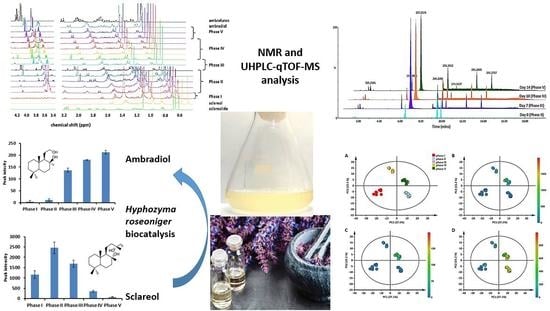
Metabolomics-Guided Analysis of the Biocatalytic Conversion of Sclareol to Ambradiol by Hyphozyma roseoniger

by
Efficient N. Ncube
1,
Paul A. Steenkamp
1,
Chris W. van der Westhuyzen
2,
Lucia H. Steenkamp
2 and
Ian A. Dubery
1,*
1
Department of Biochemistry, University of Johannesburg, P.O. Box 524, Auckland Park, Johannesburg 2006, South Africa
2
Chemicals Cluster, Council for Scientific and Industrial Research (CSIR), P.O. Box 395, Pretoria 0001, South Africa
*
Author to whom correspondence should be addressed.
Catalysts 2022, 12(1), 55; https://doi.org/10.3390/catal12010055
Submission received: 1 December 2021 / Revised: 23 December 2021 / Accepted: 30 December 2021 / Published: 4 January 2022
(This article belongs to the Special Issue Biocatalysis and Whole-Cell Biotransformation in Biomanufacturing)

Abstract

:
The biocatalytic conversion of sclareol to ambradiol, a valuable component in the fragrance industry, using whole-cell biotransformation by the dimorphic yeast Hyphozyma roseoniger, was investigated using metabolomics tools. An integrated approach was used to identify and quantify the participating intermediates in this bioconversion using both nuclear magnetic resonance (NMR) spectroscopy and liquid chromatography coupled to mass spectrometry (LC–MS). This study entailed growth stage-dependent analysis of H. roseoniger suspensions grown in batch culture over a 14-day period, beginning with a three-day induction period using 20 mg/200 mL sclareol, followed by a further 1 g/200 mL sclareol dose to enable ambradiol production. The progress of the bioconversion and the resulting dynamic changes to the metabolome were monitored using NMR analysis and semi-targeted LC–MS metabolomics. This outlined the molecular conversions occurring within the matrix and no novel intermediates participating in the sclareol to ambradiol conversion could be identified. This study presents new findings about the transformative capabilities of H. roseoniger as a whole cell biocatalyst, highlighting its potential utility in similar applications.

Graphical Abstract

1. Introduction

By definition, biocatalysis involves the utilization of soluble or immobilized microbial enzymes, whole cell catalysts, de novo microbial processes such as fermentation, or cell extracts for specific bioconversion or biotransformation of organic precursors, leading to different functionalized pure compounds [1,2,3]. Increased interest in using biocatalytic processes for production of desired chemicals is based on the perceived eco-friendliness of the method [2,4,5] although low productivity may detract from its application. Often, however, a poor understanding of the underlying biochemical reactions is an impediment to circumventing this problem [6,7].
Currently, there is ongoing research on biocatalytic routes for ambrafuran and other ambergris-related odorants as alternative synthetic routes [8]. Examples of these techniques include fermentation processes based on synthetic biology, white biotechnology (that involves the use of living cells and enzymes) to biosynthesize ambrafuran, by means of green chemistry technologies (environmentally benign chemical products and processes). These approaches are recommendable as they require less energy and create less waste [2,9].
The use of liquid chromatography coupled with mass spectrometry (LC–MS) and nuclear magnetic resonance (NMR) spectroscopy for the profiling, fingerprinting, and characterization of fungal metabolites is well-established [10,11,12]. In addition, a variety of metabolomic approaches have been applied to biocatalytic processes performed by different micro-organisms [13,14,15]. Hyphozyma roseoniger sp. nov. (accession numbers CBS 214.83 and ATCC 20624) is a dimorphic filamentous yeast-like microorganism [16,17] that is able to convert the labdane diterpenoid sclareol [8] into ambradiol (sclareol glycol/a tetranorlabdane diol). The latter is the precursor of ambrafuran (AmbroxTM), a fragrance fixative in the perfume industry. The use of H. roseoniger thus offers many of the advantages mentioned in the context of alternatives to synthetic chemistry routes, white biotechnology and green chemistry.
Although the use of sclareol and related terpenes [8] in biofermentation processes has been reported, no investigation of the sclareol to ambradiol bioconversion has been undertaken at a metabolome level. Here, NMR analyses, followed by a semi-targeted ultra-high performance liquid chromatography with MS detection (UHPLC–MS) metabolomics approach was used to investigate the dynamics of the reaction and to identify the possible intermediates, with a view to optimizing the biocatalytic production of ambradiol.

2. Results

Using semi-targeted metabolomics tools, signature biomarkers at each stage of the optimized reaction outlined by Steenkamp and Taka [17] were targeted for quantitation. An initial characterization of the reaction mixture by NMR spectroscopy was used to monitor the bioconversion process by comparing the spectra with those of the authentic standards of the major metabolites. Subsequently, an UHPLC–MS based semi-targeted metabolomics analysis was conducted.

2.1. NMR Characterization

Results from the daily analysis of the batch bioconversion by NMR are shown in Figure 1, where signal intensity data for the signals of interest across different phases (see experimental design, Figure S1 with assigned phases) is summarized. The reference spectra of pure sclareol, sclareolide, ambradiol, and ambrafuran are included in Figure 1 to facilitate the identification of the signals due to each metabolite in the presented spectra. This is the first profiling of the bioconversion of sclareol to ambradiol that incorporates NMR characterization.
It is immediately apparent that all visible major NMR signals are readily assigned to the starting material (sclareol) or to the product (ambradiol), apart from residual water at approximately 1.3 ppm and some low intensity signals due to various sugars at 3.9 and 5.1 ppm. During the initial three-day induction period (phase I), no appreciable bioconversion is evident. Subsequent to the addition of sclareol at day 3, during phase II, the ambradiol product could be observed in the samples from day 5 (the second day post-induction after adding the 1 g sclareol bolus). This is observed from the decrease in relative intensity of the signals at 4.6 ppm, 4.8 ppm, and 5.6 ppm (among others) corresponding to the alkene moiety of sclareol, and the relative increase in intensity of the signals at 1.65 ppm and 3.5 ppm due to the diol structure of ambradiol. Based on the NMR profiles, bioconversion is virtually completed by day 7/8 with no further biotransformation of the ambradiol product evident in the period of 9–15 days (phases IV, V). No evidence of the formation of sclareolide as a by-product could be perceived even with the expansion of the baseline, and no ambrafuran formation could be observed in the day 15 sample.
While these samples were not analysed under quantitative conditions, the semi-quantitative analysis of the spectra proved instructive [18,19,20]. Using the ratio of the relative areas of the sclareol:ambradiol signals at 1.59 ppm and 1.61 ppm, respectively, an indication of the extent of the bioconversion can be obtained (Figure 2). Rapid conversion of the substrate was clearly evident from day 5, with virtually complete conversion in three days after the introduction of the final bolus. This relative quantification analysis therefore confirms the finding of GC–FID quantitative analysis [21].

2.2. UHPLC-MS Analysis and Semi-Targeted Metabolomics Analysis of the Biocatalytic Conversion of Sclareol to Ambradiol by H. roseoniger

A semi-targeted UHPLC–MS based qualitative and semi-quantitative metabolomic approach was employed to determine the metabolic response of H. roseoniger cells upon sclareol addition. Time studies across the different phases (I–V) were carried out, and the base peak intensity (BPI) MS chromatograms were generated in the positive electrospray ionization (ESI)+ mode of the dimethylsulfoxide (DMSO)/methanol samples per phase, as shown in Figure 3. The ESI+ mode provided better ionization of the standards (sclareol, sclareolide and ambradiol), supporting this choice for MS analysis (Figure S2). Following the addition of sclareol at day 3 (phase II), its concentration rapidly decreased accompanied with the steady increase of ambradiol from phase II to V.
Chromatographically, the UHPLC–MS platform showed some clear differences with regard to variations in peak intensities and the presence/absence of peaks across the samples that were harvested at the different phases. Visual inspection of BPI chromatograms (Figure 3) clearly indicates that sclareol addition induced time-dependent differential metabolic changes in H. roseoniger cellular extracts. The differences in the chromatograms are indicative of the biotransformation of sclareol that results in the biosynthesis of different metabolites across the growth period. Moreover, the evaluation of the chromatograms also indicates the metabolization of sclareol to ambradiol, as reflected by the decrease or increase in intensity, respectively, of the representative ion peaks from phase II–V. These were m/z 273 (sclareol) and m/z 237 (ambradiol) with retention times reported in the legend of Figure 3 and described below. It is also noteworthy that there were variations in peak intensities and presence/absence of peaks across the samples in addition to those of sclareol and ambradiol.
Differences in peak intensity and presence/absence of peaks in crude extracts are not always obvious and require multivariate data analysis approaches to scrutinize. Thus, the UHPLC–MS data sets were further analyzed with explorative and predictive multivariate analysis methods to highlight the sclareol-induced metabolic perturbations and to reveal the underlying differences of the obtained metabolite profiles. The processed data matrices (containing Rt, m/z and intensity values) were exported into SIMCA 16.0 software for principal component analysis (PCA) and orthogonal projection to latent structures discriminant analysis (OPLS-DA).
Similar to the chromatograms, the PCA score plots constructed from the first two principal components (Figure 4A–D), depict sample groupings (variation within and between groups). The distinct clustering of the sample groups of cells harvested 0 d post-treatment (phase I) is indicative of the pre-conversion stage before reaction, the clustering of the sample groups representing 3 d post-treatment (phase II) indicates an early response, whereas the close clustering of the sample groups representing phases III, IV, and V implies ongoing changes, indicating reaction progress.
Differential time-dependent clustering of the samples of post-sclareol treatment is also represented by the PCA model. The clustering of data points on the score plot (Figure 4A) corresponds to the different experimental phases. The variation indicated by visual evaluation of the BPI chromatograms above and depicted by the PCA plot, shows differential changes in the intracellular metabolite profiles, thus suggesting the response of the H. roseoniger cells to sclareol addition as a perturbation to the metabolome. As a semi-targeted study, color-coded PCA plots were constructed using the selected m/z ion peaks of 273, 251, and 237, representing the distribution of the metabolites that are known to participate in the bioconversion reaction under study i.e., sclareol, sclareolide and ambradiol, respectively. The model allowed for the monitoring and evaluation of the reaction progress. Here, ambradiol (Figure 4D) is seemingly absent from the early days but steadily increases in intensity in the later days. Correspondingly, sclareol (Figure 4B) appears to be at the highest relative concentration at the initial treatment day (i.e., phase II) and decreases in intensity at the later days, whereas sclareolide seems to appear from phase III onwards (Figure 4C). The results thus indicate that the addition of sclareol induced time-dependent differential metabolic responses in H. roseoniger cells.

2.3. OPLS-DA Modeling and Metabolite Annotation of LC–MS Analysed Compounds

The generated OPLS-DA model, Figure 5, split the multivariate relationships into predictive variation (related to sclareol treatment) and orthogonal variation (unrelated to sclareol treatment), and were highly significant as confirmed by the low p-values of 1.72 × 10⁻¹¹ (CV-ANOVA-based) [22]. Each model comprised one predictive and one orthogonal component, with a reasonable fit to the data (R2Y = 0.743 and Q2 = 0.984). Different OPLS-DA plots comparing other groups/phases were generated and similarly validated. Interestingly, upon the evaluation of the OPLS-DA loading S-plot (Figure 5B), the extracted potential biomarkers responsible for the significant separation between the phase I (day 0) vs. phase V (day 14) post sclareol treatment, appeared to be mostly known key players of the sclareol bioconversion products, which were putatively annotated as shown below.
The annotation of the statistically significant metabolites identified through the OPLS-DA S-plots was performed by comparing the MS fragmentation patterns and Rts of authentic standards. In addition, the extracted ion chromatogram (EIC) obtained from the ESI+ mode data for the sclareol authentic standard (Figure S3) was used, as well as data reported in the literature. Annotation was according to level-1 and level-2 identification as defined by the Metabolomics Standards Initiative [23]. Accordingly, a total of 9 metabolites were annotated, as shown in Table 1 below.
As observed on the BPI MS chromatograms (Figure 3), the peak intensities of annotated statistically significant markers of the bioconversion process, as found in extracts from samples harvested at different times, appeared to be at varying levels, reflecting dynamic and ongoing changes within the cells. The UHPLC–MS results identified precursor ions with accurate masses identical to sclareol, sclareolide, ambradiol and abienol (Figure 6) upon the addition of sclareol to a pre-induced growing culture of H. roseoniger. A possible ambrafuran-related compound (co-eluting with ambrafuran) was noted, occurring only at trace levels. However, no evidence for further metabolization beyond ambradiol was observed.
The accurate mass data, empirical formula and double bond equivalent (DBE) calculations supported the proposed structures of the compounds. Reference standards (sclareol, sclareolide, ambradiol, and ambrafuran) were also used to determine Rts and mass spectral data. The intensity variations correlated with different analyte concentrations and thus the relative concentration of each marker was determined based on the relative peak area, as shown on the bar graphs below (Figure 6).
One of the aims of the study was to note putative intermediates/participants in the sclareol to ambradiol conversion. In a separate study [21], the gas chromatography results of extracts harvested in a similar manner revealed 5 unidentified trace compounds. The relative peak areas of these compounds followed a pattern similar to sclareolide and ambradiol, where there was a steady increase from phase II–V. These findings are in line with the work by Mongwe [24], where bioconversion reactions under different experimental conditions resulted in the production of unknown compounds, possibly related to sclareolide and ambradiol.

3. Discussion

Spectroscopic, chromatographic and spectrometric techniques were successfully employed in this study to characterize the biotransformation of sclareol and to determine the participating compounds that are either intermediates or end-products over five different phases of growth of H. roseoniger in batch culture (i.e., phases I–V). Sclareol was productively bioconverted using an optimized protocol where its amount/concentration decreased over time following introduction in phase II. This was evidenced by the quantification and semi-quantification across all analytical platforms. Here, NMR was applied as a monitoring technique to confirm the substrate-to-product conversion. In parallel, an UHPLC–MS semi-targeted metabolomics approach was applied to investigate the bioconversion and to search for the presence of possible intermediates and by-product(s). This methodology could also suggest the order of intermediates based on the significant biomarker features in each phase as sclareol > sclareolide > ambradiol. However, due to convoluted enzymatic systems, the pathways could either be linear or branched, generating the desired product, but also, potentially, by-products. For example, based on its structure, it is uncertain if cis-abienol is part of the conversion sequence from sclareol to ambradiol or if it is indicative of an alternative metabolism event in the cells.
Multivariate statistics and chemometric modeling supported the analysis of the analytical data of metabolic events occurring in the cells during the bioconversion. The PCA reduced the multi-dimensionality of the complex data sets from the analytical platforms [25], and depicted a global overview of all similarities and/or dissimilarities among the different treated sample groups, thus facilitating a descriptive visual evaluation of the chemical events at each harvest point. In parallel, OPLS-DA that generates models according to a priori class information [26,27,28], afforded explicative and predictive insights that facilitated the extraction of potentially significant biomarker features responsible for the discrimination between sample groups under study (e.g., phase II vs. phase IV).
Microorganisms such as fungi and bacteria are known to metabolize sclareol, with fungi being more active in this regard than bacteria [16,29,30]. The first study by Farbood and Willis [16] only reported on the ability of H. roseoniger to bioconvert sclareol to ambradiol. In addition, subsequent reports by Farbood et al. [31] and Cheetham [6] reported Bensingtonia ciliata and Cryptococcus albidus strains to metabolize sclareol into sclareolide. The presence of sclareolide in the current samples suggests that a similar enzymatic system is present in H. roseoniger, and that further conversion of sclareolide to ambradiol takes place. However, the accumulation of ambradiol does not lead to ambrafuran under the experimental conditions as applied. Notably, this is the first study to report on the presence of cis/trans-abienol as an alternative product of sclareol biotransformation.
Previous reports mentioned the toxic effects of sclareol on Botrytis cinerea and marine-derived fungi [32,33]. If this is applicable to H. roseoniger, the biotransformation of sclareol may serve as a detoxification process to more tolerable and water-soluble compounds. In addition, the sclareolide product may also be perceived as toxic by the cells [33], triggering further conversion to ambradiol. This phenomenon was evidenced by the sharp increase in relative abundance of ambradiol from phase III onwards (>200), as shown in Figure 6D.
A report by Díez et al. [34] highlighted the biotransformation of sclareol into biologically active compounds. This is generally achieved by oxidation of unreactive carbon atoms [34,35], e.g., through epoxidation of acyclic double bonds or hydroxylation of the ring system of natural products lacking an acyclic double bond. Among the several enzymatic reactions in an attempt to detoxify sclareol, bio-oxidation, hydroxylation and epoxidation have been proposed [32,36]. Biosynthetically-directed microbiological transformations of sclareol have been investigated by several groups, resulting in diols and triols, epoxy-sclareol and several hydroxy-sclareol isomers, among others, depending on biocatalytic whole cell species or isolated enzymes [37,38,39].
Regarding possible enzymes or multi-enzyme complexes involved in the whole cell bioconversion process, the constitutive presence of reynosin could indicate the activity of bifunctional class I/II diterpene synthases (diTPSs) that catalyse the sequential cycloisomerisation of geranylgeranyl diphosphate. Although the oxygen functionality of diterpenes can be promoted by either diTPS class, flavin-dependent monooxygenases, non-heme iron oxygenases and cytochrome P450-monooxygenases may also be involved. Zerbe et al. [40] suggested that the enzymes responsible for the oxidation of unreactive sclareol carbon atoms could be cytochrome P450-monooxygenases, a conclusion supported by their reported involvement in fungal-based bioconversion processes [41]. These monooxygenases are particularly interesting owing, to the multiple active sites where they can biotransform the substrate, their flexibility of movement upon binding of the substrate to favour catalytic reaction, their versatility shown by the range of substrates and type of reactions they catalyse and their exquisite ability to perform regio- and stereoselective oxidation reactions [35,42,43].
Based on the literature reporting on both chemical and biological conversion of sclareol, there may be several possible enzymes and reactions involved in its bioconversion [32,44]. Among these are oxidoreductases, such as monooxygenases, catalyzing epoxide formation from alkenes that are considered intermediates in the production of monoterpene diols, and are responsible for the hydrogenation of unsaturated double bonds [35,43]. In addition to these, lactonases (monooxygenases that initiate ring opening and closing) are responsible for the closure of the tricyclic diterpene. Other implicated enzymes include aldehyde dehydrogenases [45], racemases that catalyze the racemization of optically active compounds, i.e., (–)-ambradiol, and epimerases that result in the production of the epi-sclareol [40,46]. The biosynthesis of abienol in this bioconversion process could be because of a bifunctional class I/II cis-abienol synthase (AbCAS), where the allyl rearrangement results in the formation of a tertiary alcohol [40].

4. Materials and Methods

4.1. Growth of Hyphozyma roseoniger

The H. roseoniger de Hoog et Smith strain used in this study was obtained from the American Type Culture Collection (ATCC): The Global Bioresource Centre (https://www.atcc.org/, accessed on 1 December 2016), with the accession number 20624. Cultures in potato dextrose broth (PDB) were stored as 15% glycerol stocks at −80 °C. Working cultures of H. roseoniger were grown at 28 °C over a 14 d period on solid potato dextrose agar (PDA) (Merck, Wadeville, South Africa) as described by Steenkamp and Taka [17] and displayed a typical growth pattern characterized by a filamentous yeast appearance, with pink coloration as the cultures aged.

4.2. Batch Culture in Liquid Medium

H. roseoniger suspension cultures grown in PDB (Becton Dickinson, Woodmead, South Africa) were initiated from frozen cell stocks. Saturated overnight cultures were prepared and sterile PDB growth medium (20 mL in 250 mL Erlenmeyer flasks) was inoculated to reach a starting OD600 = 0.015. Cells were grown in Erlenmeyer flasks in an orbital shaker at 160 rpm in a temperature-controlled room at 24 °C for 14 days. Cells were pre-treated with 20 mg/200 mL sclareol (0.01% m/v) (Sigma-Aldrich, Munich, Germany) for a 3 d induction period, followed by the addition of 1 g sclareol/200 mL (0.5% m/v). The experimental design is illustrated in Figure S1 with the assigned phases (I–V) based on the growth curve of H. roseoniger in batch culture. The experiments were repeated at least three times as independent biological replicates.

4.3. Harvesting of Cells

Ten mL aliquots of the cell suspensions were harvested on selected days covering the total growth period of 15 days. The optical density was measured at 600 nm as a quantitative measure of cell growth at each harvest point. The suspensions were placed in Eppendorf tubes (Lasec, Midrand, South Africa) and harvested by centrifugation in a bench-top swinging-bucket centrifuge (Beckman Allegra, Midrand, South Africa) at 5000× g for 15 min at 4 °C to obtain the cell pellets. For metabolomics analysis, the pellets were snap frozen to quench metabolic activity and stored at −80 °C. Each determination was done in triplicate and based on three independent biological replicates.

4.4. Metabolite Extraction, Concentration, and Sample Preparation

For the UHPLC–MS samples, 20 mL of cells was harvested as described in Section 2.3. Twenty milliliters (20 mL) of 1:1 (v/v) DMSO:methanol was added to the pellets for the downstream intracellular analyses (metabo-fingerprinting). Cell homogenization was performed using an ultrasonic probe homogenizer (Bandelin Sonopuls, Berlin, Germany) at 80% intensity for 1 min × 2 cycles each, followed by centrifugation of the homogenates at 5525× g for 15 min at 4 °C. Extracts were concentrated to ±1 mL using a rotary evaporator under vacuum, transferred to 2 mL Eppendorf tubes, and dried overnight using a dry heat bath at 50 °C. The dried samples were reconstituted with 500 µL of 1:1 (v/v) DMSO:methanol, vigorously vortexed for 30 s, then filtered through 0.22 µm nylon filters. The filtrate was placed in glass inserts within UHPLC glass vials, sealed with slitted caps, and kept at 4 °C before analysis. Authentic standards of sclareol, sclareolide, ambradiol and ambrafuran (Sigma-Aldrich, Munich Germany, and Chemicals Cluster, CSIR, Pretoria, South Africa) were obtained and included in the sample set for targeted analysis.
For the NMR samples, a 2 mL sample of a single batch culture was taken on days 0 and 3 (end of the induction period, phase II of growth), and then daily until day 15 (phase V). Samples were transferred to 5 mL conical glass centrifuge tubes, treated with 2 mL of high purity ethyl acetate (EA) to disrupt the cells and vigorously vortexed for 1 min at room temperature to allow for emulsification and extraction of organic materials in the EA phase. The emulsion was centrifuged at 13,000× g for 5 min at room temperature to force phase separation, and the upper EA phase was isolated using a micropipette. The extracts were individually dried in vacuo on a rotary evaporator. Residual materials and pure standards (sclareol, sclareolide, ambradiol and ambrafuran) were dissolved in 0.6 mL deuterated chloroform (CDCl3) (Sigma-Aldrich, Munich, Germany) for analysis.

4.5. Sample Analysis and Data Acquisition

4.5.1. Ultra-High Performance Liquid Chromatography–Quadrupole Time-of-Flight Mass Spectrometry (UHPLC–qTOF–MS) Analyses

The sample extracts were separated on a Waters Acquity UHPLC HSS T3 reverse phase column (150 × 2.1 mm, 1.8 μm) thermostatted at 60 °C, with gradient elution. The UHPLC system was coupled in tandem to a SYNAPT G1 high definition (HD) MS–qTOF mass spectrometer (Waters Corporation, Milford, MA, USA).
A binary solvent system consisting of eluent A: 0.1% formic acid in MilliQ water and B: 0.1% formic acid in acetonitrile (Romil Chemistry SpS, Cambridge, UK) was used. The injection volume was set at 5 μL. The initial conditions were kept constant for 1 min at 60% A at a flow rate of 0.4 mL/min. The gradient elution was then introduced to change chromatographic conditions to 5% A over 1–16 min and held for 1 min. The analytical column was restored to the initial conditions at 18 min for 2 min, and thus the total chromatographic run time of 20 min. Monitoring of the chromatographic elution was achieved by the SYNAPT G1 mass spectrometer that was used in V-optics and operated in both positive and negative electrospray ionization (ESI) modes (ESI+/−) to detect the compounds of interest.
The MS settings were as follows: capillary voltage of 2.5 kV, scan time of 0.1 s, m/z range of 100–1100, source temperature of 120 °C, desolvation temperature of 450 °C, detector voltage of 1850 V, sample cone voltage of 30 V, extraction cone voltage of 4 V, collision energy of 3 eV, and interscan time of 0.02 s, in centroid data mode. High purity nitrogen gas was used as a desolvation gas at 550 L/h and as cone gas at 50 L/h. The sample list was randomized prior to each sample extract analyzed in analytical triplicates. A lock spray source utilizing leucine enkephalin (50 pg/mL, [M+H]+ = 556.2771 Da and [M−H] = 556.2615 Da) was used to achieve real-time optimization of the mass accuracy (1–5 mDa), at a flow rate of 0.1 mL/min and a mass window of 0.5 Da. This reference calibrant was sampled every 15 s, producing an average intensity of 350 counts/scan in centroid mode.
The robustness of the system was monitored and evaluated by including triple biological quality control (QC) pooled samples. Downstream compound identification was achieved by using commercially available standards. Herein, a data-independent acquisition (DIA) method, namely MSE was applied. the MS analyses were performed using non-fragmented as well as five fragmenting experiments simultaneously by applying alternating collision energy of 3 eV (unfragmented) and from 10 to 50 eV (fragmented).

4.5.2. Nuclear Magnetic Resonance (NMR) Analyses

Samples were placed in Norell Select Series UHP509 5 mm NMR tubes and analyzed under semiquantitative conditions on a Varian Premium Shielded 600 MHz DDR-1 (VNMRS) spectrometer (Palo Alto, CA, USA) equipped with a room temperature HCN probe. Standard parameters for proton acquisition included a 40 s relaxation delay, 128 transients over 16 k observed points (14 ppm sweep width), and pw90 of 6.3 ms. All experiments were conducted in the VNMR J 4.2A environment with 599.13 MHz as the nominal proton resonance for the magnet. Each spectrum was processed manually using the spectrometer software, allowing for 3 point backward linear prediction, drift correction and baseline correction. All spectra were aligned within the environment and recorded as screen captures.

4.6. Data Handling: Pre-Processing and Pre-Treatment

The raw UHPLC–MS data were visualized and processed using MassLynx XSTM 4.1 software (Waters Corporation, Manchester, UK). For the LC analyses, the raw data from centroid ESI(+/−) modes were analyzed. However, the analysis of the standards (sclareol, sclareolide, and ambradiol) indicated better ionization in ESI+ mode. The parameters of the MarkerLynx XSTM application (part of Masslynx XSTM software) were set to analyze the 2–20 min retention time (Rt) range of the mass chromatograms, mass range 100–1000 Da, and the alignment of peaks across samples within the range of ±0.05 Da and ±0.20 min mass and Rt windows, respectively, of the mass range 100–1000 Da and mass tolerance of 0.01 Da. The matrix outputs obtained therefrom consisted of Rt-m/z variable pairs, with the m/z peak intensity for each sample. The obtained data matrices were exported to SIMCA (soft independent modeling of class analogy) ver. 16.1 software with the omics skin (Sartorius, Umeå, Sweden) for multivariate data analysis and modeling.

4.7. Multivariate Data Analyses and Statistical Modeling

The default SIMCA software algorithm (known as the Nonlinear Iterative Partial Least Squares, NIPALS algorithm) was used to manage missing values. In addition, an efficient cross-validation (CV) procedure was employed during the process of computing the models. Whether the model was statistically significant was determined by the outcomes of this k-fold cross-validation method, represented by different quality parameters, such as R2 and Q2 metrics in this case. In this study, the data were Pareto scaled. The quality of the principal component analysis (PCA) model was evaluated based on model diagnostic tools, i.e., goodness-of-fit parameter (explained variation), R2X (cum) and predictive ability parameter (predicted variation), Q2 (cum). The generated models were considered valid if the diagnostic values were close to 1.0 [27]. This type of k-fold CV is a preferred technique for model evaluation and selection in machine learning. Following PCA, orthogonal projection to latent structures-discriminant analysis (OPLS-DA), a binary-classification method [22], was performed to confirm and complement the PCA modeling and to allow discrimination analyses to identify signatory m/z ions that differentiated the sample groups depicted by the PCA model.

5. Conclusions

This study concerned the application of metabolomics tools and principles to the field of biocatalysis/bioconversion/biotransformation and involved the use of parallel analytical platforms (LC, MS, and NMR) for the characterization of the bioconversion of the diterpene, sclareol to ambradiol by the dimorphic yeast, H. roseoniger. Noteworthy, the detection of metabolites such as reynosin in cell extracts suggests the presence of a functional terpenoid pathway activity. The addition of a low concentration of sclareol as a pre-treatment step might serve to upregulate the existing pathways involved in terpene metabolism and could explain the ability of H. roseoniger to biocatalyse the conversion of sclareol to the desired ambradiol. However, sclareol is known to be toxic to certain cell types. From a biological perspective, the biotransformation of sclareol can be regarded as an elimination of a xenobiotic through detoxifying steps of the H. roseoniger cells.
The study illustrated the ability of a metabolomics approach to demonstrate the biotransformation of sclareol through chemical modifications such as hydroxylation and other enzymatic steps as detailed above. NMR analyses were effective in following the annoted intermediates and unknown byproduct metabolites in the bioconversion of sclareol. Similarly, in UHPLC–MS profiling, other compounds related to the process were observed, that could not be identified otherwise. Overall, these findings confirm the biocatalytic reaction to involve sclareolide as an intermediate leading to ambradiol, but without further metabolization to ambrafuran. In addition, abienol was identified, possibly as a side reaction.
To the best of our knowledge, this is the first study to apply spectroscopic, chromatographic and spectrometric techniques in combination with a metabolomic approach involving multivariate data analysis and chemometric modeling to characterize and investigate a biocatalytic process in H. roseoniger. Interesting to note is the complementary findings across the different platforms, further confirming the results obtained in the study. Future investigations involving integrated omics approaches such as transcriptomics, will facilitate in establishing the association between the biosynthesis of the annotated metabolites. In conclusion, this study has generated novel findings about the bioconversion of sclareol to ambradiol by H. roseoniger, contributing to deeper insight into the process that could be explored to fully exploit its biocatalytic capabilities.

Supplementary Materials

The following are available online at https://www.mdpi.com/article/10.3390/catal12010055/s1, Figure S1: Growth of Hyphozyma roseoniger in potato dextrose medium and schematic illustration of the workflow of cell growth in batch culture for the bioconversion of sclareol to ambradiol. Figure S2: UHPLC-MS (ESI+) analysis of the standards used for annotation. Figure S3: Extracted ion chromatograms (EIC) obtained from ESI(+) mode MS data of sclareol.

Author Contributions

Conceptualization, I.A.D. and L.H.S.; methodology, E.N.N., P.A.S. and C.W.v.d.W.; validation, E.N.N., P.A.S. and C.W.v.d.W.; formal analysis, E.N.N.; P.A.S. and C.W.v.d.W.; investigation, E.N.N. and I.A.D.; resources, I.A.D. and L.H.S.; data curation, E.N.N.; writing—original draft preparation, E.N.N.; writing—review and editing, I.A.D. and L.H.S.; supervision, I.A.D.; project administration, I.A.D. and L.H.S.; funding acquisition, I.A.D. and L.H.S. All authors have read and agreed to the published version of the manuscript.

Funding

The research was funded by the University of Johannesburg (UJ) and the Chemicals Cluster of the Council for Scientific and Industrial Research (CSIR), Pretoria, South Africa. The APC was funded by the University of Johannesburg.

Data Availability Statement

Data is contained within the article or Supplementary Materials and also from the corresponding author.

Acknowledgments

The University of Johannesburg, South African Council for Scientific and Industrial Research (CSIR) and the Department of Science and Innovation (DSI) are recognized for fellowship support to E.N.N.

Conflicts of Interest

The authors declare no conflict of interest.

References

  1. Sultana, N. Microbial biotransformation of bioactive and clinically useful steroids and some salient features of steroids and biotransformation. Steroids 2018, 136, 76–92. [Google Scholar] [CrossRef]
  2. Wohlgemuth, R. Asymmetric biocatalysis with microbial enzymes and cells. Curr. Opin. Microbiol. 2010, 13, 283–292. [Google Scholar] [CrossRef]
  3. Allendes, J.A.; Bustos, D.A.; Del, A.; Pacciaroni, V.; Sosa, V.E.; Bustos, D.A. Microbial functionalization of (–)-ambroxide by filamentous fungi. Biocatal. Biotransform. 2011, 29, 83–86. [Google Scholar] [CrossRef]
  4. Choi, J.; Han, S.; Kim, H. Industrial applications of enzyme biocatalysis: Current status and future aspects. Biotechnol. Adv. 2015, 33, 1443–1454. [Google Scholar] [CrossRef]
  5. Hegazy, M.F.; Mohamed, T.A.; Elshamy, A.I.; Mohamed, A.H.; Mahalel, U.A.; Reda, E.H.; Shaheen, A.M.; Tawfik, W.A. Microbial biotransformation as a tool for drug development based on natural products from mevalonic acid pathway: A review. J. Adv. Res. 2015, 6, 17–33. [Google Scholar] [CrossRef] [Green Version]
  6. Cheetham, P.S.J. The use of biotransformations for the production of flavours and fragrances. Trends Biotechnol. 1993, 11, 478–488. [Google Scholar] [CrossRef]
  7. Vandamme, E.J. Bioflavours and fragrances via fungi and their enzymes. Fungal Divers. 2003, 13, 153–166. [Google Scholar]
  8. Ncube, E.N.; Steenkamp, L.H.; Dubery, I.A. Ambrafuran (AmbroxTM) synthesis from natural plant product precursors. Molecules 2020, 25, 3851. [Google Scholar] [CrossRef] [PubMed]
  9. Schempp, F.M.; Drummond, L.; Buchhaupt, M.; Schrader, J. Microbial cell factories for the production of terpenoid flavor and fragrance compounds. J. Agric. Food Chem. 2018, 66, 2247–2258. [Google Scholar] [CrossRef]
  10. Ząbek, A.; Klimek-Ochab, M.; Jawień, E.; Młynarz, P. Biodiversity in targeted metabolomics analysis of filamentous fungal pathogens by 1H NMR-based studies. World J. Microbiol. Biotechnol. 2017, 33, 1–12. [Google Scholar] [CrossRef] [Green Version]
  11. Sevastos, A.; Kalampokis, I.F.; Panagiotopoulou, A.; Pelecanou, M.; Aliferis, K.A. Implication of Fusarium graminearum primary metabolism in its resistance to benzimidazole fungicides as revealed by 1H NMR metabolomics. Pestic. Biochem. Physiol. 2018, 148, 50–61. [Google Scholar] [CrossRef]
  12. Ezekiel, C.N.; Oyedele, O.A.; Kraak, B.; Ayeni, K.I.; Sulyok, M.; Houbraken, J.; Krska, R. Fungal diversity and mycotoxins in low moisture content ready-to-eat foods in Nigeria. Front. Microbiol. 2020, 11, 615. [Google Scholar] [CrossRef] [PubMed] [Green Version]
  13. Gold, N.D.; Gowen, C.M.; Lussier, F.X.; Cautha, S.C.; Mahadevan, R.; Martin, V.J.J. Metabolic engineering of a tyrosine-overproducing yeast platform using targeted metabolomics. Microb. Cell Fact. 2015, 14, 73. [Google Scholar] [CrossRef] [PubMed] [Green Version]
  14. Spevacek, A.R.; Benson, K.H.; Bamforth, C.W.; Slupsky, C.M. Beer metabolomics: Molecular details of the brewing process and the differential effects of late and dry hopping on yeast purine metabolism. J. Inst. Brew. 2016, 122, 21–28. [Google Scholar] [CrossRef] [Green Version]
  15. Ogunade, I.; Schweickart, H.; McCoun, M.; Cannon, K.; McManus, C. Integrating 16S rRNA sequencing and LC–MS-based metabolomics to evaluate the effects of live yeast on rumen function in beef cattle. Animals 2019, 9, 28. [Google Scholar] [CrossRef] [Green Version]
  16. Farbood, M.I.; Willis, B.J. Process for Producing Diol and Furan and Microorganism Capable of Same. European Patent EP0204009A1, 14 March 1989. [Google Scholar]
  17. Steenkamp, L.H.; Taka, M. Process for the Production of Ambrafuran. U.S. Patent US20100248316A1, 30 September 2010. [Google Scholar]
  18. Ratcliffe, R.G.; Shachar-Hill, Y. Revealing metabolic phenotypes in plants: Inputs from NMR analysis. Biol. Rev. 2005, 80, 27–43. [Google Scholar] [CrossRef] [Green Version]
  19. Wishart, D.S. Metabolomics: The principles and potential applications to transplantation. Am. J. Transplant. 2005, 5, 2814–2820. [Google Scholar] [CrossRef]
  20. Moco, S.; Bino, R.J.; De Vos, R.C.H.; Vervoort, J. Metabolomics technologies and metabolite identification. Trends Anal. Chem. 2007, 26, 855–866. [Google Scholar] [CrossRef]
  21. Ncube, E.N.; Mathiba, K.; Steenkamp, L.H.; Dubery, I.A. Gas chromatographic profiling of the biocatalytic conversion of sclareol to ambradiol by Hyphozyma roseoniger. Biocatal. Biotransform. 2022, 40, 1–5. [Google Scholar] [CrossRef]
  22. Eriksson, L.; Trygg, J.; Wold, S. A chemometrics toolbox based on projections and latent variables. J. Chemom. 2014, 28, 332–346. [Google Scholar] [CrossRef]
  23. Sumner, L.W.; Amberg, A.; Barrett, D.; Beale, M.H.; Beger, R.; Daykin, C.A.; Fan, T.W.-M.; Fiehn, O.; Goodacre, R.; Griffin, J.L.; et al. Proposed minimum reporting standards for chemical analysis Chemical Analysis Working Group (CAWG) Metabolomics Standards Initiative (MSI). Metabolomics 2007, 3, 211–221. [Google Scholar] [CrossRef] [Green Version]
  24. Mongwe, J. Development of an Optimized Process for Commercial Production of (–)-Ambrafuran. Master’s Dissertation, University of Witwatersrand, Johannesburg, South Africa, 2016. [Google Scholar]
  25. Wiklund, S.; Johansson, E.; Sjöström, L.; Mellerowicz, E.J.; Edlund, U.; Shockcor, J.P.; Gottfries, J.; Moritz, T.; Trygg, J. Visualization of GC/TOF-MS-based metabolomics data for identification of biochemically interesting compounds using OPLS class models. Anal. Chem. 2008, 80, 115–122. [Google Scholar] [CrossRef]
  26. Saccenti, E.; Hoefsloot, H.C.J.; Smilde, A.K.; Westerhuis, J.A.; Hendriks, M.M.W.B. Reflections on univariate and multivariate analysis of metabolomics data. Metabolomics 2014, 10, 361–374. [Google Scholar] [CrossRef]
  27. Tugizimana, F.; Piater, L.; Dubery, I. Plant metabolomics: A new frontier in phytochemical analysis. S. Afr. J. Sci. 2013, 109, 1–11. [Google Scholar] [CrossRef]
  28. Yamamoto, H.; Yamaji, H.; Abe, Y.; Harada, K.; Waluyo, D.; Fukusaki, E.; Kondo, A.; Ohno, H.; Fukuda, H. Dimensionality reduction for metabolome data using PCA, PLS, OPLS, and RFDA with differential penalties to latent variables. Chemom. Intell. Lab. Syst. 2009, 98, 136–142. [Google Scholar] [CrossRef]
  29. Cheetham, P.S.J. Screening for novel biocatalysts. Enzyme Microbiol. Technol. 1987, 9, 194–213. [Google Scholar] [CrossRef]
  30. Igarashi, K.; Takizawa, S.; Higaki, N.; Hagihara, H. Microorganism and Method for Producing Dodecahydro-3a, 6, 6, 9a-tetramethyl naphtho[2, 1-b]furan Intermediate, Using the Novel Microorganism. U.S. Patent US8084237B2, 27 December 2011. [Google Scholar]
  31. Farbood, M.I.; Morris, J.A.; Downey, A.E. Process for Producing Diol and Lactone and Microorganisms Capable of Same. U.S. Patent US4970163A, 13 November 1990. [Google Scholar]
  32. Farooq, A.; Tahara, S. Biotransformation of two cytotoxic terpenes, α-santonin and sclareol by Botrytis cinerea. Zeitschrift für Naturforschung C 2000, 55, 713–717. [Google Scholar] [CrossRef]
  33. Martins, M.P.; Ouazzani, J.; Arcile, G.; Jeller, A.H.; de Lima, J.P.F.; Seleghim, M.H.R.; Oliveira, A.L.L.; Debonsi, H.M.; Venâncio, T.; Yokoya, N.S.; et al. Biohydroxylation of (−)-Ambrox®, (−)-Sclareol, and (+)-Sclareolide by whole cells of Brazilian marine-derived fungi. Mar. Biotechnol. 2015, 17, 211–218. [Google Scholar] [CrossRef]
  34. Díez, D.; Sanchez, J.; Rodilla, J.; Rocha, P.; Mendes, R.; Paulino, C.; Marcos, I.; Basabe, P.; Urones, J. Microbial hydroxylation of sclareol by Rhizopus stolonifer. Molecules 2005, 10, 1005–1009. [Google Scholar] [CrossRef] [Green Version]
  35. Bustos Crescentino, D.; Pacciaroni, A.; Bustos, D.A.; Sosa, V. Conversion of (-)-ambroxide by whole cells of Fusarium verticillioides (Hypocreales, Nectriaceae). Int. J. Appl. Microbiol. Biotechnol. Res. 2016, 4, 1–6. [Google Scholar] [CrossRef]
  36. Jassbi, A.R.; Zamanizadehnajari, S.; Azar, P.A.; Tahar, S. Antibacterial diterpenoids from Astragalus brachystachys. Zeitschrift für Naturforschung C 2002, 57, 1016–1021. [Google Scholar] [CrossRef]
  37. Kouzi, S.A.; McChesney, J.D. Microbial models of mammalian metabolism: Fungal metabolism of the diterpene sclareol by Cunninghamella species. J. Nat. Prod. 1991, 54, 483–490. [Google Scholar] [CrossRef]
  38. Kouzi, S.A.; McChesney, J.D. Hydroxylation and glucoside conjugation in the microbial metabolism of the diterpene sclareol. Xenobiotica 1991, 21, 1311–1323. [Google Scholar] [CrossRef]
  39. Hanson, J.R.; Hitchcock, P.B.; Nasir, H.; Truneh, A. The biotransformation of the diterpenoid, sclareol, by Cephalosporium aphidicola. Phytochemistry 1994, 36, 903–906. [Google Scholar] [CrossRef]
  40. Zerbe, P.; Chiang, A.; Yuen, M.; Hamberger, B.; Hamberger, B.; Draper, J.A.; Britton, R.; Bohlmann, J. Bifunctional cis-abienol synthase from Abies balsamea discovered by transcriptome sequencing and its implications for diterpenoid fragrance production. J. Biol. Chem. 2012, 287, 12121–12131. [Google Scholar] [CrossRef] [PubMed] [Green Version]
  41. Van den Brink, J.M.; van Gorcom, R.F. Oxdoreductase from flamentous fungi, DNA coding therefor and cells transformed with said DNA. U.S. Patent US5801024A, 1 September 1998. [Google Scholar]
  42. Werck-Reichhart, D.; Feyereisen, R. Cytochromes P450 a Success Story. Genome Biol. 2000, 1, 1–9. [Google Scholar] [CrossRef] [PubMed] [Green Version]
  43. Munro, A.W.; Girvan, H.M.; Mason, A.E.; Dunford, A.J.; McLean, K.J. What makes a P450 tick? Trends Biochem. Sci. 2013, 38, 140–150. [Google Scholar] [CrossRef]
  44. Hieda, T.; Mikami, Y.; Obi, Y.; Kisaki, T. Microbial transformation of cis-abienol. Agric. Biol. Chem. 1982, 46, 2249–2255. [Google Scholar] [CrossRef]
  45. Wang, X.; Zhang, X.; Yao, Q.; Hua, D.; Qin, J. Comparative proteomic analyses of Hyphozyma roseonigra ATCC 20624 in response to sclareol. Braz. J. Microbiol. 2019, 50, 79–84. [Google Scholar] [CrossRef] [Green Version]
  46. Van der Werf, M.J.; de Bont, J.A.M.; Leak, D.J. Opportunities in microbial biotransformation of monoterpenes. In Biotechnology of Aroma Compounds; Berger, R.G., Babel, W., Blanch, H.W., Cooney, C.L., Enfors, S.O., Eriksson, E.L., Fiechter, A., Klibanov, A.M., Primrose, S.B., Rogers, P.L., et al., Eds.; Springer: Berlin/Heidelberg, Germany, 1997; Volume 55, pp. 147–177. [Google Scholar]
Figure 1. Representative 1H NMR spectra (600 MHz) of ethyl acetate extracts from Hyphozyma roseoniger in batch culture, sampled during the bioconversion phases. All spectra were referenced against residue protonated chloroform in the solvent (7.26 ppm). Phases I–V correspond to the growth stages of the organism in batch culture (Figure S1) and the methodology applied to the UHPLC-MS results. The period between days 0–3 indicates the induction period (phase I). Spectra of the standards are included for reference (sclareol and sclareolide below the spectral stack, ambradiol and ambrafuran above it).
Catalysts 12 00055 g001
Figure 2. Semi-quantitative analysis showing the ratios (expressed as percentage) of sclareol to ambradiol present in H. roseoniger extracts across different phases of the sclareol bioconversion. Evidently, sclareol decreases in concentration from the first phase to the last, whereas the ambradiol concentration steadily increases from the first to the last phase.
Catalysts 12 00055 g002
Figure 3. Representation of the ultra-high performance liquid chromatography separation with high-definition mass spectrometry detection of DMSO-/methanolic extracts of sclareol-treated H. roseoniger. The cells were harvested from selected days over a 15 d growth period (phases II–V). The representative base peak intensity (BPI) MS chromatograms were acquired in ESI+ mode and show evident differences in peak intensities and presence/absence across the different phases. The chromatograms were offset by 0.5 min increments on the retention time scale (x-axis) and the y-axes were linked to allow for the comparison of relative peak intensities, expressed as percentages. Retention times and m/z values: sclareol/epi-sclareol: (9.54/10.00 min, m/z 273.2574), ambradiol: (6.51 min, m/z 237.2162), sclareolide I/II: (5.63/9.10, m/z 251.1988), abienol: (11.86/13.28, m/z 291.2665).
Catalysts 12 00055 g003
Figure 4. Principal component analysis (PCA) models of DMSO/methanolic extracts of H. roseoniger cells, analyzed by UHPLC–MS. The scores plot (A) was constructed from the first two principal components and shows clustering according to different harvest days post sclareol treatment (phases I–V) and clear separation of the metabolite profiles characteristic of the respective phases. The Pareto-scaled scores plot explains 52.7% and 43.5% of the total variation (PC1 and PC2). The quality parameters of the model were: explained variation/goodness of fit R2 = 0.716, and predictive variance Q2 = 0.628. The ellipse indicates Hotelling’s T2 distribution at a 95% confidence interval. The superimposed color-coded plots represent the distribution of selected ion peaks: (B) m/z = 273 (sclareol), (C) m/z = 251 (sclareolide) and (D) m/z = 237 (ambradiol).
Catalysts 12 00055 g004
Figure 5. OPLS-DA representative models of DMSO-/methanolic extracts of H. roseoniger cells analyzed by UHPLC–MS. (A) A score plot, representing phase I (day 0) vs. phase V (day 14) post sclareol treatment. The x-axis is the modelled covariation, and the y-axis is the loading vector of the predictive component, (R2Y ≥ 0.9 and Q2 = 0.98, respectively). (B) The mass ions in the upper right quadrant of the S-plot (p[1] > 0.1 and p(corr)[1] > 0.05) are positively correlated to the sclareol treatment. (C) A SUS (shared-and-unique structures) plot was generated to confirm S-plot findings, where the blue represents shared features, with red and green representing unique features from phase I and phase V, respectively. (D) A permutations plot was generated where the model was statistically validated as significant, to confirm the significance of these potential biomarkers.
Catalysts 12 00055 g005
Figure 6. Annotated intermediate compounds of the sclareol bioconversion process with the respective peak intensities at different harvest-times. Compounds include reynosin (A), sclareol (B), sclareolide (C), ambradiol (D), abienol (E) and ambrafuran-related (F). The intensity variations reflected on different concentrations, indicative of the harvest time at which each compound was at its highest relative concentration. The bar graphs were constructed using average values of peak intensities, where 3 biological replicates per sample were analyzed in triplicate (error bars indicate the standard deviation, n = 9).
Catalysts 12 00055 g006
Table 1. List of annotated significant biomarker metabolites in extracts from sclareol-treated H. roseoniger grown in batch culture.
#MetaboliteMolecular FormulaRt (min)MW (g/mol)[M+H]+ProbabilityFold Change
Day 0 vs. Day 3
1Reynosin IC15H20O2.49248.32249.14439.53 × 1040.59
Reynosin IIC15H20O4.50248.32249.14361.02 × 1070.26
Day 3 vs. Day 14
3Sclareolide IC16H26O25.63250.38251.19421.07 × 103421.61
4Ambradiol
(product ion)
C16H30O2
(C16H29O)
6.51254.41(* 237.2172)8.80 × 10451.18
5Sclareolide IIC16H26O29.10250.38251.19585.18 × 1053.00
6Sclareol
(degradation product)
C20H36O2
(C20H33)
9.54308.51(** 273.2523)2.52 × 1055.76
7epi-Sclareol
(degradation product)
C20H36O2
(C20H33)
10.00308.51(** 273.2531)6.41 × 10611.21
8cis/trans-AbienolC20H34O11.86290.50291.25976.21 × 10540.39
9cis/trans-AbienolC20H34O13.28290.50291.25964.00 × 10452.57
* m/z of product ion corresponding to the loss of water from the ambradiol structure. ** The annotation of sclareol was facilitated by close inspection and monitoring of the ionization of the compound during MS analysis, where there was in-source fragmentation, explaining the [M+H]+ value of m/z = 273, contrary to the expected value of 309 (Figure S3).
Publisher’s Note: MDPI stays neutral with regard to jurisdictional claims in published maps and institutional affiliations.

