Article

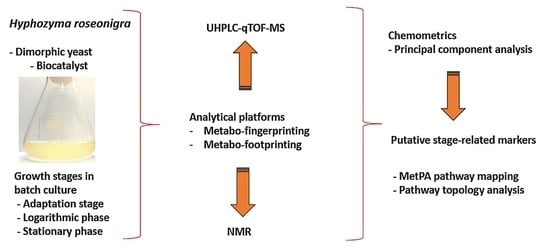
Untargeted Metabolomics Exploration of the Growth Stage-Dependent Chemical Space of the Sclareol-Converting Biocatalyst Hyphozyma roseonigra

1
Department of Biochemistry, University of Johannesburg, Auckland Park, P.O. Box 524, Johannesburg 2006, South Africa
2
Chemicals Cluster, Council for Scientific and Industrial Research (CSIR), P.O. Box 395, Pretoria 0001, South Africa
*
Author to whom correspondence should be addressed.
Catalysts 2022, 12(10), 1225; https://doi.org/10.3390/catal12101225
Submission received: 18 August 2022 / Revised: 7 October 2022 / Accepted: 10 October 2022 / Published: 13 October 2022
(This article belongs to the Special Issue Biocatalysis and Whole-Cell Biotransformation in Biomanufacturing)

Abstract

:
Hyphozyma roseonigra is a dimorphic yeast used as a biocatalyst to convert sclareol, a plant diterpenoid to ambradiol. The latter is an intermediate in the synthesis of ambrafuran, a high-value chemical in the fragrance industry. Unfortunately, little is known about the underlying biochemistry of this microorganism. In this study, the integration of multi-platform-based metabolomics was used to better comprehend H. roseonigra from a biochemical perspective. The focus on metabolomic changes during growth and development was accomplished using untargeted LC–MS and NMR analyses. Cell suspensions were grown in batch culture over a 14-day period, and cells from the early-, log-, and stationary phases were harvested every second day using platform-compatible extraction procedures. Following chemometric analysis of LC–MS and NMR data acquired from both intra- and extracellular extracts, the identified discriminatory ions annotated from the endo- and exometabolomes (metabo-fingerprinting and metabo-footprinting) were found to fall predominantly in the primary metabolism class. Pathway mapping and feature-based network correlation analysis assisted in gaining insights into the active metabolic pathways during growth and development and did not flag terpene synthesis. This study provides novel insights into the basic metabolic capabilities of H. roseonigra and suggests that sclareol is metabolized as the detoxification of a hydrophobic xenobiotic compound.

Graphical Abstract

1. Introduction

Biocatalysis is a microbial process for the specific bioconversion/biotransformation of organic precursors, resulting in the production of different functionalized pure compounds [1,2]. However, the major challenge faced by biocatalysis is the lack of knowledge of the underlying biochemical reactions involved in the biocatalytic steps, in order to obtain high yields [3]. Hyphozyma roseonigra sp. nov. is a filamentous yeast-like Hyphomycetes with anamorphic qualities [4], displaying peculiar morphological and biochemical properties (accession numbers CBS 214.83 at the Centraal Bureau voor Schimmel Cultures and ATCC 20624 at the American Type Culture Collection) [4,5,6]. Currently, the microorganism is documented as Moesziomyces antarcticus with CBS 5955 and cross-referenced JCM 10317 (GenBank: BBIZ00000000). As much as the organism has been taxonomically described and classified, very little is known about its biochemistry, capable of biotransforming the plant metabolite, sclareol, into the fragrance valuable ambradiol in a one-step process [5,6]. Sclareol is a diterpene from Salvia sclarea (clary sage) with a labdane carbon skeleton that resembles that of (−)-ambrafuran, a tetranorlabdane diterpenoid. Due to this structural similarity, sclareol is the most promising starting material for the semi-synthesis of ambrafuran [7].
Metabolomics is a fusion of the traditional areas of metabolite analysis supported by bioanalytical instrumentation and chemometrics. Untargeted metabolomics seeks to identify and quantify most metabolites in a biological system, and as such, it is a vital component of systems biology approaches. The metabolome reflects the upstream transcriptomic and proteomic events within an organism and may be regarded as a true reflection of its physiological status. Ultra-high-performance liquid chromatography coupled to mass spectrometry (UHPLC–MS) has emerged as a central analytical platform in several metabolomics-based approaches over the years, particularly plant studies [8,9]. Several UHPLC–MS methods have been developed for the profiling and characterization of yeast/fungal metabolites [10,11]. In parallel, methods for the use of NMR for metabolite fingerprinting of yeast/fungal metabolites have been developed [12,13,14]. NMR has distinct advantages as a robust, highly selective, and non-destructive analytical technique [14].
Although the biocatalytic application of H. roseonigra has been documented [5,6], little is known about the metabolic pathways operational within the microorganism. Aspects such as whether a pathway is constitutively present and active vs. inducible under certain experimental conditions, as well as knowledge about the availability of essential cofactors linked to these pathways, are important for the experimental design and maintenance of optimal bioreactor conditions. Significant knowledge gaps that limit the full deployment of this microorganism as a biocatalyst still exist. These questions include the presence and nature of putative intermediate products during the course of biotransformation and the reactions leading to the formation of the main product, ambradiol/sclareol glycol [15]. Previously, we explored the non-polar metabolites using gas chromatography coupled to mass spectrometry (GC–MS)-based profiling, where 30 metabolites including squalene, and a variety of alkanes were annotated in non-induced cells [16]. Recently, we reported the investigation and profiling of the bioconversion process of sclareol to ambradiol in bioreactors by LC-MS and nuclear magnetic resonance (NMR) [17] as well as GC [18]. Proteomic data generated by [19] pointed to the upregulation of aldehyde dehydrogenases upon sclareol addition while [15] reported that sclareol glycol and sclareolide (a co-product) are not interconverted and are potentially synthesized via different metabolic pathways in resting, non-growing cells.
In an attempt to broaden the understanding of H. roseonigra from a biochemical perspective, this study applied the use of untargeted multi-platform-based metabolomics to explore the presence of both primary and secondary metabolites present in cellular extracts or secreted into the growth medium. Here, a UHPLC–MS-based metabolomics study, supported by NMR, was conducted, aimed at an assessment of the H. roseonigra metabolome linked to the different growth/developmental stages. Such knowledge would eventually facilitate the optimization of the biocatalytic process with regard to the reaction conditions and type of culture process.

2. Results

The major goal was to investigate intracellular and secreted extracellular metabolites in an untargeted manner in the context of the growth and developmental stages of H. roseonigra during fermentative batch culture (Figure S1 illustrates the growth profile in batch culture under the experimental conditions as described over the period of investigation). This results section is thus further subdivided into two main subsections: (i) Profiling metabolic changes in H. roseonigra over the growth period based on UHPLC–MS and NMR acquired data and (ii) pathway mapping and network correlation analysis by using all the annotated compounds, including the 30 metabolites previously annotated [16]. The numbers referring to the annotated metabolites (# 145) continue from Table 1 (# 117) to Table 2 (# 1845).

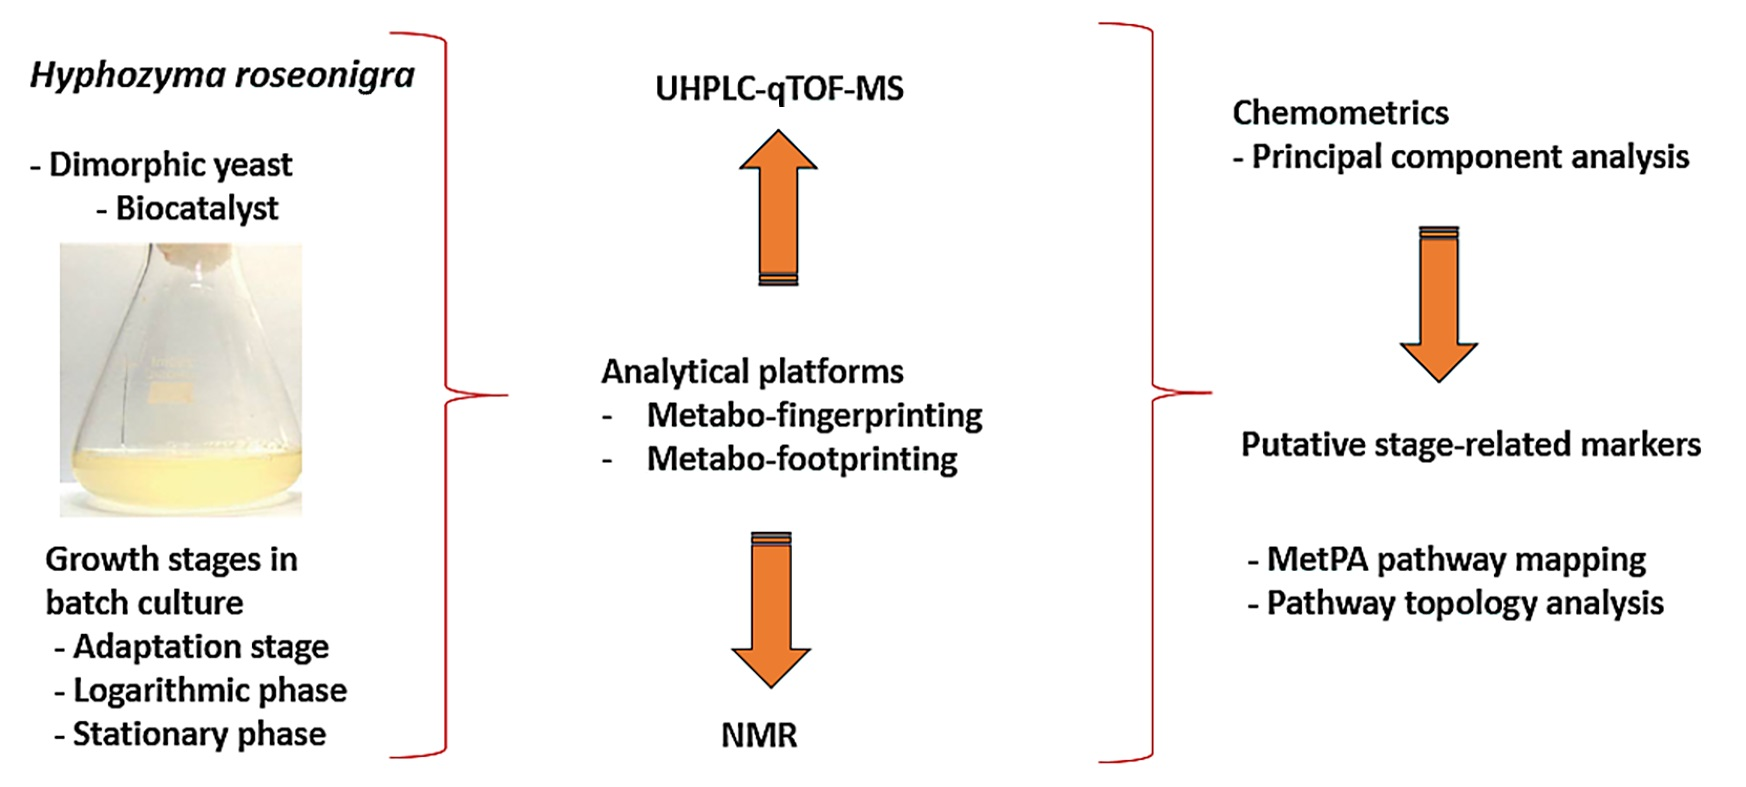
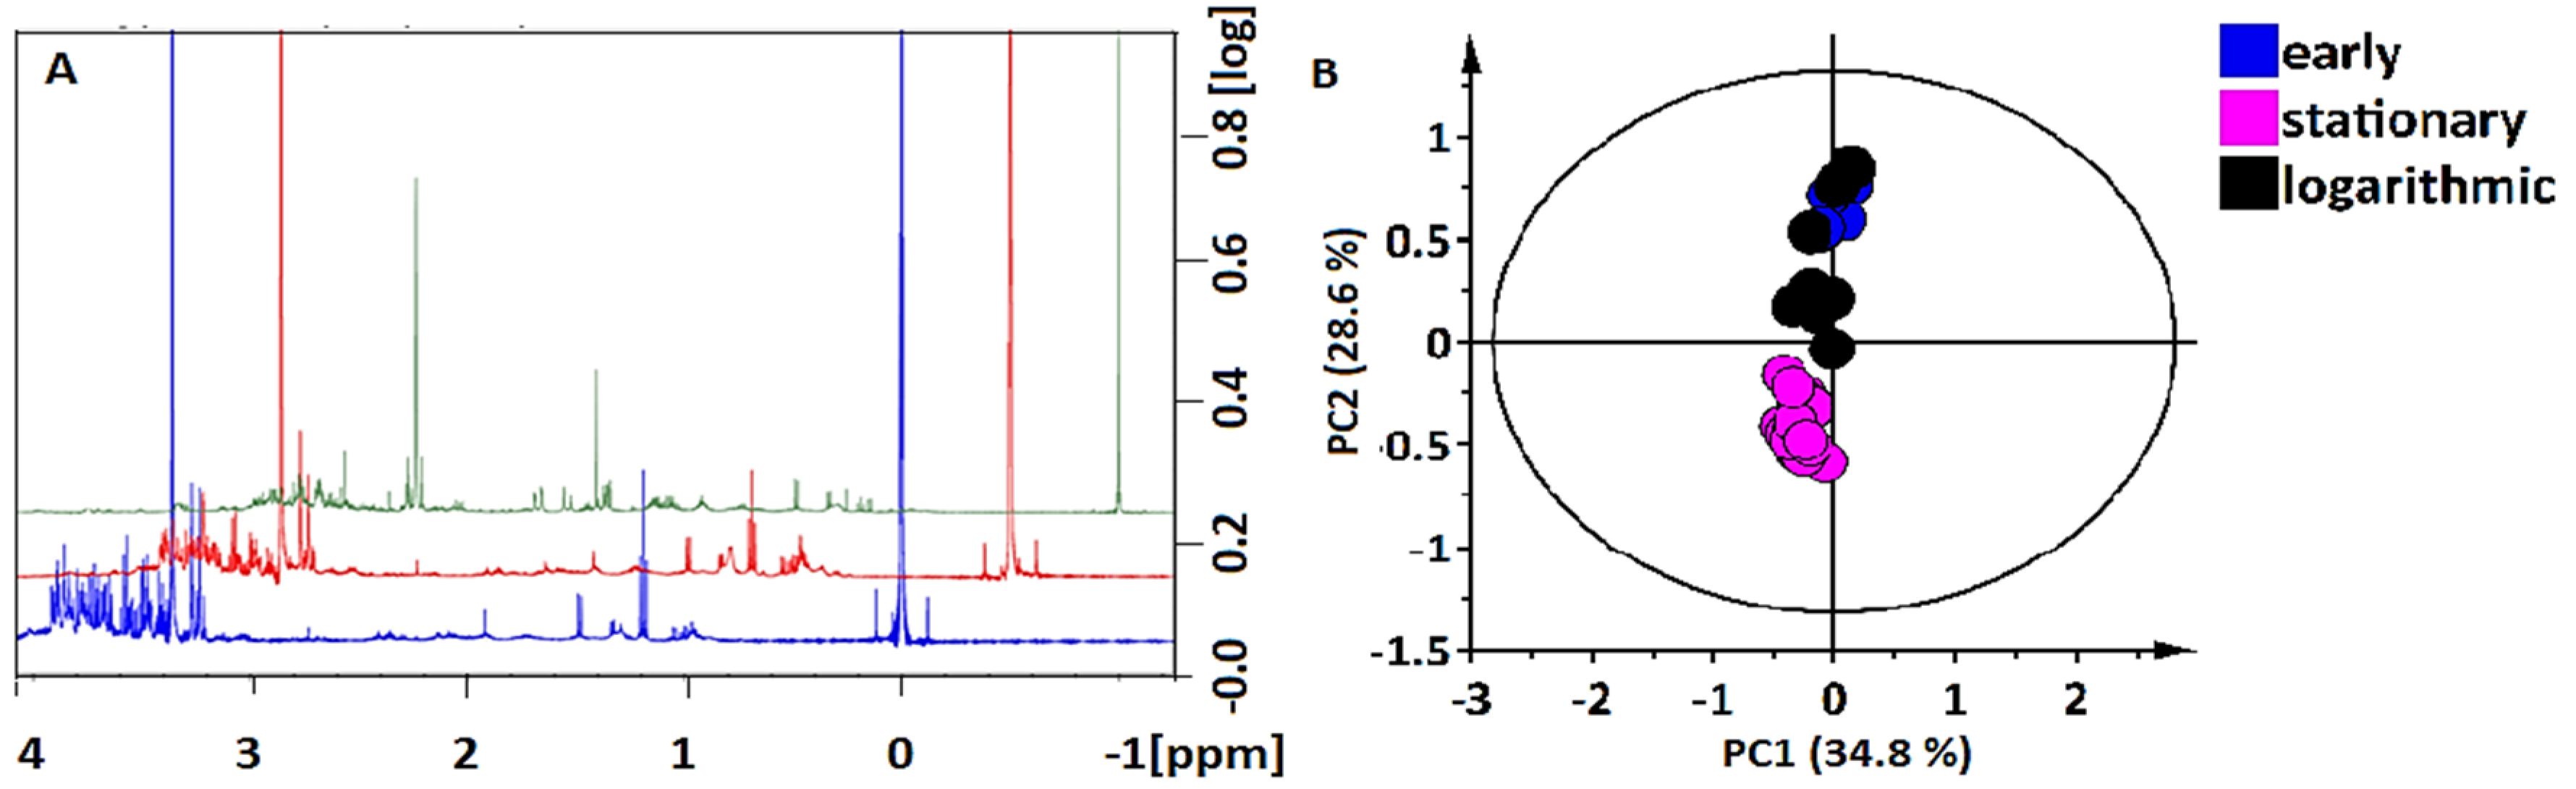
2.1. UHPLC–MS Analyses

Cells were harvested by centrifugation from cell suspensions and the cells (pellets) and growth medium (supernatants) were separately processed by extraction with methanol and acetone in order to gather information about the polar vs. semi-polar metabolites. Chromatographic analyses revealed variations in peak intensities across all the samples, and base peak intensity (BPI) MS chromatograms of methanolic-/acetonic intracellular extracts (Figure 1) and extracellular extracts (Figure S2) clearly indicated time-dependent changes across the different growth/developmental stages.
The differences detected in the chromatographically distinct metabolite profiles are indicative of metabolic variations across the different stages of growth. Although limited and not fully informative, variations observed through MS chromatograms are the first indication of differential chemical compositions. Geared toward a more holistic understanding of these growth- and development-related differences, advanced multivariate data processing and chemometric analyses of the complex and multidimensional data were subsequently applied.

2.1.1. Multivariate Data Analysis

MVDA was performed for data exploration to reveal trends within the metabolome across the time points, and to detect similarities/differences in the metabolite profiles at the different growth stages. Amongst the MVDA performed, principal component analysis (PCA) modeling was undertaken as an unsupervised explorative tool to reduce the complexity and multidimensionality of the raw UHPLC–MS data. The PCA models of intracellular- and extracellular extracts analyzed using UHPLC–MS in ESI(−) mode are shown in Figure 2 and Figure S3, respectively. Considering the UHPLC–MS was carried out in both ionization modes, the PCA models of intracellular- and extracellular extracts analyzed in ESI(+) mode are shown in Figures S4 and S5, respectively.
Although only minor variations on peak presence/absence of peaks could be observed on the BPI MS chromatograms (Figure 1 and Figure S2), differential stage-related clustering of the samples was observed with the PCA models (Figure 2). This differential clustering revealed by PCA relates to the differences previously visualized by the chromatographic separation. The models illustrate both similarities and differences within (PC2) and between (PC1) extracts generated from the different growth stages. The PCA scatter plot models thus revealed differential changes in the intra- and extracellular metabolite profiles, indicating changes in the metabolite profile of the metabolome as the cell culture ages.

2.1.2. Metabolite Annotation and Relative Quantification of UHPLC–MS Analyzed Compounds

Annotation of the m/z ions identified from the high-resolution MS analyses was carried out as described [20,21,22,23]. Different annotation approaches, involving four different levels (as defined by the Metabolomics Standards Initiative, MSI), were proposed [24]. Metabolite annotation in this study was carried out to MSI-level 2, i.e., ‘tentatively identified’ compounds (e.g., without chemical reference standards, based upon physicochemical properties and/or spectral similarity with public/commercial spectral libraries such as MS-DIAL, [23]). Data from both ESI modes were used for the annotation of ions present in methanolic- and acetonic intra- and extracellular extracts. Although a large percentage of the m/z features contained in the raw data could not be successfully annotated/identified (due to the lack of suitable databases), a wide range of metabolites, predominantly linked to primary metabolism, was revealed (Table 1, # 117).
To assist in the exploration of changes in the metabolite composition of the metabolome as related to the growth stage, heat maps were generated (Figure S6), using peak intensities of selected metabolites representing each class using the ‘Metaboanalyst bioinformatics tool suite’ software. Distinct clusters separating the selected metabolites were observed: (i) Metabolites with a relatively lower concentration during the early adaptation stage that increases as H. roseonigra develops into the log stage and (ii) metabolites that increase in relative concentration towards the stationary stage. For some metabolites, the mid- and late stages of growth are more similar (in the same cluster) than the early stage of growth based on relative concentrations and vice-versa.

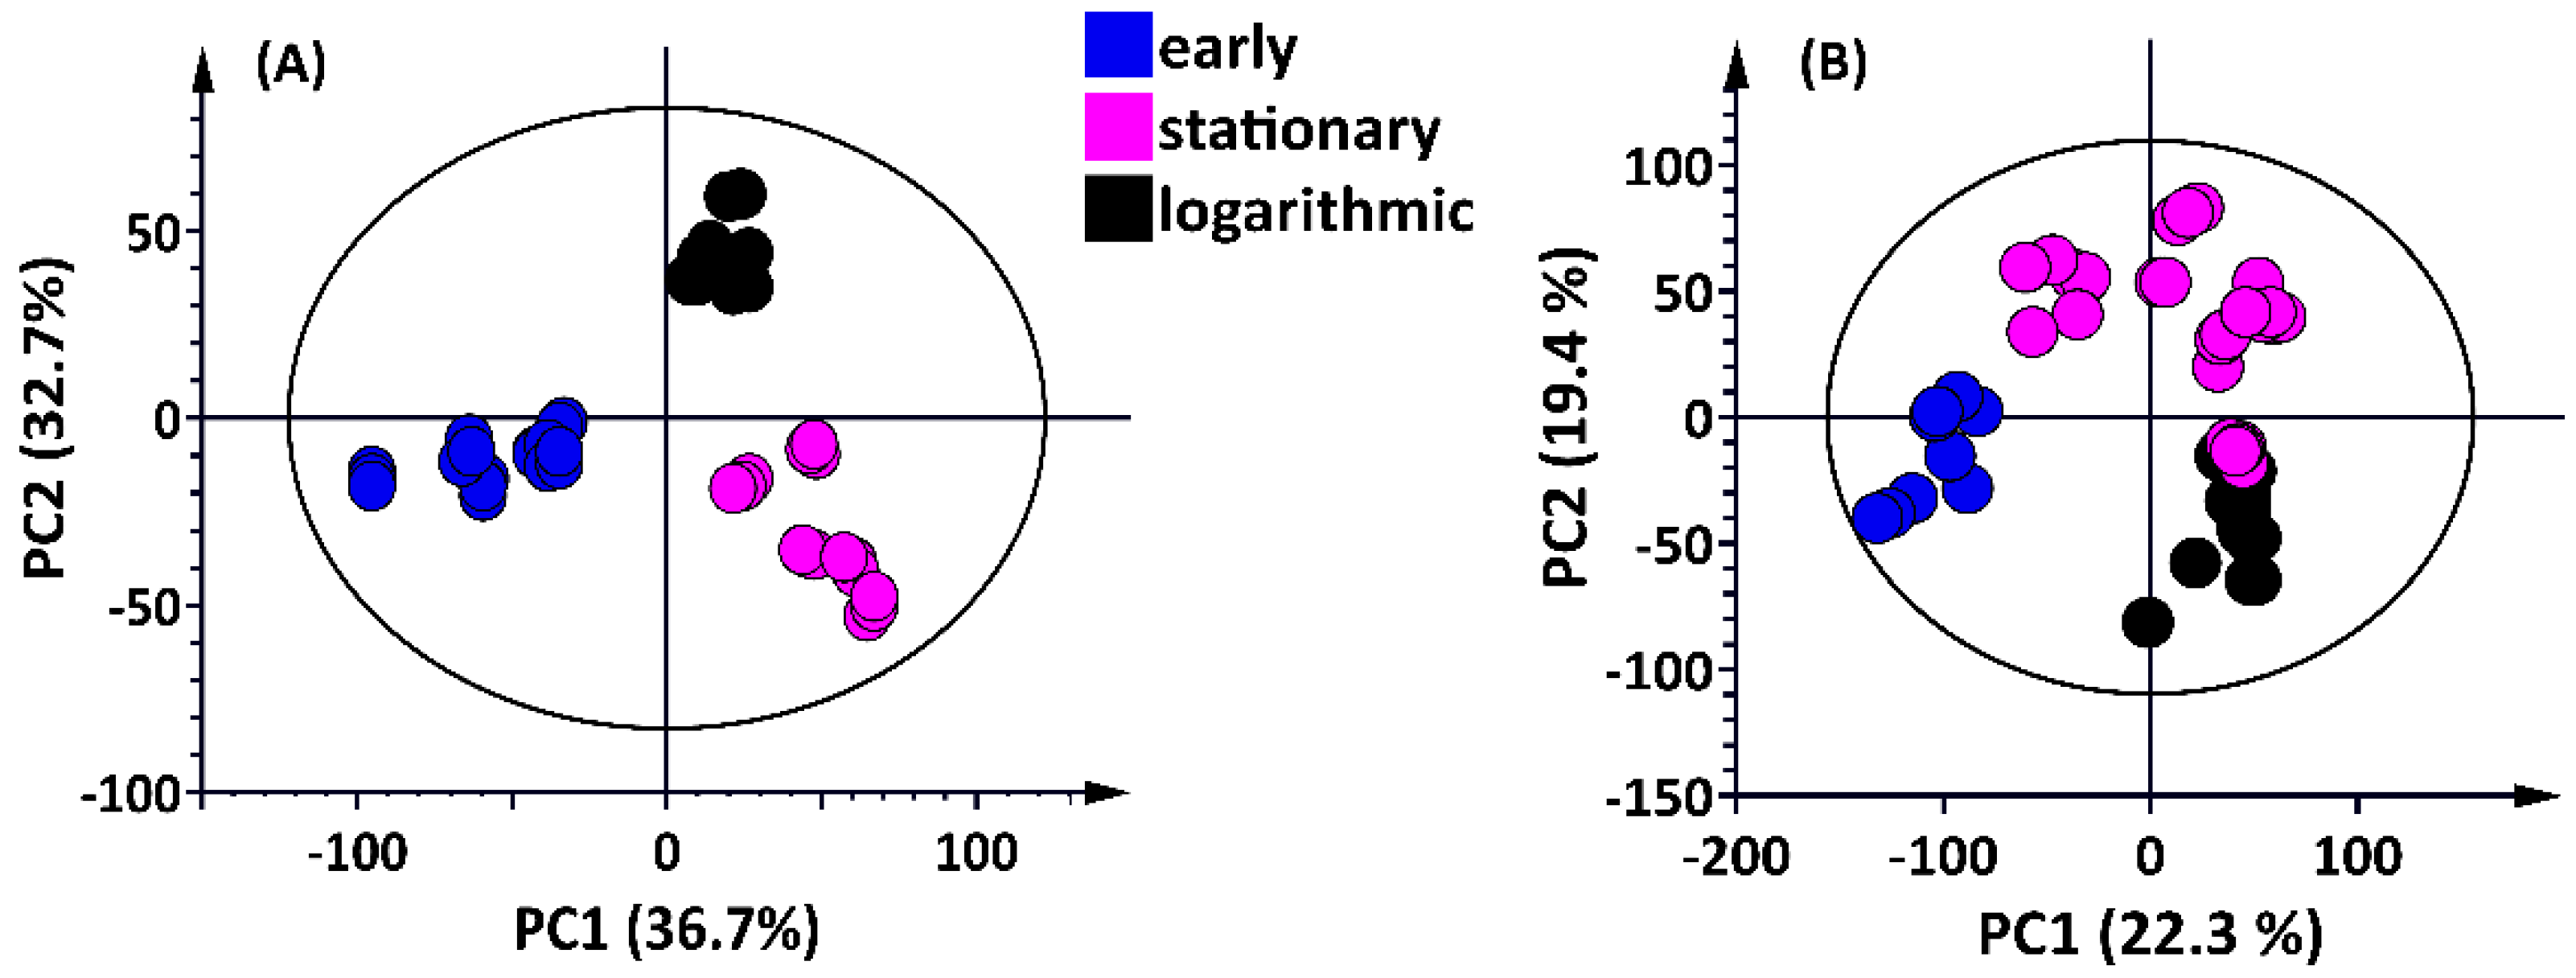
2.2. NMR Multivariate Analyses, Metabolite Annotation and Relative Quantification

1H NMR analyses were carried out to focus on the yet uncharacterized H. roseonigra as shown in Figure 3A. The cells were harvested over the 14 d period (0, 4, 6, 10, 14 d). The intracellular metabolites were extracted with methanol and the dried samples were reconstituted with D2O.
The general pattern observed in Figure 3A is the increase in the intensity of peaks with aging of the culture. Complex resonances are clearly visible due to aliphatic amino acid methyl groups (0–3.5 ppm) and sugar anomeric positions (3.0–6.5 ppm). However, due to the complexity of the obtained raw data shown on the 1H spectra, statistical multivariate analyses were also performed to define both similarities and differences across samples of different growth stages as shown in Figure 3B. The graphical visualization generated by the model reveals separation/clustering in the score space between samples from different growth stages. The computed PCA model facilitated the evaluation of the distribution of samples, with gradual overlapping of metabolomic features associated with the early- and log stages.

Metabolite Annotation and Relative Quantification of NMR Analyzed Compounds

Annotation of the metabolites was carried out at level 2 of the Metabolomic Standards Initiative (MSI) using a reference to the literature where 1H NMR metabolite profiling of fungal species was reported [25,26], as well as the Yeast Metabolome Database (YMBD, http://www.ymdb.ca/, accessed on 15 June 2020). The 1H spectra were characterized by three main regions as shown in Figure S7, namely, a low-field region between 4.0 and 3.2 ppm with intense signals due to anomeric protons of sugar units, a mid-field region between 3.1 and 1.8 with signals associated with amino acids, and a high-field region between 1.6 and 0.8 ppm with strong signals due to aliphatic protons of fatty acids [11]. A total of 27 metabolites were annotated across the different growth/developmental stages as listed in Table 2.
Similar to the workflow for the UHPLC–MS analysis, the calculation of relative concentrations was carried out for a few selected metabolites (representative of the assigned classes), analyzed on the 1H NMR platform. Average peak intensity values were used to obtain the semi-quantitative approximation of the selected metabolites (Table 2). The alcohol ethanol (43) seemingly has the highest concentration, followed by the amino acid valine (20), with the fatty acids linoleic acid (30) and palmitic acid (-OCH3 derivative) (33) and the sugar alcohol galactitol (37) with relatively similar concentrations, and lastly, citrate and succinate as the organic acids (40 and 41) (Figure S8).

2.3. Pathway Mapping and Network Correlation Analysis

Although based on a relatively small number of annotated metabolites, eight pathways were found to be significantly active with a high impact factor in H. roseonigra across the growth/developmental stages as summarized in Figure 4 and listed in Table S2. The pathways with the highest impact were selected to reveal the inter-relations of the participating metabolites as well as the shift in pathways as the cells progress through the different stages of growth (Figure 5A,B), revealing primary metabolism to be more active in the early growth stage.
The MetPA module facilitated the pathway network topological analysis and visualization using a hypergeometric test algorithm and ‘relative betweenness centrality’ parameter as shown in Figure 5A,B. Thus, based on the annotated metabolites (Table 1 and Table 2), pathway analysis with MetPA revealed that eight metabolic pathways out of a total of 35 (Table S3) had a significant impact (impact score ˃ 0.12). These most significant pathways include alanine-, aspartate-, and glutamate metabolism, glutathione metabolism, citrate cycle (TCA cycle), glycerolipid metabolism, and fatty acid degradation, among others.
The metabolic pathways significantly active in H. roseonigra, as revealed by pathway analysis above using MetPA, are evidently highly interconnected, as demonstrated by the pathway topology (Figure 5B). However, the topology analysis could only highlight the compounds in a metabolic pathway. Thus, a network correlation analysis (Figure S9) was carried out using the KEGG mapper module to highlight the interconnectedness of these significant pathways as well as to reveal the participation of each metabolite in different pathways. These pathways belong to the closest species available (Saccharomyces cerevisiae) in the KEGG database. The network correlation analysis revealed the major metabolic pathways in H. roseonigra over the growth period to include carbohydrate metabolism, lipid metabolism, amino acid metabolism, metabolism of cofactors and vitamins, biosynthesis of terpenoids and polyketides, and biosynthesis of other secondary metabolites.

3. Discussion

In a separate study, the bioconversion of sclareol under bioreactor conditions (monitored by LC-MS and NMR) showed that the production of ambradiol by cells in the stationary phase was essentially completed over a period of 3–4 days [17]. In batch culture, the culture environment is continuously changing due to substrate consumption and by-product production. In addition, differential gene expression during the growth stages of an organism may allow the organism to metabolize new or added (e.g., xenobiotic) substrates. Here, we set out to explore a spectrum of both primary and secondary metabolites (from the endo- and exo-metabolomes) of H. roseonigra that are detectable in any of the growth stages. To accomplish this goal, cells were grown in Erlenmeyer flasks and equal volume aliquots of the suspensions were harvested on specified days and extracted using technique (LC–MS and NMR)-compatible protocols as described.
Untargeted metabolomics experiments function on the premise that there is little to no prior knowledge of the metabolites in the sample being analyzed. Experiments therefore rely on the collection of as many data as possible. As a result, data analysis is more complex and challenging. This contribution presents the use of parallel analytical platforms (UHPLC, MS, and NMR) for metabolomic profiling. While the majority of metabolomic studies use a single analytical platform, there is an increasing appreciation of the inherent value of combining NMR and MS as highly complementary techniques for metabolomics [27].
The utilization of different solvent extraction techniques and parallel analytical platforms, along with several multivariate data analytical tools, afforded a reasonable coverage and comprehension of the metabolome under study. In addition, the variables of the endo- and exometabolomes (metabo-fingerprinting and metabo-footprinting, respectively), as well as the mode of ionization, were also introduced to widen the chemical space of the extractable metabolome of H. roseonigra. A total of 45 discriminatory metabolites were annotated at different stages of growth and development, belonging to chemical classes such as vitamins, sugars, amino acids, dipeptides, fatty acids, organic acids, purine intermediates, ribonucleotides, hydrocarbons (alkanes), and terpenes. The annotated metabolites, in addition to 30 other non-polar metabolites (including squalene and a range of alkanes), annotated from a previous study [16], were effectively mapped into the corresponding metabolic pathways.

3.1. UHPLC–MS and Multivariate Data Analyses

Here, methanolic- and acetonic intracellular extracts were analyzed on UHPLC–MS using both ESI(−) and (+) modes as shown in Figure 1. To increase the informational content of the metabolomic space, metabolites secreted into the extracellular medium were also of interest. Methanolic- and acetonic extracellular extracts were accordingly analyzed by UHPLC–MS using both ESI modes as shown in Figure S2. A differential stage-related clustering of the samples was observed with the PCA models (Figure 3 and Figures S3–S5).
Wittmann and colleagues [28] investigated the effect of culture age on metabolite pools by profiling intracellular metabolites during the yeast cell cycle using LC–MS. Using a similar approach, the differences highlighted across the samples, i.e., the presence or absence of several intracellular metabolites over the period of growth, therefore demonstrate the effect of culture age on the endo-metabolome of H. roseonigra. In essence, a particular growth/development stage is evidently represented by a specific subset of intracellular metabolites. A substantial amount of fungal secondary metabolism is represented by a significant subset of the exo-metabolome (the secreted metabolites) [29]. Noteworthily, as observed above, the general peak intensity, as evident from the BPI-MS chromatograms, was found to increase with the growth/developmental stage, confirming that the culture age (e.g., in the nutrient-limited stationary stage) seemingly influences the exo-metabolome of H. roseonigra.
The data represent an initial report on UHPLC–MS-based metabolite profiling of H. roseonigra. The parallel use of methanol and acetone solvents also facilitated the extraction of metabolites with differing polarities and physicochemical properties. According to the best of our knowledge, this is the first study reporting on the collective presence of metabolites belonging to different classes such as vitamins, signaling molecules, dipeptides, nucleotide intermediates, fatty acids, and sugars in intra- and extracellular extracts of H. roseonigra.
In essence, the different growth/developmental stages seemingly possess different and dynamic metabolome compositions and concentrations, in agreement with the observation obtained from the PCA models. The structurally diverse metabolites, either increasing or decreasing in relative concentration over the growth/developmental stages, are potentially related to the lifestyle of the dimorphic H. roseonigra. Metabolites were categorized as indicated in Table 1 (# 117) and included metabolites involved in purine- and nucleotide metabolism, vitamins/co-enzymes associated with primary metabolism and energy production, and terpenes associated with secondary metabolism.

3.2. NMR and Multivariate Analyses

Similar to the results obtained from UHPLC–MS, the early growth stage seems to possess metabolite profiles similar to the logarithmic stage whereas the stationary stage possesses a different set of metabolites. As already mentioned, the biosynthesis of metabolites is generally associated with cell growth, i.e., differentiation or development [30].
Generally, the observed pattern of the relative concentration of the metabolites is highest in the stationary stage, followed by the log- and early growth/developmental stages, respectively. Noteworthily, the relative quantification could explain the observed pattern distribution on the PCA analysis (Figure 3B), where the early and log stages were observed to be more similar in relation to the stationary stage. Again, the shifting relative concentration patterns across the growth/developmental stages are potentially related to the lifestyle of the dimorphic H. roseonigra. Overall, primary metabolites play essential roles in the growth and development of organisms (as explained below) [3]. Accordingly, these primary metabolites are expected to dominate in extracts from the single cells in the culture during the exponential stage of growth. As listed in Table 2, the metabolites annotated based on NMR analyses (# 1845) included amino acids, sugars, fatty acids, organic acids, alcohols, antioxidants, and co-factors. Fungal species seem to biosynthesize most of the secondary metabolites at the filamentous stage of growth [30], which could explain the difference in the relative concentration patterns of these secondary metabolites compared to the late log- to stationary stages.

3.3. Pathway Mapping and Network Correlation Analysis

Since a large section of an organism’s metabolome remains obscure (even with different solvent extraction procedures and different analytical platforms), mapping annotated metabolites to metabolic pathways might generate deeper insights by looking at a set of metabolites with some relationship between them. In this regard, MetaboAnalyst is a comprehensive pathway analysis web-based tool, designed for processing, analyzing, and visualizing metabolomic data within the biological context of metabolic pathways and supplies a ‘biochemical roadmap’ of metabolic pathways. The significant metabolic pathways involved in a particular metabolomic study are determined by MetPA through pathway topological characteristics analysis (Figure 5) [21].
The impact of a metabolic pathway is measured as the collective of the significant measures of the corresponding metabolites normalized by the sum of the significant measures of the total metabolites in each pathway [31,32]. Although based on a limited number of annotated metabolites with KEGG identifiers, these results suggest that the basal metabolism of H. roseonigra involves a multifaceted cellular metabolism network characterized by several metabolic pathways, i.e., eight significant pathways. As already mentioned, the constituents of these three metabolic pathways (carbohydrate metabolism, lipid metabolism, and amino acid metabolism) are fundamental in all living organisms, demonstrating a wide spectrum of essential biological roles. Glutathione metabolism is involved in maintaining redox homeostasis and a balanced physiological state. It is therefore not surprising that this pathway has the highest impact as GSH is evidently present at high concentrations in yeasts and filamentous fungi [33]. During the growth phase, nitrogen is essential for the synthesis of nucleic acids and proteins, required for cell proliferation. When nitrogen becomes limiting, these processes are slowed, and the rate of growth decreases rapidly. The excess carbon is then channeled towards alternative pathways, e.g., the synthesis of lipids [34]. Highlighting the fatty acid degradation pathway could therefore explain the presence of alkanes as they participate in energy generation [35,36]. In a prior communication, we reported that the relative concentrations of alkanes increased as the microorganism developed, where they were at their highest at the stationary stage [16], likely resulting from further fatty acid breakdown with time. On the other hand, the nitrogen metabolism/ammonium assimilation is reported to be a fundamental biological step to most soil microorganisms [37], therefore explaining the high impact of the alanine, aspartate, and glutamate metabolism.
The sugar derivatives (such as 2-deoxyribose 5-phosphate (8) and galactose-1-phosphate (35)) and fatty acids (such as linoleic acid (30)) reflect nucleotide synthesis and lipid metabolism, respectively, and evidently provide the intermediates and energy necessary for the fundamental cellular functionality [38]. A number of primary/secondary amino acids and the derivatives thereof serve as precursors for the biosynthesis of secondary metabolites such as terpenoids. In turn, the metabolism of cofactors and vitamins serves the purpose of facilitating all the other essential biosynthetic pathways [39].
The presence of precursors and final products (such as 5-methyl-tetrahydrofolate (11) and serine (28), respectively) [40] belonging to different metabolism pathways confirms the interconnectedness displayed in the network correlation analysis (Figure S9). Furthermore, this is further validated by the presence of metabolites that serve as co-factors in both primary and secondary metabolism, such as the role played by thiamine diphosphate (3) as a co-factor in amino acid biosynthesis [41].
Although not identified amongst the annotated metabolites, isopentenyl diphosphate is the central intermediate in the biosynthesis of fungal terpenes and steroids and an essential precursor in this pathway [42]. A range of terpenes do occur in both yeasts and fungi, and the presence of a functional terpene pathway is suggested by the presence of reynosin (12). Metabolic pathways involved in specialized fungal metabolism are often silent or ‘cryptic’, and only detectable under certain conditions or growth stages [43]. This could potentially explain the inducible ability of H. roseonigra to metabolize sclareol, a diterpene metabolite [20,44,45]. In this regard, from a biological perspective, the biotransformation of sclareol may be regarded as an elimination of a hydrophobic xenobiotic chemical through detoxifying steps. Potentially, these might involve oxidoreductases, cytochrome P450 monooxygenases, lactonases, aldehyde dehydrogenases [19], racemases, and epimerases [17].

4. Materials and Methods

4.1. Growth of Hyphozyma roseonigra

The H. roseonigra strain used in this study was purchased from the ATCC: The Global Bioresource Centre (https://www.atcc.org/, accessed on 15 January 2017), with the accession number 20624. Saturated cultures prepared in potato dextrose broth (PDB) as the growth medium was stored as 15% glycerol stocks at −80 °C. Working cultures were grown at 28 °C for a period of 14 d on potato dextrose agar (Merck, Wadeville, South Africa) as described by [16] and exhibited a typical growth pattern of yeast with pink coloration as the cultures aged and progressed to a filamentous morphology.
Batch culture in liquid medium—H. roseonigra suspension cultures grown in PDB (24 g/L, Becton Dickinson, Woodmead, South Africa) were initiated from frozen cell stocks stored at −80 °C. Saturated overnight cultures were prepared, and the sterile PDB growth medium (20 mL in 250 mL Erlenmeyer flasks) was inoculated to reach a starting A600 = 0.015. Cells were grown in Erlenmeyer flasks on an orbital shaker at 140 r.p.m. in a temperature-controlled room at 22–24 °C for 14 d. These growth conditions were established in shake-based batch cultures [18], similar to bioreactor conditions but with the purpose of slowing down the growth rate in order to study the metabolomes of the growth stages in detail. The growth profile under these conditions during the period of investigation is shown in Figure S1.
Aliquots of the cell suspensions were harvested every second day over a total growth period of 14 d. At each harvest point, the optical density was measured at 600 nm as a quantitative measure of cell growth (Figure S1). Each determination was performed in triplicate and based on three independent biological replicates.

4.2. Harvesting of Cells, Metabolite Extraction, and Sample Preparation

For harvesting, the suspensions were centrifuged in a bench-top swinging-bucket centrifuge (Beckman Allegra, Midrand, South Africa) at 5525× g for 15 min at 4 °C using pre-weighed 5 mL Eppendorf tubes (Lasec, Midrand, South Africa) to pellet the cells and determine the accumulated wet weight of the cells. The samples were kept in an ice bucket to reduce metabolic activity and limit possible non-enzymatic reactions before and after each mentioned step. Harvesting of cells was conducted in duplicate (2 × 10 mL, 10 mL for each analytical platform) at different time points over the two-week period by centrifugation at 5525× g for 15 min at 4 °C, allowing for the separation of the supernatant (growth medium) and the pelleted cells. Both sample sets (supernatants and cell pellets) were snap-frozen to quench metabolic activity and stored at −80 °C.
For downstream intracellular analyses (metabo-fingerprinting), 20 mL of cold (4–5 °C) methanol was added to 2 g of the pellet (a 1:10 w/v ratio was maintained throughout for matching/normalizing extraction conditions) for methanolic and acetonic extraction, respectively, and homogenized using an ultrasonic probe homogenizer (Bandelin Sonopuls, Berlin, Germany) at 80% intensity for 1 min × 2 cycles each prior to centrifugation at 5525× g for 15 min at 4 °C. The supernatants obtained thereafter were concentrated under vacuum to ±1 mL using a rotary evaporator, and dried overnight using a dry heat bath at 50 °C. Similarly, for downstream extracellular (secreted metabolites) analyses (metabo-footprinting), the supernatants were concentrated to ±1 mL using a rotary evaporator and freeze dried before extraction with 10 mL of methanol. The acetonic extracts were prepared in a similar manner. All the dried samples were reconstituted with 500 µL of methanol and vigorously vortexed for 30 s before filtration through 0.22 µm nylon filters and were placed in UHPLC glass vials fitted with inserts and slitted caps. The samples were labelled appropriately and kept at 4 °C until analyses.
For NMR analysis, cells were similarly harvested over the 14 d period and centrifuged in pre-weighed 5 mL Eppendorf tubes (Lasec, Midrand, South Africa) at 5525× g for 15 min at 4 °C to determine the accumulated wet weight. The obtained pellets were stored at −80 °C. Methanol (3 mL) was added to the tubes and the pellets were freeze-thawed in liquid nitrogen. Phosphate buffer saline (PBS) was then added prior to homogenization using an ultrasonic probe sonicator as described above. Following centrifugation of the homogenates, a speedvac instrument (centrifugal rotary evaporation under vacuum) was used to concentrate 500 µL of the supernatants over a 10 h period. The dried samples were reconstituted using 500 µL of 99.6% D2O (Sigma-Aldrich, Munich, Germany) and placed into pre-labelled 5 mm NMR tubes. Prior to analysis, 0.01% trimethylsilylpropanoic acid (TSP) was prepared and added to each sample as an internal reference/calibrant.

4.3. Ultra-High Performance Liquid Chromatography–Mass Spectrometry (UHPLC–MS)

Liquid-chromatographic separation of the extracts was performed on a Waters Acquity UHPLC HSS T3 reverse phase column (150 × 2.1 mm, 1.7 μm) thermostatted at 60 °C, with gradient elution. The UHPLC system was coupled in tandem with a SYNAPT G1 high-definition (HD)–MS–qTOF mass spectrometer (Waters Corporation, Milford, MA, USA). A binary solvent system consisting of eluent A (0.1% formic acid in MilliQ water) and B (0.1% formic acid in acetonitrile (Romil SpS Chemistry, Cambridge, UK)) was used. The injection volume was set at 5 μL. The initial conditions were kept constant for 0.1 min at 95% A at a flow rate of 0.4 mL/min. The gradient elution was then introduced to change chromatographic conditions to 10% A over 0.1–16 min and held for 1 min. The analytical column was restored to the initial conditions at 18 min for 2 min, resulting in a run time of 20 min. Chromatographic elution was monitored with a photodiode array (PDA) detector scanning between 200 and 500 nm (1.2 nm resolution) collecting 20 points/s. Post-PDA detection, the SYNAPT G1 mass spectrometer (Waters Corporation, Manchester, UK) was used in V-optics and operated in positive and negative electrospray ionization (ESI) modes to detect the compounds of interest.
The MS settings were as follows: Capillary voltage of 2.5 kV, sample cone voltage of 60 V, extraction cone voltage of 5 V, collision energy of 3 eV, detector voltage of 1660 V, source temperature of 120 °C, m/z range of 100–1100, scan time of 0.2 s, and interscan time of 0.02 s, in centroid data mode. High-purity Nitrogen gas was used as desolvation gas at 450 °C and cone gas at 50 L/h. Real-time optimization of the mass accuracy was achieved using a lock spray source [46]. Leucine enkephalin (50 pg/mL, [M + H]+ = 556.2771 Da and [M − H] = 554.2615 Da) was used as a reference calibrant at a flow rate of 0.1 mL/min, sampled every 15 s and producing an average intensity of 350 counts/scan in centroid mode. The mass accuracy window was 0.5 Da, with a typical mass accuracy ranging from 1 to 3 mDa. Prior to analyses, the triplicate biological samples were initially randomized to provide stochastic stratification in sample acquisition in order to reduce measurement bias. The sample lists were inclusive of triple quality control (QC) pooled samples, included to monitor and evaluate the robustness of the system and for non-linear signal correction, as well as solvent blanks. Each sample was analyzed in triplicate for technical repeats, generating n = 9 required for multivariate statistical analysis.
Downstream structure elucidation and compound identification were achieved by generating molecular fragment information. Herein, a data-independent acquisition (DIA) method, namely MSE, was applied. MS analyses were set to carry out non-fragmented as well as five fragmenting experiments simultaneously by applying alternating collision energy of 0 eV (unfragmented) and from 10 to 50 eV (fragmented).

4.4. Nuclear Magnetic Resonance Analysis

As described, the dried samples were reconstituted using 500 µL of 99.6% D2O (Sigma, Munich, Germany) and placed into pre-labelled 5 mm NMR tubes. Prior to analysis, TSP was prepared and added to each sample at 0.01% as a calibrant. All one-dimensional (1D) 1H NMR spectra were acquired at 25 °C on a Bruker Avance III 500 MHz NMR spectrometer operating at 500.13 MHz, using Topspin 3.2 processing software (Bruker, Biospin, Germany). The NMR spectrometer was equipped with a broadband inverse (BBI) probe. To ensure adequate shimming and pre-saturation, a standard 1D 1H pre-saturation (ZGPR) was first collected for each sample. A 1D Nuclear Overhauser Effect Spectroscopy (NOESY) presaturation sequence (NOESY-PRESET-1D) was used for effective water and solvent suppression. 1D NOESY spectra were acquired at 25 °C with an acquisition time of 1.64 s, mixing time of 0.05 s, relaxation delay of 2 s, and 128 scans collected with a receiver gain of 203 decibels (dB) and spectral width of 19.99 parts per million (ppm). The phase was adjusted prior to baseline correction, which was first performed automatically. The corrected spectra were referenced to the signal of TSP at δ 0.00 ppm (Bruker, Biospin, Germany) for segmentation into bins with an equal width of 0.04 ppm. The water region (δ 4.4–5.5 ppm) was excluded as this region could potentially interfere with significant regions.

4.5. Data Processing for LC–MS and NMR

Prior to data pre-processing and pre-treatment, data visualization was carried out. The raw UHPLC–MS data were visualized and processed using MassLynx XSTM 4.1 software (Waters Corporation, Manchester, UK). The matrix outputs obtained consisted of Rt-m/z variable pairs, with m/z peak intensity for each sample. The raw data from centroid ESI (+/−) ionization modes were analyzed. The parameters of the MarkerLynx application were set to analyze the 2–20 min retention time (Rt) range of the mass chromatogram, mass range 100–1000 Da, and alignment of peaks across samples within the range of ±0.05 Da and ±0.20 min mass and Rt windows, respectively; and mass tolerance of 0.01 Da.
Following peak detection, the corresponding ions were analyzed (maximum intensity, Rt. and m/z) and recorded for all the samples. Data normalization was based on total ion intensities of each defined peak to further ensure metabolite levels by biomass concentration were normalized to avoid misleading the biological interpretation of the results. Prior to calculating intensities, the software performed a patented modified Savitzky-Golay smoothing and integration. The data matrix obtained from MassLynx was exported into SIMCA (soft independent modelling of class analogy)—ver. 15.0 software with the ‘Omics’ skin (Sartorius Stedim Biotech, Umeå, Sweden) for multivariate data analysis and modeling.
Similarly, for NMR spectra, data visualization and spectral alignment were also carried out prior to data pre-processing. The data were Fourier Transformed (FT) using zero and first-order fills in TopSpin 3.1. (Bruker Biospin, Rheinstetten, Germany). All processed spectra were subjected to the AMIX-viewer (Bruker Biospin, Germany) for segmentation. The obtained data matrices were exported to SIMCA 15.1 software for multivariate data analysis and modeling.

4.6. Multivariate Data Analysis and Statistical Modeling

Multivariate data analysis (MVDA) and modeling were conducted using the SIMCA (soft independent modelling of class analogy)—ver. 15.0 software with the ‘Omics’ skin (Sartorius Stedim Biotech, Umeå, Sweden) on Pareto-scaled data. Missing values were managed using the default SIMCA algorithm known as the Nonlinear Iterative Partial Least Squares (NIPALS) algorithm. In addition, an efficient cross-validation (CV) procedure was employed during the process of computing the models. The statistical models for MVDA generated by SIMCA included PCA (principal component analysis) and hierarchical cluster analysis (HCA) modeling, among others.
PCA is an explorative, unsupervised method that reduces/minimizes the multidimensionality of data and thus provides a visual comparison between sample groups without a priori information on sample classes. The variance within a multivariate data set is based on principal components (PCs), where the first component describes the greatest percentage of variation and so forth—and ultimately models the total variance of the complete dataset. In the process of creating a PCA model, an (X) matrix generated from a certain number of samples (n) within a couple of parameters (e.g., peak area for MS) is projected onto a multidimensional space [47,48,49,50].
The statistical significance of the models is determined by the outcomes of cross-validation and represented by different quality parameters, such as R2 and Q2 metrics. The quality of the PCA models was evaluated based on model diagnostic tools, i.e., the goodness-of-fit parameter (explained variation), R2X (cum) and predictive ability parameter (predicted variation), and Q2 (cum) [48].

4.7. Metabolite Annotation

Metabolite annotation/putative identification was carried out according to the four standard levels proposed by the Chemical Analysis Working Group (CWAG) and originating from the International Metabolomics Society [24]. For UHPLC–MS analysis, an empirical formula was calculated for each peak of interest based on the m/z values and searched against databases such as PubChem (https://pubchem.ncbi.nlm.nih.gov/, accessed on 15 May 2021) and the Yeast Metabolome Database (http://www.ymdb.ca/, accessed on 19 May 2021), the Dictionary of Natural Products (http://dnp.chemnetbase.com/faces/chemical/ChemicalSearch.xhtml, accessed on 21 May 2021), and ChemSpider (http://www.chemspider.com/, accessed on 25 May 2021), considering possible adduct formation.
The chemical structures were confirmed by inspecting the MSE information derived from the MS analyses under the five different fragmentation conditions. Annotation was thus based upon physicochemical properties and/or spectral similarity with public/commercial spectral libraries such as MS-DIAL (Mass Spectrometry-Data Independent Analysis software, http://prime.psc.riken.jp, accessed on 27 May 2021). The NMR metabolites were annotated using the Yeast Metabolome Database (YMBD, http://www.ymdb.ca/) and the Human Metabolome Database, (HMDB, https://www.hmdb.ca, accessed on 31 May 2021), with a tolerance of ±4 ppm, as well as references from the literature [11,12,13,25,26,51].
The Taverna workbench criteria were initially met by formatting a data matrix from MarkerLynx-based data processing. The workflows herein include correlation analysis, metabolic feature annotation, and metabolite annotation. The Taverna Metabolite ID process was composed of three key workflows: (i) Pearson-based correlation analysis (List CorrData), (ii) metabolic feature annotation (annotate Massmatch)—allowing for the grouping of ion peaks with comparable properties such as retention time, and annotating features with the type of m/z ion (molecular ion, isotope, adduct, and others) presumed to originate from the same compound, where each m/z ion’s elemental composition/molecular formula (MF) was then computed automatically; and (iii) metabolite annotation (matchMF-MF) of the computed MF (from the output file from workflow 2) was automatically compared and matched to the MF from a pre-defined reference list of metabolites [20].
Following metabolite annotation, heat maps were constructed using the MetaboAnalyst bioinformatics tool suite (version 3.0; http://www.metaboanalyst.ca/, accessed on 5 June 2021) [21]. Average peak intensities (n = 9) were used to construct heat maps illustrating differences in the relative concentrations of analytes selected from different classes. Heat maps allow the visualization of large multidimensional datasets and identify metabolic patterns under similar experimental conditions. In addition, heat maps can be used to locate hidden groups among identified metabolites and associations between experimental groups and metabolic changes.

4.8. Metabolomics Pathway Analysis and Network Correlation Analyses

Global metabolic interrelationships such as metabolic pathway mapping and feature-based network correlation analyses were generated using annotated metabolite data, i.e., metabolite identity, changes in levels and relationships between metabolites. Significant metabolic pathways defining physiological responses of H. roseonigra to developmental growth stages were determined using Metabolomics Pathway Analysis (MetPA), an integral module of the MetaboAnalyst bioinformatics tool suite (version 3.0; http://www.metaboanalyst.ca/, accessed on 5 June 2021). This online software predicts pathway activity from ranked UHPLC-MS peaks based on matching patterns of putatively annotated metabolites. This enabled the elucidation of the annotated metabolites and altered metabolic pathways involved in the conditions under study [21].
The identified significant metabolites (with their respective Kyoto Encyclopedia of Genes and Genomes (KEGG; https://www.genome.jp/kegg/identifiers, accessed on 8 June 2021) were uploaded into the MetPA tool for pathway topological analysis and the possible biological roles were inferred/evaluated by enrichment analysis [20,21]. The overall significance of a pathway enrichment is estimated by ranking the p-value from real data among the p-values from permutation data to adjust for type I error [21]. As a complementary approach, the interconnectedness of the active pathways was modeled using KEGG MAPPER (https://www.genome.jp/kegg/mapper.html, accessed on 8 June 2021) by uploading KEGG identifiers of the tentatively annotated metabolites via a searcher pathway option, where compounds are searched against KEGG pathway maps.
Network correlation analyses were developed to examine direct biochemical associations. Again, assigned KEGG identifiers of each annotated metabolite were uploaded on the KEGG mapping tool (https://www.genome.jp/kegg/tool/map_pathway1.html, accessed on 8 June 2021), using the organism-specific search mode for Saccharomyces cerevisiae. The network was visualized using Cytoscape version 2.8.2 tool (https://cytoscape.org/, accessed on 12 June 2021), and network characteristic mapping reflected chemometric modeling information via network edge (or link) and nodes (or vertices) features [22]. The centrality parameter is a quantitative measure of the position of a node relative to the other nodes, commonly applied in the estimation of a node’s relative significance in network organization. Considering that metabolic networks are directed graphs, the significant role played by a compound is determined using ‘relative betweenness centrality’ and ‘out degree centrality’ in MetPA. The pathway impact is measured as the collective of the significant measures of the corresponding metabolites normalized by the sum of the significant measures of the total metabolites in each pathway.

5. Conclusions

We set out to explore the ‘chemical space’, of H. roseonigra, i.e., the spectrum of metabolites from the intracellular- and extracellular metabolomes, detectable in any of the growth stages and extractable by methanol or acetone. The adopted approach was developed to gain insight into the metabolome of the organism in order to ultimately improve the understanding of its metabolic capabilities.
The metabolome profiles obtained from LC-MS analyses are indications of the metabolic events operative at that particular point in time or growth stage. Generally, the initial and logarithmic stage is associated with primary metabolism and the stationary stage with secondary metabolism. H. roseonigra may therefore have different metabolic capabilities depending on its stage of growth. This is information that is useful in optimizing conditions conducive to biocatalytic applications. The biological roles of the annotated metabolites range from housekeeping functions such as energy production to secondary metabolism in support of the adaptation to environmental variables such as nutrient limitation and stress conditions. Noteworthily, the detection of terpene metabolites such as squalene and reynosin suggests the presence of some latent terpene pathway activity. However, this was not found to be among the identified significant pathways under the applied experimental conditions. This suggests that pre-induction with sclareol, a diterpenoid, might be required to upregulate the appropriate pathways and enzymes for its metabolism (e.g., enzymes involved in functionalization of terpene scaffolds). Therefore, the exploration of the underlying biochemistry of H. roseonigra established a foundation and facilitated the comprehension required for the investigation into its biocatalytic ability. The use of UHPLC–MS and NMR for metabolite profiling illustrated the ability of a metabolomics approach to gain some understanding of the metabolism of less-characterized microorganisms. Interesting to note is the similar findings regarding the predominance of primary metabolic pathways across both the UHPLC–MS and NMR platforms.
Future investigations involving other -omics approaches will facilitate establishing the association between the biosynthesis of the annotated metabolites and the differentiation processes of H. roseonigra. Considering the relevance of this microorganism for the production of high-value compounds, such a link would support the exploitation of the underlying biochemistry in order to improve bioconversion yields. In conclusion, this study has generated novel findings about the active metabolic pathways of H. roseonigra and established a metabolomics-based framework to gain deeper insight into the biochemical processes in support of its use as a cellular biocatalyst and cell factory.

Supplementary Materials

The following supporting information can be downloaded at: https://www.mdpi.com/article/10.3390/catal12101225/s1, Figure S1: Assessment of the growth of the Hyphozyma roseonigra in batch culture, Figure S2: UHPLC–MS separation and detection of extracellular methanolic- and acetonic extracts of H. roseonigra, Figure S3: The PCA models of methanolic- and acetonic extracellular extracts of H. roseonigra analyzed using UHPLC–MS in ESI(−) mode, Figure S4: PCA models of methanolic- and acetonic intracellular extracts of H. roseonigra analyzed using LC–MS in ESI(+) mode, Figure S5: PCA models of methanolic- and acetonic extracellular extracts of H. roseonigra analyzed using LC–MS in ESI(+) mode, Figure S6: Heat map showing selected annotated metabolites of acetonic and methanolic extracts of H. roseonigra across the early adaptation-, stationary-, and log stages, Figure S7: 1H NMR spectrum and class annotation of metabolites present in methanolic extracts of H. roseonigra, Figure S8: Semi-quantitative presentation of intracellular metabolites present in methanolic extracts of H. roseonigra, Figure S9: Biochemical roadmap: A network correlation analysis of metabolic pathways active in Hyphozyma roseonigra when grown in potato dextrose broth medium in batch culture, Table S1: List of annotated features (metabolites) present in acetonic and methanolic extracts of Hyphozyma roseonigra grown in batch culture and annotated from UHPLC–MS data, Table S2: Annotation of metabolites in methanolic extracts of Hyphozyma roseonigra analyzed by 1H NMR, Table S3: Significant metabolic pathways determined to be active in Hyphozyma roseonigra, inferred from Metabolomics Pathway Analysis. References [25,26,51] are cited in the Supplementary Materials.

Author Contributions

I.A.D. and L.H.S. conceptualized and supervised the project; E.N.N. performed the experimental work; P.A.S. performed the LC–MS analysis and L.S. supervised the NMR analysis; E.N.N. analyzed the data. All authors contributed to writing and editing the manuscript. All authors have read and agreed to the published version of the manuscript.

Funding

The research was supported by the Council for Scientific and Industrial Research and the University of Johannesburg, South Africa, but received no external funding.

Data Availability Statement

Data are contained within the article or supplementary material. Raw data, analyses, and data processing information were deposited into the Mendeley Data repository (https://data.mendeley.com/datasets/89x6rmdfx3/draft?a=2a990601-87f0-424e-90c8-039b602110b1, accessed on 15 August 2022).

Acknowledgments

N. Baloyi and A. Hussan are acknowledged for their contributions to the experimental and data analysis of the NMR section.

Conflicts of Interest

The authors declare no conflict of interest. The funders had no role in the design of the study; in the collection, analyses, or interpretation of data; in the writing of the manuscript; or in the decision to publish the results.

References

  1. Wohlgemuth, R. Biocatalysis—Key to sustainable industrial chemistry. Curr. Opin. Biotechnol. 2010, 21, 713–724. [Google Scholar] [CrossRef]
  2. Allendes, J.A.; Bustos, D.A.; Pacciaroni, A.D.V.; Sosa, V.E.; Bustos, D.A. Microbial functionalization of (–)-ambroxide by filamentous fungi. Biocatal. Biotransform. 2011, 29, 83–86. [Google Scholar] [CrossRef]
  3. Cheetham, P.S.J. The use of biotransformations for the production of flavours and fragrances. Trends Biotechnol. 1993, 11, 478–488. [Google Scholar] [CrossRef]
  4. De Hoog, G.S.; Smith, M.T. Key to the species of Hyphozyma (yeast-like Hyphomycetes) and description of H. roseonigra sp. nov. Antonie van Leeuwenhoek 1986, 52, 39–44. [Google Scholar] [CrossRef] [PubMed]
  5. Farbood, M.I.; Willis, B.J. Process for Producing Diol and Furan and Microorganism Capable of Same. U.S. Patent 4798799A, 17 January 1989. [Google Scholar]
  6. Steenkamp, L.H.; Taka, M. Process for the Production of Ambrafuran. U.S. Patent 2010/0248316 A1, 30 September 2010. [Google Scholar]
  7. Ncube, E.N.; Steenkamp, L.H.; Dubery, I.A. Ambrafuran (AmbroxTM) synthesis from natural plant product precursors. Molecules 2020, 25, 3851. [Google Scholar] [CrossRef] [PubMed]
  8. Liu, Z.; Rochfort, S. Recent progress in polar metabolite quantification in plants using liquid chromatography—Mass spectrometry (LC-MS). J. Integr. Plant Biol. 2014, 56, 816–825. [Google Scholar] [CrossRef] [PubMed]
  9. Theodoridis, G.A.; Gika, H.G.; Plumb, R.; Wilson, I.D. Liquid chromatographic methods combined with mass spectrometry in metabolomics. In Proteomic and Metabolomic Approaches to Biomarker Discovery; Issaq, H., Veenstra, T., Eds.; Elsevier Inc.: Amsterdam, NL, USA, 2020; pp. 149–169. [Google Scholar] [CrossRef]
  10. Şenyuva, H.Z.; Gilbert, J.; Öztürkoǧlu, S. Rapid analysis of fungal cultures and dried figs for secondary metabolites by LC/TOF-MS. Anal. Chim. Acta 2008, 617, 97–106. [Google Scholar] [CrossRef] [PubMed]
  11. Porzel, A.; Farag, M.A.; Mülbradt, J.; Wessjohann, L.A. Metabolite profiling and fingerprinting of Hypericum species: A comparison of MS and NMR metabolomics. Metabolomics 2014, 10, 574–588. [Google Scholar] [CrossRef]
  12. Forgue, P.; Halouska, S.; Werth, M.; Xu, K.; Harris, S.; Powers, R. NMR metabolic profiling of Aspergillus nidulans to monitor drug and protein activity. J. Proteome Res. 2006, 5, 1916–1923. [Google Scholar] [CrossRef]
  13. Ząbek, A.; Klimek-Ochab, M.; Jawień, E.; Młynarz, P. Biodiversity in targeted metabolomics analysis of filamentous fungal pathogens by 1H NMR-based studies. World J. Microbiol. Biotechnol. 2017, 33, 132. [Google Scholar] [CrossRef] [Green Version]
  14. Moco, S.; Bino, R.J.; De Vos, R.C.H.; Vervoort, J. Metabolomics technologies and metabolite identification. Trends Anal. Chem. 2007, 26, 55–866. [Google Scholar] [CrossRef]
  15. Diao, M.; Li, C.; Li, J.; Lu, J.; Xie, N. Probing the biotransformation process of sclareol by resting cells of Hyphozyma roseonigra. J. Agric. Food Chem. 2022, 70, 10563–10570. [Google Scholar] [CrossRef] [PubMed]
  16. Ncube, E.N.; Steenkamp, L.H.; Dubery, I.A. GC–MS based profiling of alkanes in the filamentous yeast Hyphozyma roseonigra (Moesziomyces antarcticus). Biotechnol. Lett. 2019, 41, 859–866. [Google Scholar] [CrossRef] [PubMed]
  17. Ncube, E.N.; Steenkamp, P.A.; van der Westhuyzen, C.; Steenkamp, L.H.; Dubery, I.A. Metabolomics-guided analysis of the biocatalytic conversion of sclareol to ambradiol by Hyphozyma roseonigra. Catalysts 2022, 12, 55. [Google Scholar] [CrossRef]
  18. Ncube, E.N.; Mathiba, K.; Steenkamp, L.H.; Dubery, I.A. Gas chromatographic profiling of the biocatalytic conversion of sclareol to ambradiol by Hyphozyma roseonigra. Biocatal. Biotransform. 2022, 40, 308–312. [Google Scholar] [CrossRef]
  19. Wang, X.; Zhang, X.; Yao, Q.; Hu, D.; Qin, H. Comparative proteomic analyses of Hyphozyma roseonigra ATCC 20624 in response to sclareol. Braz. J. Microbiol. 2019, 50, 79–84. [Google Scholar] [CrossRef] [Green Version]
  20. Carlson, R.; Tugizimana, F.; Steenkamp, P.A.; Dubery, I.A.; Labuschagne, N. Differential metabolic reprogramming in Paenibacillus alvei-primed Sorghum bicolor seedlings in response to Fusarium pseudograminearum infection. Metabolites 2019, 9, 150. [Google Scholar] [CrossRef] [Green Version]
  21. Xia, J.; Wishart, D.S. Metabolomic data processing, analysis, and interpretation using MetaboAnalyst. Curr. Protoc. Bioinformatics 2011, 34, 14.10.1–14.10.48. [Google Scholar] [CrossRef]
  22. Fukushima, A.; Kusano, M. Recent progress in the development of metabolome databases for plant systems biology. Front. Plant Sci. 2013, 4, 73. [Google Scholar] [CrossRef]
  23. De Vijlder, T.; Valkenborg, D.; Lemière, F.; Romijn, E.P.; Laukens, K.; Cuyckens, F. A tutorial in small molecule identification via electrospray ionization-mass spectrometry: The practical art of structural elucidation. Mass Spectrom. Rev. 2018, 37, 607–629. [Google Scholar] [CrossRef]
  24. Sumner, L.W.; Amberg, A.; Barrett, D.; Beale, H.M.; Beger, R.; Daykin, C.A.; Fan, T.W.M.; Fiehn, O.; Goodacre, R.; Griffin, J.L.; et al. Proposed minimum reporting standards for chemical analysis: Chemical Analysis Working Group (CAWG) Metabolomics Standards Initiative (MSI). Metabolomics 2007, 3, 211–221. [Google Scholar] [CrossRef] [PubMed] [Green Version]
  25. Kostidis, S.; Addie, R.D.; Morreau, H.; Mayboroda, O.A.; Giera, M. Quantitative NMR analysis of intra- and extracellular metabolism of mammalian cells: A tutorial. Anal. Chim. Acta 2017, 980, 1–24. [Google Scholar] [CrossRef] [PubMed]
  26. Marante Toledo, F.J.; Mioso, R.; Barrera, J.B.; González González, J.E.; Santana Rodríguez, J.J.; De Laguna, I.H.B. Structural characterization and metabolite profiling of the facultative marine fungus Paecilomyces variotii. Ann. Microbiol. 2012, 6, 1601–1607. [Google Scholar] [CrossRef]
  27. Marshall, D.D.; Powers, R. Beyond the paradigm: Combining mass spectrometry and nuclear magnetic resonance for metabolomics. Prog. Nucl. Magn. Reson. Spectrosc. 2017, 100, 1–16. [Google Scholar] [CrossRef] [Green Version]
  28. Wittmann, C.; Hans, M.; van Winden, W.A.; Ras, C.; Heijnen, J.J. Dynamics of intracellular metabolites of glycolysis and TCA cycle during cell-cycle-related oscillation in Saccharomyces cerevisiae. Biotechnol. Bioeng. 2005, 89, 839–847. [Google Scholar] [CrossRef]
  29. Jewett, M.C.; Hofmann, G.; Nielsen, J. Fungal metabolite analysis in genomics and phenomics. Curr. Opin. Biotechnol. 2006, 17, 191–197. [Google Scholar] [CrossRef]
  30. Calvo, A.M.; Wilson, R.A.; Bok, J.W.; Keller, N.P. Relationship between secondary metabolism and fungal development. Microbiol. Mol. Biol. Rev. 2002, 66, 447–459. [Google Scholar] [CrossRef] [Green Version]
  31. Aittokallio, T.; Schwikowski, B. Graph-based methods for analysing networks in cell biology. Brief Bioinfor. 2006, 7, 243–255. [Google Scholar] [CrossRef]
  32. Xia, J.; Wishart, D.S. MetPA: A web-based metabolomics tool for pathway analysis and visualization. Bioinformatics 2010, 26, 2342–2344. [Google Scholar] [CrossRef]
  33. Pócsi, I.; Prade, R.A.; Penninckx, M.J. Glutathione, altruistic metabolite in fungi. Adv. Microb. Physiol. 2004, 49, 1–76. [Google Scholar] [CrossRef]
  34. Ratledge, C.; Wynn, J.P. The biochemistry and molecular biology of lipid accumulation in oleaginous microorganisms. Adv. Appl. Microbiol. 2002, 51, 1–52. [Google Scholar] [CrossRef] [PubMed]
  35. Herman, N.A.; Zhang, W. Enzymes for fatty acid-based hydrocarbon biosynthesis. Curr. Opin. Chem. Biol. 2016, 35, 22–28. [Google Scholar] [CrossRef]
  36. Tang, X.; Lee, J.; Ning, W. Engineering the fatty acid metabolic pathway in Saccharomyces cerevisiae for advanced biofuel production. Metab. Eng. Commun. 2015, 2, 58–66. [Google Scholar] [CrossRef] [PubMed]
  37. Breuninger, M.; Trujillo, C.G.; Serrano, E.; Fischer, R.; Requena, N. Different nitrogen sources modulate activity but not expression of glutamine synthetase in arbuscular mycorrhizal fungi. Fungal Genet. Biol. 2004, 41, 542–552. [Google Scholar] [CrossRef]
  38. Jeffries, T.W. Utilization of xylose by bacteria, yeasts, and fungi. Adv. Biochem. Eng. Biotechnol. 1983, 27, 1–32. [Google Scholar] [CrossRef] [PubMed]
  39. Kohlhaw, G.B. Leucine biosynthesis in fungi: Entering metabolism through the back door. Microbiol. Mol. Biol. Rev. 2003, 67, 1–15. [Google Scholar] [CrossRef] [Green Version]
  40. Cossins, E.A.; Chen, L. Folates and one-carbon metabolism in plants and fungi. Phytochemistry 1997, 45, 437–452. [Google Scholar] [CrossRef]
  41. Estramareix, B.; Thérisod, M. Biosynthesis of thiamine: 5-aminoimidazole ribotide as the precursor of all the carbon atoms of the pyrimidine moiety. J. Am. Chem. Soc. 1984, 106, 3857–3860. [Google Scholar] [CrossRef]
  42. Eisenreich, W.; Bacher, A.; Arigoni, D.; Rohdich, F. Biosynthesis of isoprenoids via the non-mevalonate pathway. Cell. Mol. Life Sci. 2004, 61, 1401–1426. [Google Scholar] [CrossRef]
  43. Lim, F.Y.; Sanchez, J.F.; Wang, C.C.C.; Keller, N.P. Toward awakening cryptic secondary metabolite gene clusters in filamentous fungi. Meth. Enzymol. 2012, 517, 303–324. [Google Scholar] [CrossRef] [Green Version]
  44. Caniard, A.; Zerbe, P.; Legrand, S.; Cohade, A.; Valot, N.; Magnard, J.-L.; Bohlmann, J.; Legendre, L. Discovery and functional characterization of two diterpene synthases for sclareol biosynthesis in Salvia sclarea (L.) and their relevance for perfume manufacture. BMC Plant Biol. 2012, 12, 119. [Google Scholar] [CrossRef] [PubMed] [Green Version]
  45. Martínez-Guido, S.I.; Sengupta, D.; Nápoles-Rivera, F.; González-Campos, J.B.; Del Río, R.B.; Ponce-Ortega, J.M.; El-Halwagi, M.M. Life cycle assessment for Ambrox® production from different chemical routes. J. Clean Prod. 2016, 130, 202–212. [Google Scholar] [CrossRef]
  46. Dettmer, K.; Aronov, P.A.; Hammock, B.D. Mass spectrometry-based metabolomics, Mass Spectrom. Rev. 2007, 26, 51–78. [Google Scholar] [CrossRef]
  47. Saccenti, E.; Hoefsloot, H.C.J.; Smilde, A.K.; Westerhuis, J.A.; Hendriks, M.M.W.B. Reflections on univariate and multivariate analysis of metabolomics data. Metabolomics 2014, 10, 361–374. [Google Scholar] [CrossRef]
  48. Tugizimana, F.; Piater, L.A.; Dubery, I.A. Plant metabolomics: A new frontier in phytochemical analysis. S. Afr. J. Sci. 2013, 109, 18–20. [Google Scholar] [CrossRef] [Green Version]
  49. Wiklund, S.; Johansson, E.; Sjöström, L.; Mellerowicz, E.J.; Edlund, U.; Shockcor, J.P.; Gottfries, J.; Moritz, T.; Trygg, J. Visualization of GC/TOF-MS-based metabolomics data for identification of biochemically interesting compounds using OPLS class models. Anal. Chem. 2008, 80, 115–122. [Google Scholar] [CrossRef]
  50. Trivedi, K.D.; Iles, K.R. The application of SIMCA P+ in shotgun metabolomics analysis of ZIC®HILIC-MS spectra of human urine—Experience with the Shimadzu IT-TOF and profiling solutions data extraction software. J. Chromatogr. Sep. Tech. 2012, 3, 145. [Google Scholar] [CrossRef] [Green Version]
  51. Airoldi, C.; Tripodi, F.; Guzzi, C.; Nicastroab, R.; Coccetti, P. NMR analysis of budding yeast metabolomics: A rapid method for sample preparation. Mol. Biosyst. 2015, 11, 379–383. [Google Scholar] [CrossRef]
Figure 1. Ultra-high performance liquid chromatography (UHPLC) separation with high-definition mass spectrometry (HD–MS) detection in electrospray ionization (ESI) negative mode of (A) methanolic- and (B) and acetonic cellular extracts of Hyphozyma roseonigra. Cells were harvested from selected days over a 14 d period representing the different growth stages, i.e., early, logarithmic and stationary. The representative base peak intensity (BPI—the most intense peaks at a specific retention time) chromatograms show evident differential peak populations across the different days. The X-axes are staggered across the retention time scale and the Y-axes linked to allow comparison of peak intensities.
Catalysts 12 01225 g001
Figure 2. Principal component analysis (PCA) score plots of (A) methanolic- and (B) and acetonic intracellular extracts of H. roseonigra cells analyzed using UHPLC–MS in ESI (−) mode. The scores plots, constructed from the first two components, show clustering according to different growth stages represented as the early-, log-, and stationary stages. The ellipse indicates Hotelling’s T2 at 95% confidence interval. The Pareto-scaled 2D scores plots (A) with PC1 and PC2 showing 36.7% and 32.7%, respectively, explaining a total variation of 69.4%, and (B) with PC1 and PC2 showing 22.3% and 19.4%, respectively, explaining a total variation of 41.7%, shows clear separation of the stages.
Catalysts 12 01225 g002
Figure 3. (A) 1H NMR spectra (500 Hz) of intracellular metabolites present in methanolic extracts of H. roseonigra. The cells were harvested from selected days (0, 4, 6, 10, 14 d) over a 14 d period representing the different growth stages, i.e., early- (blue line), logarithmic- (red line), and stationary (green line). The representative spectra show evident differences in peak intensities across the different days, where the intensities decrease or increase for some peaks. The resonance from the internal standard (TSP) is at 0.00 ppm. (B) Multivariate data analysis showing a representative principal components analysis (PCA) scores plot. The plots, constructed from the first two components, show clustering according to different developmental stages represented as early-, logarithmic-, and stationary with gradual overlap between the early- and log stages. The Pareto-scaled 2D scores plot with PC1 and PC2 showing 34.8% and 28.6%, respectively, explaining a total variation of 63.4%.
Catalysts 12 01225 g003
Figure 4. Overview of pathway topology analysis: MetPA-computed metabolic pathways. A visual representation of information showing all matched pathways according to the log p-values and impact scores (Table S3). Pathways are displayed according to their significance (pathway impact) indicating pathways with high impact to low impact (bright red to light yellow, respectively) active in H. roseonigra.
Catalysts 12 01225 g004
Figure 5. Metabolomics pathway topology analysis. A visual representation of information showing (A) alanine, aspartate, and glutamate metabolism, and (B) pantothenate and coenzyme A pathways displaying some tentatively annotated metabolites found to be present in H. roseonigra. Annotated metabolites participating in the pathways are pantothenic acid (2), L-aspartate (18), glutamine (19), valine (20), alanine (22), succinate (41), and CoA (45). The charts represent the relative concentration across the growth/developmental stages (Blue = early, Pink = log, Black = stationary). The figure only represents the metabolites that could be mapped using the MetPA tool.
Catalysts 12 01225 g005
Table 1. List of annotated metabolites present in acetonic and methanolic extracts of H. roseonigra grown in batch culture and annotated from UHPLC–MS data *.
Assigned Feature NumberMetabolite
Annotation
Biological
Role
Intra-
Cellular
Extra-
Cellular
Acetone extracts
15-Aminoimidazole ribonucleotideIntermediate
2Pantothenic acidVitamin
3Thymine diphosphateNucleotide
4Glycyl-leucineDipeptide
5Xanthosine-5-phosphatePurine
6N6,N6-DimethyladenosineRibonucleoside
7MaculosinDipeptide
82-Deoxyribose-1-phosphateIntermediate
9S-Adenosyl-L-homo-cysteineMethyl donor
1018-Acetoxy-1-alpha-25-dihydroxy vit. D3Vitamin
115-Methyl-tetrahydrofolateDNA synthesis
12ReynosinDiterpene
13Broussonin CPolyketide/phenolic
Methanol extracts
14DeoxyuridineRibonucleoside
15BiotinVitamin
16UDP-glucuronateSugar
17Xanthosine-5-phosphatePurine
* Additional experimental details in support of the annotations are provided in Table S1.
Table 2. Annotation of metabolites in methanolic extracts of Hyphozyma roseonigra analyzed by 1H NMR *.
Assigned Feature NumberMetabolite
Annotation
Assigned Feature NumberMetabolite
Annotation
Amino acids and derivatives
18Aspartate19Glutamine
20Valine21Threonine
22Alanine23Glutamate
24Isoleucine25Leucine
26Cysteine27Ornithine
28Serine29N-acetyl aspartate
Fatty acids and derivatives
30Linoleic acid31Hexadecyl octanoate ester
32Nonadecanoic acid33Palmitic acid (OCH3)
342-Hydroxy-isobutyric acid
Sugars and derivatives
35Galactose-1-phosphate36Glucose
37Galactitol38Myo-inositol
Organic acids
39Lactate
* Additional experimental details in support of the annotations are provided in Table S2.
Publisher’s Note: MDPI stays neutral with regard to jurisdictional claims in published maps and institutional affiliations.

