Article

The Effect of Sintering Temperature on Phase-Related Peculiarities of the Microstructure, Flexural Strength, and Fracture Toughness of Fine-Grained ZrO2–Y2O3–Al2O3–CoO–CeO2–Fe2O3 Ceramics

1
Department of Materials Science and Engineering, Lviv Polytechnic National University, 12 S. Bandera Street, 79013 Lviv, Ukraine
2
Centre for Microscopy and Microanalysis, University of Queensland, St. Lucia, Brisbane, QLD 4072, Australia
*
Authors to whom correspondence should be addressed.
Crystals 2024, 14(2), 175; https://doi.org/10.3390/cryst14020175
Submission received: 16 January 2024 / Revised: 2 February 2024 / Accepted: 7 February 2024 / Published: 9 February 2024

Abstract

:
The lifetime of products made of ceramic materials is related to their mechanical characteristics such as strength, hardness, wear resistance, and fracture toughness. The purpose of this work was to study the effect of sintering temperature on the phase-related peculiarities of the microstructures, causing changes in the flexural strength and fracture toughness of fine-grained ZrO2–Y2O3–Al2O3–CoO–CeO2–Fe2O3 ceramics. Flexural strength and fracture toughness tests were carried out using ceramics sintered in three modes (2 h at 1550 °C, 1580 °C, and 1620 °C in argon), and thorough phase, microstructure, and fractographic analyses were performed. For the ceramic sintered at 1550 °C, a mixed mechanism of intergranular fracture of the t-ZrO2 phase particles and cleavage fracture of the Ce–Al–O phase particles was found, which is reflected in its comparatively low fracture toughness. For the ceramic sintered at 1580 °C, a fracture developed along the boundaries of the aggregates, made of completely recrystallized fine ZrO2 grains with a high bond strength between adjacent t-ZrO2 grains; this corresponds to the highest fracture toughness (5.61 ± 0.24 MPa·m1/2) of this ceramic. For the ceramic sintered at 1620 °C, a transgranular fracture of the t-ZrO2 phase and Ce–Al–O phase particles and crack propagation along the t-ZrO2/Ce–Al–O interface were revealed; this caused a decrease in fracture toughness.

1. Introduction

The lifetime and reliability of products made of ceramic materials depend to a great extent on their ceramic chemical and phase compositions and, as a result, their microstructure. Rahaman M.N. [1] showed that sintering is one of the most important stages in the process of manufacturing a ceramic product. The choice of a sintering mode has a significant effect on the grain size, microstructure features, and phase composition of ceramics. The improved properties of zirconia-based ceramics are largely provided by the presence of a tetragonal phase in their microstructure. The tetragonal phase is metastable, and its stabilization at room temperature can be achieved by doping zirconia with other oxides (stabilizers), such as CaO [2], MgO [3], Y2O3 [4,5,6], and CeO2 [7,8].
The sintering temperature and dwell time significantly affect the microstructure of yttria-stabilized tetragonal zirconia polycrystals (Y-TZP). As reported by the authors of a series of works [1,9,10], the average grain size in 3 mol% Y2O3-stabilized zirconia ceramics (3Y-TZP) increases with increasing sintering temperature and dwell time.
It is known that, depending on the required microstructure, Y-TZP ceramics are sintered at temperatures between 900 °C and 1600 °C. As reported by Denry I. and Kelly J.R. [11], to obtain coarse Y-TZP microstructures, higher temperatures and longer dwell times are required. For example, the sintering of dental implants is carried out at temperatures between 1200 °C and 1600 °C. As a result, a highly compacted fine-grained microstructure with a grain size of 300 nm or less can be obtained.
As reported by Reveron H. and Chevalier J. [12], 3Y-TZP is the most commonly manufactured powder in the ZrO2–Y2O3 system for biomedical use. However, along with this composition, 4Y, 5Y, and other Y-rich zirconia compositions have also been produced industrially for dental restorations. Chevalier J. and Gremillard L. [13] found, for biomedical-grade alumina and 3Y-TZP zirconia, that, in terms of fracture toughness, zirconia has an advantage over alumina, which is caused by a t-m transformation. In the microstructure of 3Y-TZP ceramics intended for dental use, Guazzato M. et al. [14] revealed small equiaxed grains (0.2–0.5 μm) with a tetragonal phase, the size of which depended on the sintering temperature. The monoclinic phase fraction was only 0.5%. After sintering at 1450 °C for 1 h, this ceramic had a flexural strength of 680 MPa, fracture toughness of 5.5 MPa·m1/2, and microhardness of 13 GPa.
Matsui K. et al. [15] studied the isothermal sintering behavior in 3Y-TZP to clarify the phase-separation and grain-growth mechanisms. They revealed that the cubic-phase regions with high Y3+ ion concentrations in 3Y-TZP sintered at 1500 °C. Namely, these regions were located in the grain interiors adjacent to the grain boundaries. Belli R. et al. [16] used a conventional mode for sintering yttria-stabilized zirconia (YSZ) ceramics, namely 1500 °C for 2 h, and determined their fracture toughness under three- or four-point bending. They showed that, with an increase in the Y2O3 content from 1 to 3 mol%, the fracture toughness of YSZ ceramics drops steeply from 17.5 to 4.9 MPa·m1/2, and with a further increase in the Y2O3 content from 3 to 6 mol%, it decreases smoothly from 4.9 to 2.9 MPa·m1/2. For a YSZ ceramic doped with 1.89 mol% Y2O3, as an exception, sintering was carried out at 1350 °C for 4 h. The fracture toughness of this ceramic was 8.87 MPa·m1/2.
The amount and type of stabilizing additives have an ambiguous effect on the properties of zirconia-based ceramics, especially in the case of complex doping. Rada S. et al. [17] studied ceramics of the 5Fe2O3·10SiO2·xY2O3·(85–x)ZrO2 system. In particular, they found that the fraction of the cubic ZrO2 crystalline phase increases when the content of the monoclinic ZrO2 phase is reduced by adding Fe2O3. Gupta A. et al. [18] showed that, by adding CeO2 to 8YSZ ceramics, the grain size can be optimally modeled if a fine-grained microstructure is required for improved thermal dissipation (for TBC applications) or coarser grains (for increased ionic conductivity in solid electrolytes).
In the case of YSZ applications as high-temperature-resistant thermal barrier coatings (TBCs), great limitations on this material are imposed, as shown by Schlichting K.W. et al. [19] and Yang E. et al. [20]. Therefore, it is highly desirable to search for new materials for TBCs with better phase stability and lower thermal conductivity. Zhu D. and Miller R.A. [21], Loghman-Estarki M.R. et al. [22], and Guo L. et al. [23] reported that doping YSZ ceramics with La2O3, Sc2O3, Gd2O3, TiO2, and Al2O3 additives is a promising method, as these could effectively enhance the mentioned TBC properties. However, such doping brings some complexity to the crystal structure of the material, and its sintering becomes more difficult.
Nagaraj B.A. and Wortman D.J. [24] showed that it is necessary to increase the resistance of TBCs to high-temperature corrosion to expand the scope of their application. The most promising approach is to replace Y2O3 with stronger acidic stabilizers, such as CeO2, In2O3, Sc2O3, and YTaO4 [24,25]. Park S.Y. et al. [26] reported that, among these systems, a coating based on CeO2-stabilized zirconia (CSZ) is extensively investigated as a replacement for YSZ. The authors suggest that with the high CeO2 content (25 wt%), CSZs can have high tetragonal phase stability, resulting in better high-temperature corrosion resistance than YSZ. This result can be confirmed by the fact that CeO2 is more resistant to the chemical effects of salts such as sulfates [27] and vanadium salts [28].
Contemporary ceramic–ceramic composites are considered promising for various applications. Palmero et al. [29] suggested the further improvement of these composites by using ceria-stabilized zirconia (Ce-TZP) as a separate phase; namely, innovative zirconia-based composites, in which elongated SrAl12O19 and equiaxial α-Al2O3 phases are dispersed in a Ce-TZP matrix. As shown by the authors, the alumina phase in the microstructure of these composites can favor the retention of fine Ce-TZP grains. This, in turn, improves the composite’s strength compared to monolithic Ce-TZP, while maintaining its high fracture toughness. Additionally, Reveron et al. [30] and Nawa et al. [31] showed that a pseudo-plastic mechanical behavior of this class of composites can be achieved.
Dmitrievskii A. et al. [32] investigated the effect of the percentage of Al2O3 in CaO-stabilized zirconium dioxide on the phase composition and mechanical properties of CaO–ZrO2–Al2O3 ceramic composites. The authors found for the nanostructured CaO–ZrO2–Al2O3 composites the optimal microhardness/fracture toughness ratio, and a high flexural strength, at a corundum content of 5% when the sintering temperature was typical of ZrO2. Zhigachev A.O. et al. [33] presented a review of methods to control the phase stability and ionic conductivity of scandia-stabilized zirconia (ScSZ) ceramics by co-doping them with various oxides, in particular, yttria, ceria, etc. They presented some novel techniques for ScSZ electrolyte preparation for intermediate-temperature solid oxide fuel cells (SOFCs), including the optimal co-doping scheme. In particular, alumina was shown to be employed as a sintering aid [34] or additive for scavenging impurities [35]. It was also shown that the notable improvement of the aging resistance of SOFC electrolytes could be reached by doping ScSZ with 2.2 mol% Al2O3 and above. As zirconia ceramics are also a base for SOFC anodes [36,37,38], the proposed techniques can also be applied to the production and treatment of such SOFC components.
As can be seen, some specific tests are particular to ceramics used in various industries. In the present work, an attempt to consolidate the academic knowledge on zirconia-based ceramics with various additives applied in various industries (dentistry, chemical, green energy, etc.) was made, to reveal the positive effects of chemical and phase composition on the ceramic performance, first of all, as well as the ceramic strength and fracture toughness.
The lifetime of products made of ceramic materials is traditionally related to their strength and wear resistance. Along with these main characteristics, high fracture toughness is a key requirement for products made of ceramic materials. The latter characterizes their crack propagation resistance and largely determines the lifetime of products, as shown by Miyazaki H. et al. [39] and Moradkhani A. et al. [40].
The critical stress intensity factor (SIF), KIc, is widely used as a quantitative parameter for estimating the fracture toughness of a material and shows its propensity to brittle fracture [39,40,41,42,43]. It is reported in the literature on various experimental methods for estimating the fracture toughness of ceramics [39,40,44,45,46,47]. Of the main methods, the chevron-notched beam (CNB), single-edge notch beam (SENB), single-edge pre-cracked beam (SEPB), single-edge V-notched beam (SEVNB), and indentation methods are well known. The above-mentioned conventional methods for determining fracture toughness, except for the indentation method [40,44] and the SENB method, are time-consuming and expensive. On the other hand, the SENB method is comparatively simple. However, the fracture toughness values obtained by the SENB method can be only used for ranking materials and in comparison with the results obtained by standardized ASTM methods [41,42,43].
This work aims at studying the effect of sintering temperature on the phase-related peculiarities of microstructures that cause changes in the flexural strength and fracture toughness of fine-grained ZrO2–Y2O3–Al2O3–CoO–CeO2–Fe2O3 ceramics. Sintering at an intermediate temperature of 1580 °C resulted in a microstructure containing aggregates of fine recrystallized grains with strong bonding at the grain boundaries. Fracture propagation along these boundaries required high energies; therefore, the fracture toughness was the highest under this condition. The effects of sintering temperature on phase balance and mechanical properties are discussed.

2. Materials and Methods

The investigated zirconia, partially stabilized with Y2O3, Al2O3, CoO, CeO2, and Fe2O3, was prepared using their corresponding oxide powders (Table 1). Initial commercial powders were as follows (the average grain size is given in parentheses): 1 mol% Y2O3 (10–30 nm); 12 mol% Al2O3 (30–40 nm); 1 mol% CoO (20–30 nm); 7 mol% CeO2 (15–30 nm); and 1 mol% Fe2O3 (20–40 nm). ZrO2 powder (20–30 nm) was the balance (IoLiTec Inc., Tuscaloosa, AL, USA). Beam specimens of partially stabilized zirconia approximately 3.5 × 4.5 × 45 mm3 in size were sintered in an electric resistance furnace with an argon shielding atmosphere in three modes, corresponding to different sintering temperatures (Table 1): 1550 °C for 2 h (mode 1), 1580 °C for 2 h (mode 2), and 1620 °C for 2 h (mode 3). These modes, especially the sintering temperatures, resulted from a trade-off between the conventional modes for sintering YSZ and Ce-TZP ceramics described above and our thorough study on sintering Al2O3–ZrO2 ceramics [48]. The preparation of the powder mixture has been thoroughly described in our earlier paper [49]. A grinding and polishing Struers Tegramin machine (Struers, Copenhagen, Denmark) for metallographic preparation was used for processing the side surfaces of specimens after sintering to avoid phase transformations. Such processing allowed us to reach the required surface quality. The final dimensions of the specimens were reached, as per the ISO standard on mechanical tests [50], as follows: The thickness was b = (3.0 ± 0.2) mm and the width was w = (4.0 ± 0.2) mm. For metallographic studies, the prepared cross-sectional surface of specimens was etched in 40% hydrofluoric acid (HF) for 30 min according to the technique presented by Flamant Q. et al. [51].
Beam specimens of the above-mentioned geometry were used for estimating the flexural strength of the studied ceramics. For this purpose, a testing machine UIT STM 050 (UKRINTECH, Kharkiv, Ukraine) with a self-made loading unit for three-point bend loading at a cross-head speed of 10−2 mm/s was used. The loading unit was set with a 30 mm span between the supporting rollers. The test was performed at 20 °C in air. The material strength in flexure was calculated by the equation presented by Gere J.M. and Timoshenko S.P. [52], Romaniv O.M. and Vasyliv B.D. [53], and the ISO 6872 standard [50] using the “load–flexure” test data:
σ f = 1.5 P · l w · b 2
where σf is the flexural strength (MPa), P is the fracture load (N), l is the span between the supporting rollers (mm), and b and w are the thickness and width (mm) of the beam specimen, respectively.
Five specimens were tested for each material mode, and the flexural strength was calculated as the average value, and their standard deviation was also determined.
A conventional SENB test method [41,42,43,50] was applied for the estimation of the fracture toughness of the studied ceramics. The cross-section geometry of the beam specimens used for this test was the same as for the flexural test. A 0.1 mm wide straight notch with its front along the thickness dimension was made by a 0.08 mm thick diamond wheel, using a self-made cutting machine. Therefore, the notch tip radius was about 0.05 mm. The SENB specimens were tested under three-point bending at 20 °C in air. A span between the supporting rollers of 30 mm was set. Corresponding formulas for calculating the critical SIF [48,50] based on the “load–flexure” test data were used. The average KIc value of five specimens for each material mode was calculated, and their standard deviation was also determined.
For performing X-ray diffraction (XRD) analysis of the specimens, a DRON-4.07M diffractometer (Bourevestnik, St Petersburg, Russia) was utilized. The following parameters were set: Cu Kα radiation and Bragg–Brentano type geometry; voltage of 40 kV; current of 15 mA; 2θ angular range of 20–90°; and a step of 0.0217°. For the indexing, refining the profile, and determining the phase fractions, the WinCSD software package [54] was used. The following reference codes were used for the marked ZrO2 phases (t—tetragonal, m—monoclinic): COD ID 2300612 and COD ID 1528984, respectively.
To analyze the peculiarities of the microstructure and fracture surface morphology of tested specimens, scanning electron microscopy (SEM) was utilized. For this purpose, two scanning electron microscopes were used: a Carl Zeiss EVO-40XVP (Zeiss, Oberkochen, Germany) and Hitachi SU3900 (Hitachi, Tokio, Japan). Both the back-scattered electron (BSE) imaging mode and secondary electron (SE) imaging mode were used for the microstructure analysis. Only the secondary electron (SE) imaging mode was used for the analysis of the fracture surfaces of tested specimens. To determine chemical compositions in local areas of the specimens, an energy-dispersive X-ray (EDX) microanalysis using an INCA Energy 350 system (Oxford Instruments, Abingdon, UK) was performed.

3. Results

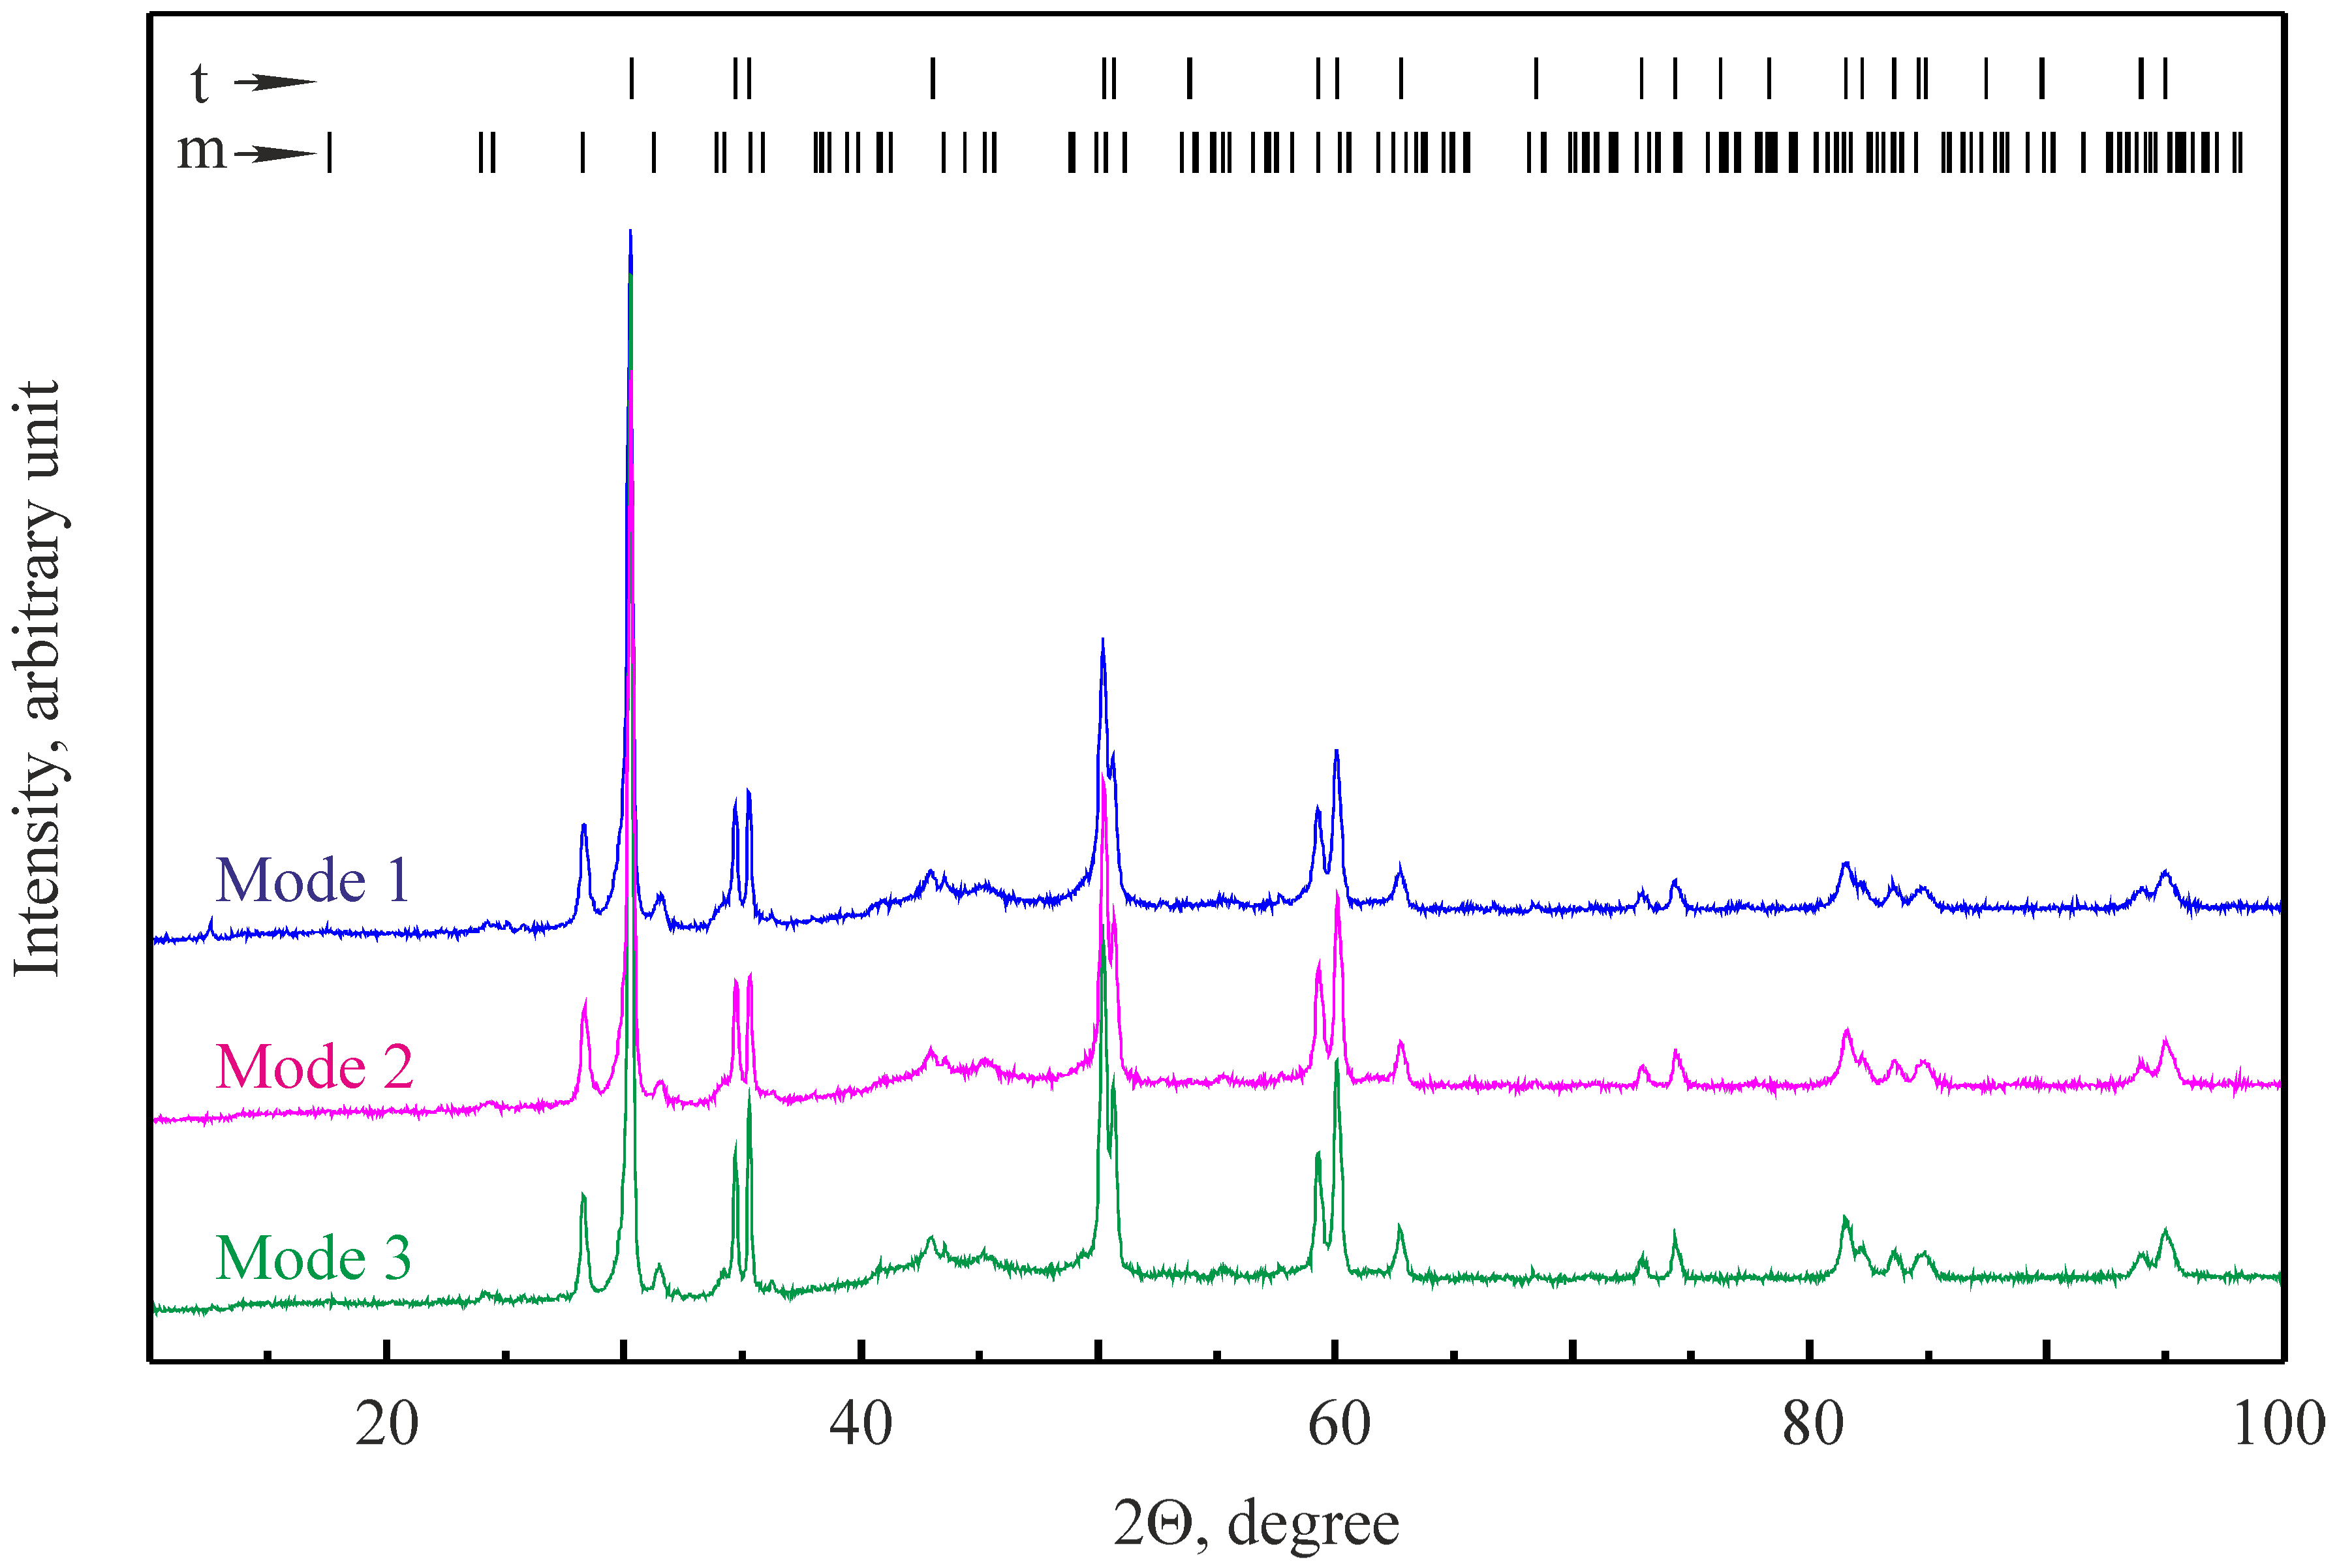
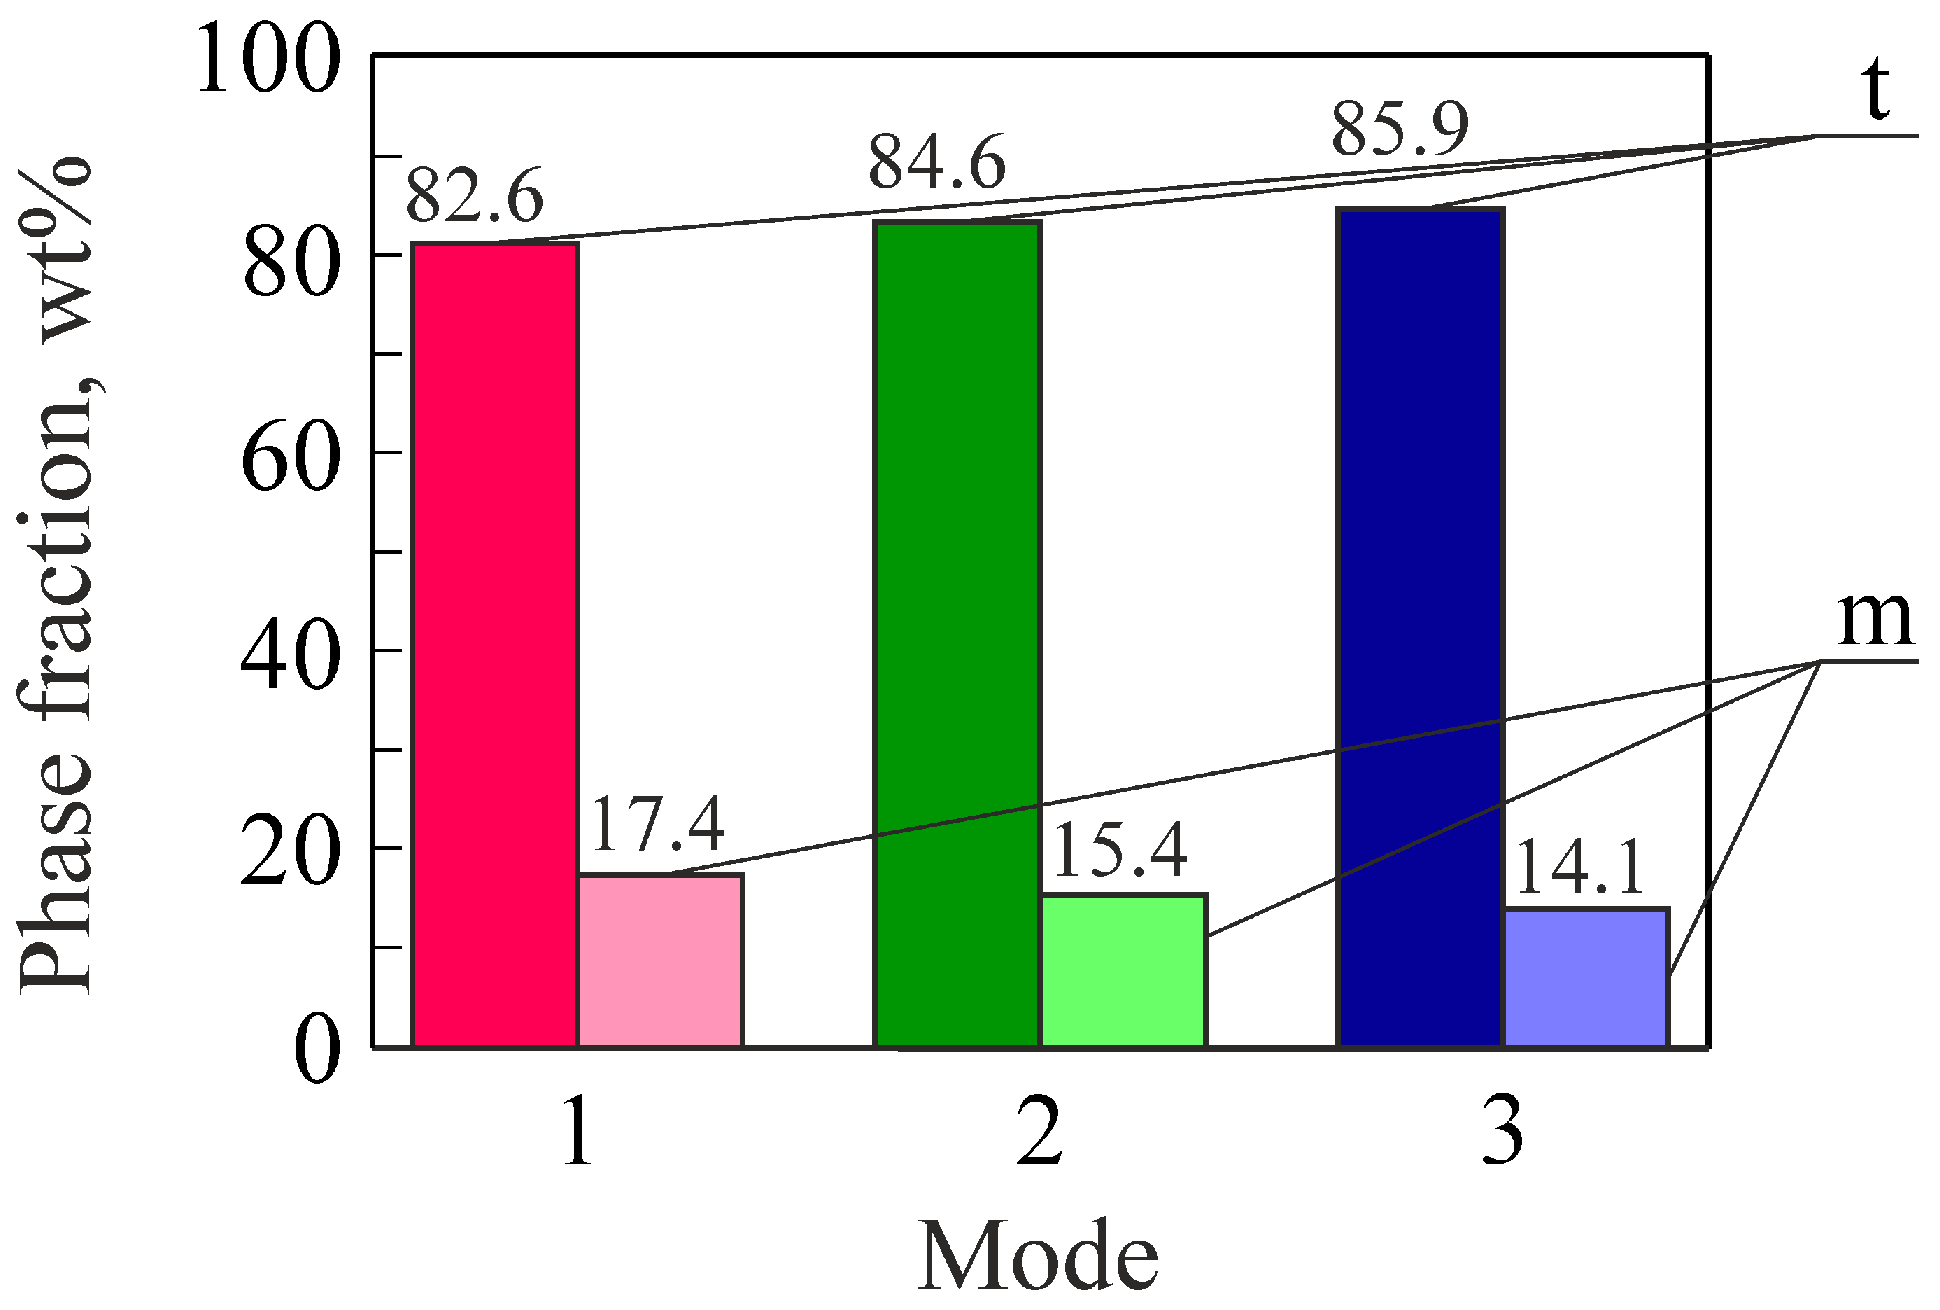
3.1. XRD Analysis of the Studied Ceramics

According to the XRD patterns, the ZrO2–Y2O3–Al2O3–CoO–CeO2–Fe2O3 ceramics under study are characterized by clear peaks in the m-ZrO2 and t-ZrO2 phases (Figure 1). We found a gradual increase in the peak heights of the t-ZrO2 phase for the materials with an increase in the sintering temperature from 1550 °C through 1580 °C to 1620 °C. Conversely, the peak heights of the m-ZrO2 phase decreased slightly for materials across this series. This appearance of the XRD patterns is consistent with the phase fractions determined for the ceramics (Figure 2). The fraction of the tetragonal phase in the ceramic sintered at 1550 °C (mode 1) was approximately 82.6 wt%. In the ceramics sintered at 1580 °C and 1620 °C, the fractions were 84.6 wt% and 85.9 wt%, respectively. Conversely, we found a gradual decrease in the fraction of the monoclinic phase (17.4 wt%, 15.4 wt%, and 14.1 wt%) for the ceramics obtained, respectively, at sintering temperatures of 1550 °C, 1580 °C, and 1620 °C. Therefore, we have obtained a correlation between the sintering temperature of these ceramics and their percentages of m-ZrO2 and t-ZrO2 phases.
It should be noted that the Al2O3 phase was not detected, although the fraction of the original Al2O3 powder was 12 mol%. Y2O3, CoO, and Fe2O3 were also not detected, as their fractions in the original powders were even smaller. Even CeO2 was not detected by XRD analysis, although its fraction in the original powder was relatively high (7 mol%).
It is known [55,56,57] that in most ceramics, point defects can be created by irradiation. In particular, two-phase ceramics of a cubic-type CeZrO4–YZrO3 have been found to be more resistant to radiation-induced degradation than single-phase ZrO2 and CeO2. The use of mechanical tests (strength, microhardness) allows for estimating the softening of ceramics. The defects can be formed not only by irradiation, but also during the synthesis of the ceramics.
According to Table 2, slight changes in the lattice parameters of both the monoclinic and tetragonal zirconia phases can be observed. However, the cell volume parameter, as an integral characteristic of a lattice, showed a non-linear change that occurred with an increase in the sintering temperature of the studied ceramics. The lowest cell volumes for the monoclinic and tetragonal zirconia phases were detected in the ceramic sintered in mode 2. Nevertheless, such an insignificant change in this parameter, as well as in the material’s density, does not allow us to discuss any change in the grade of the deformed lattice.

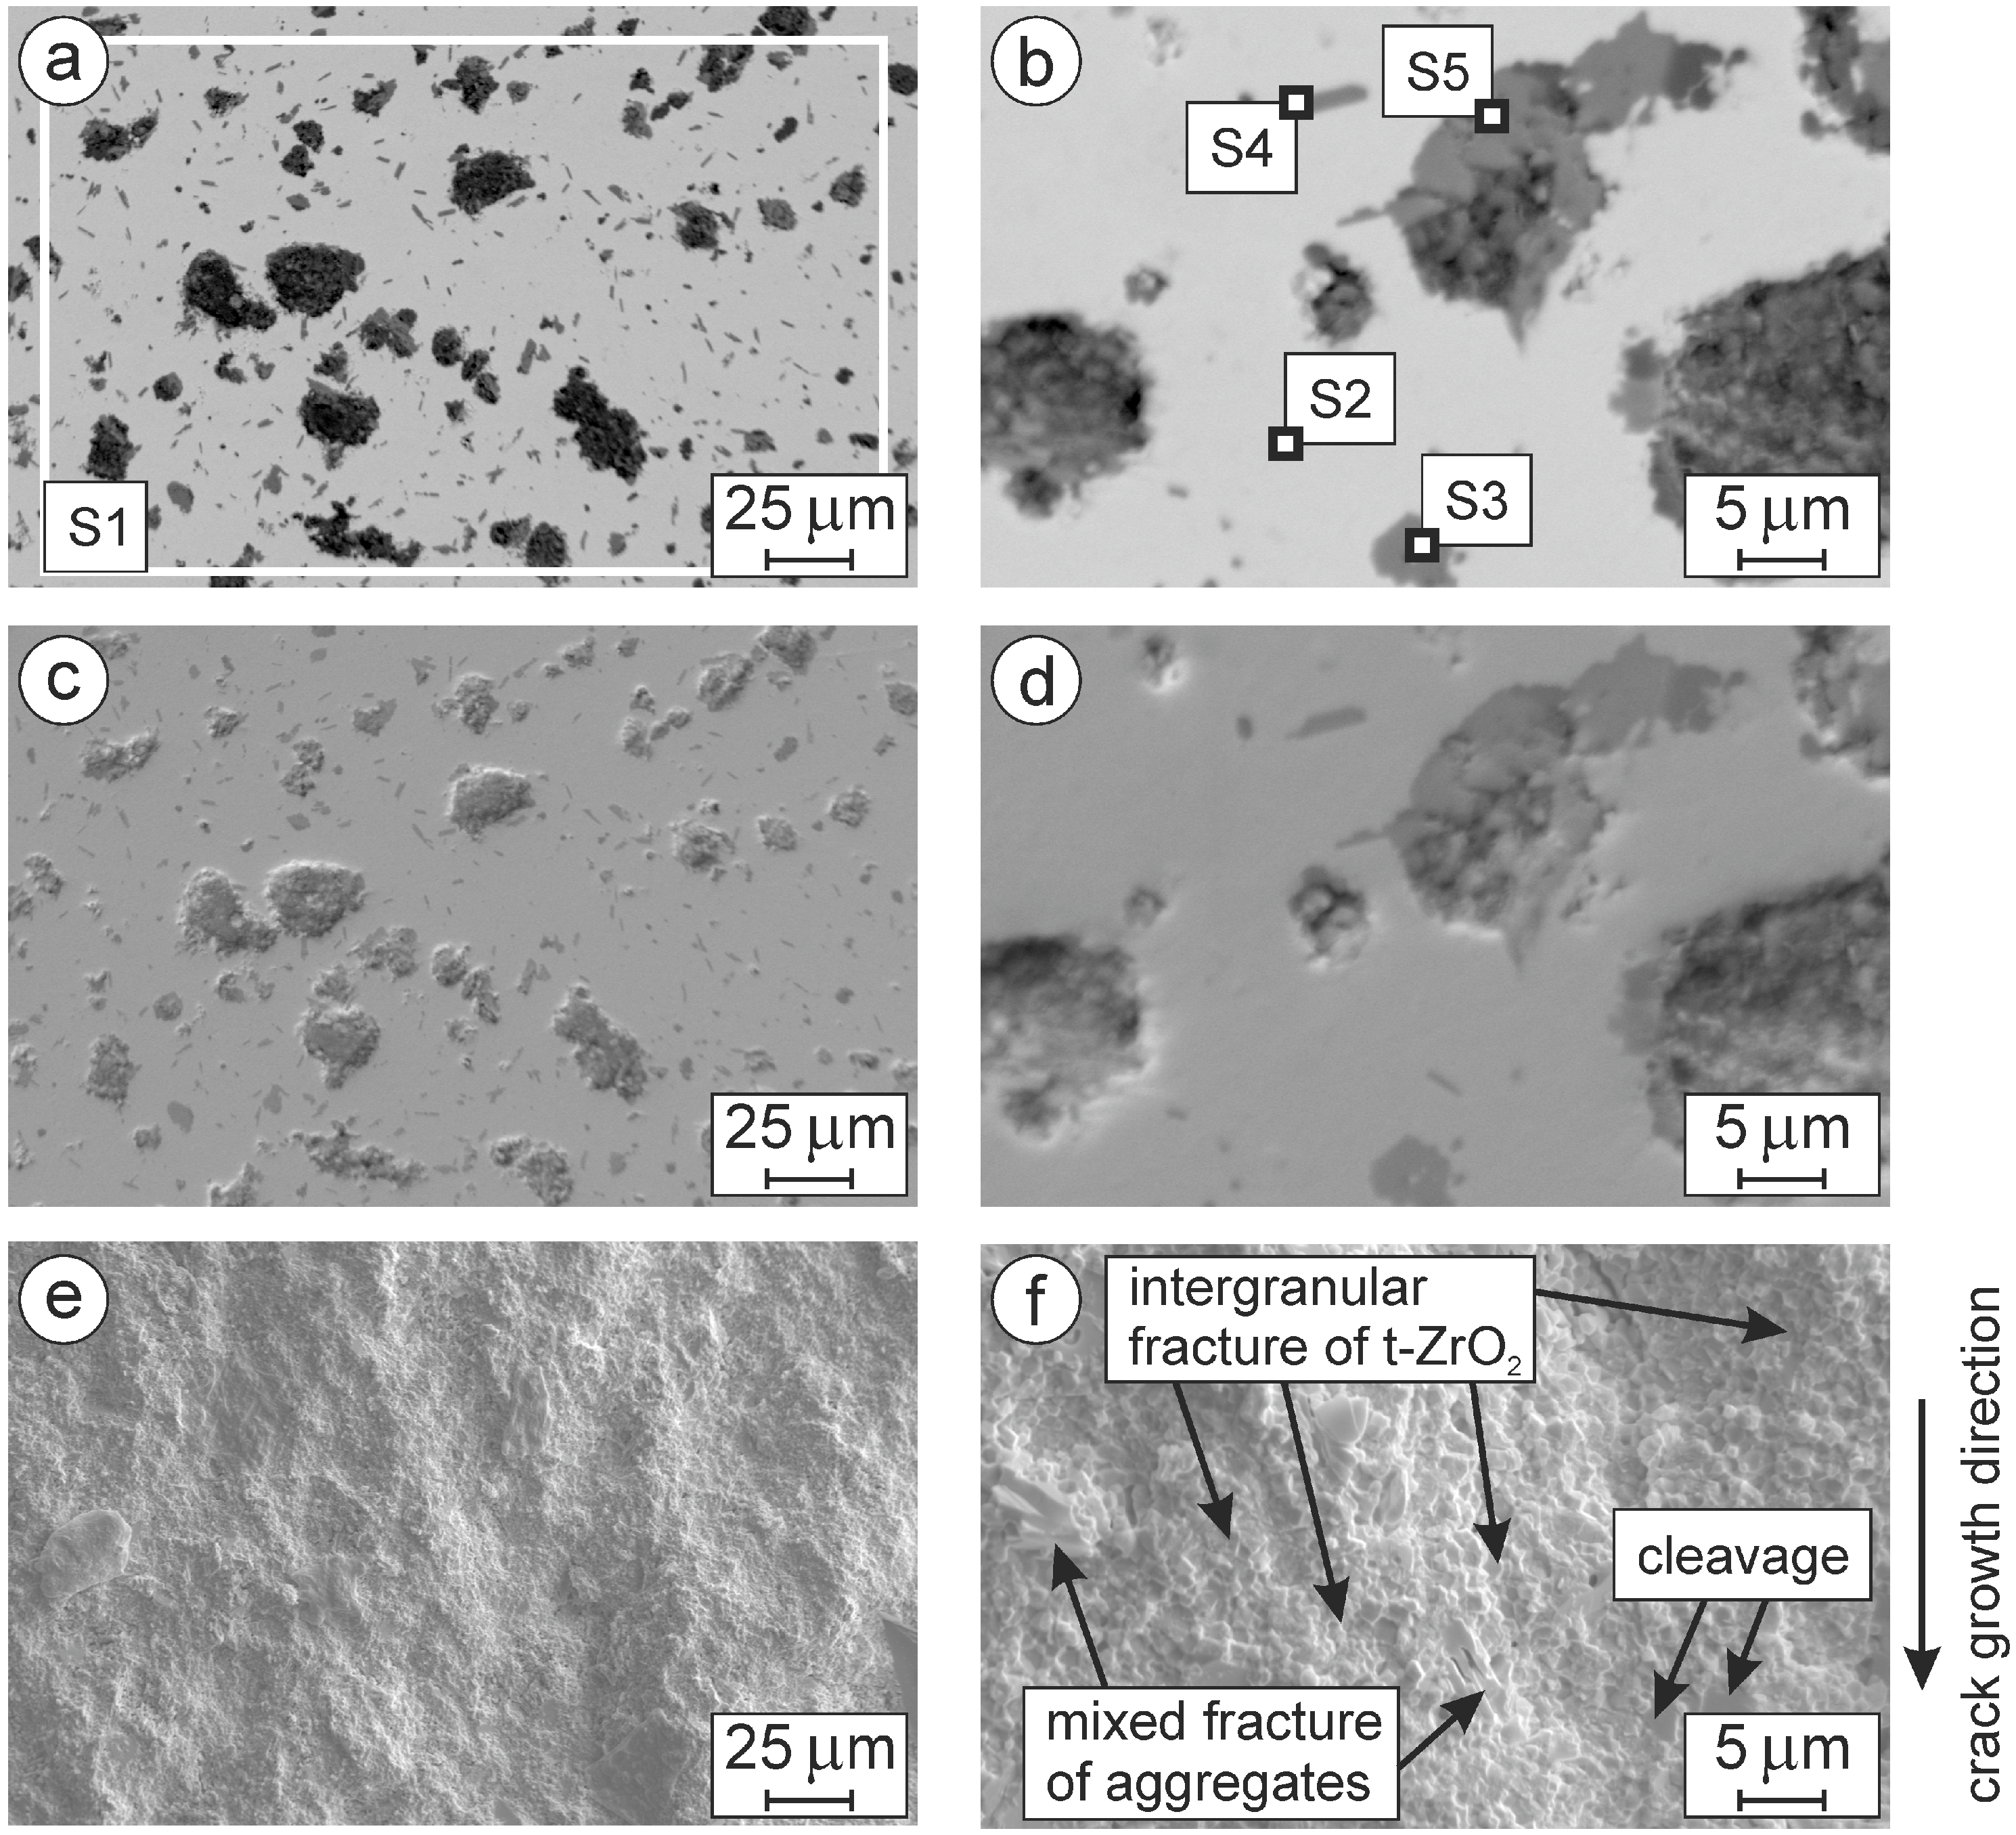
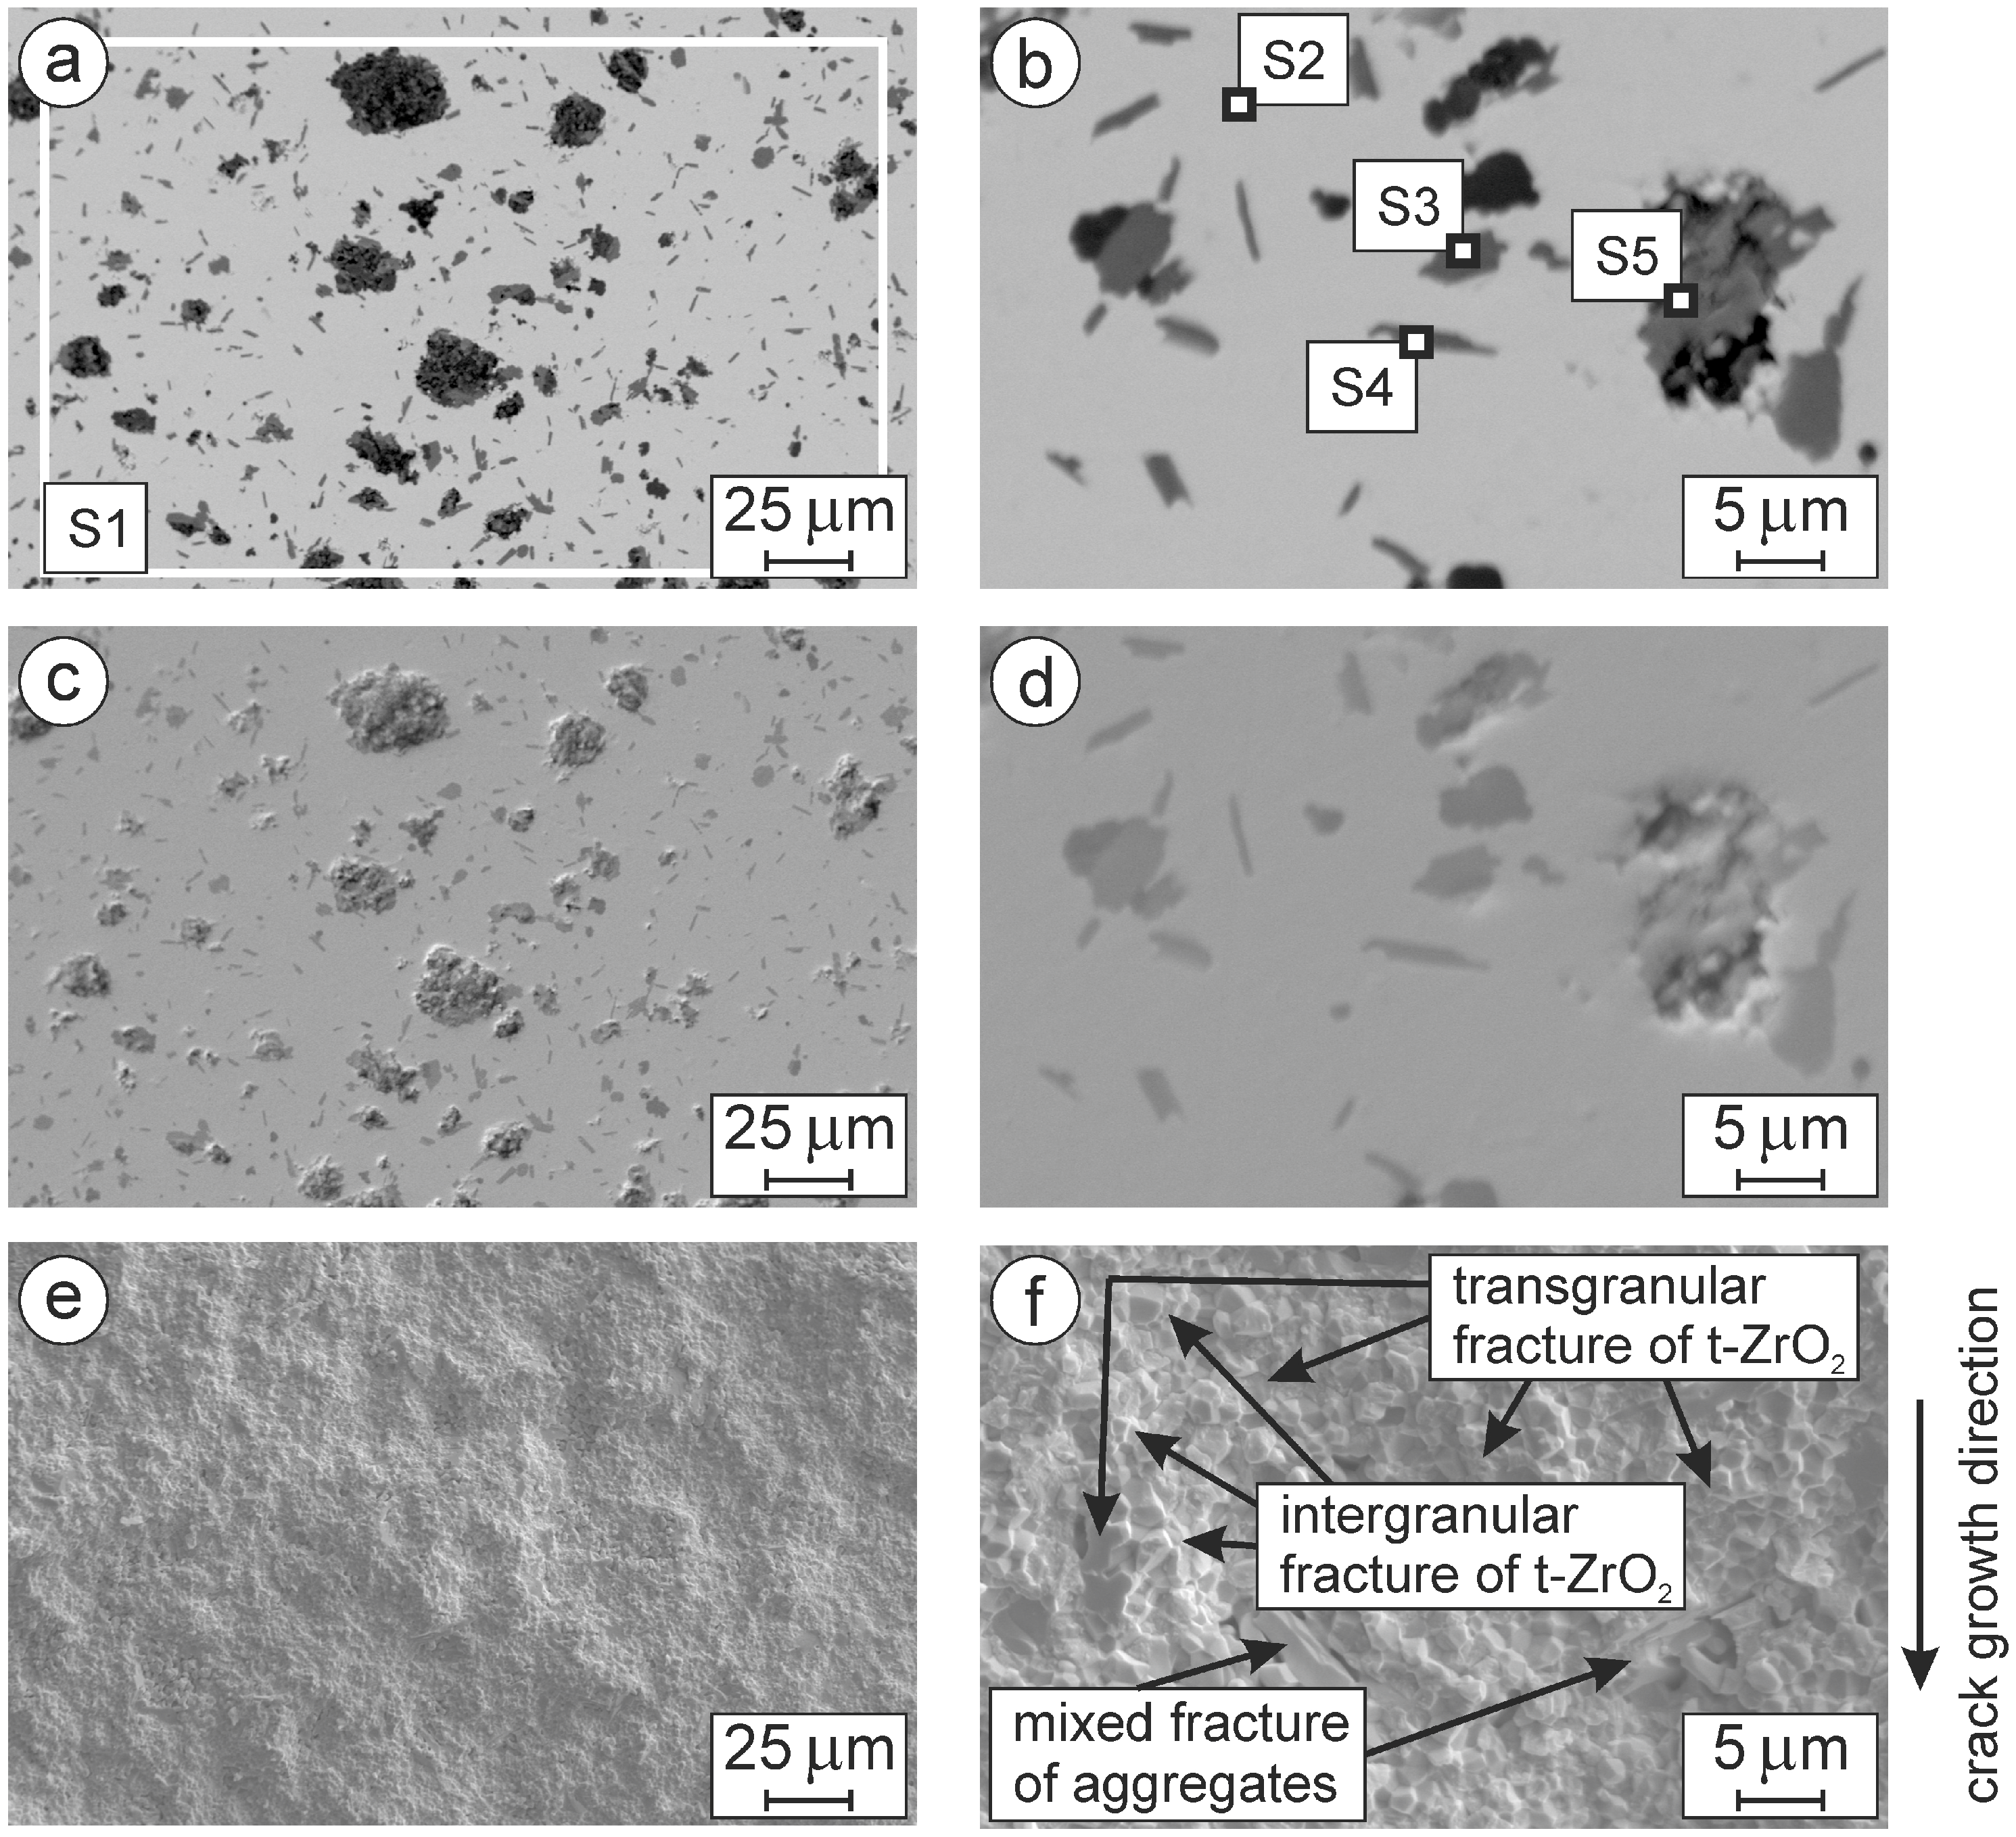
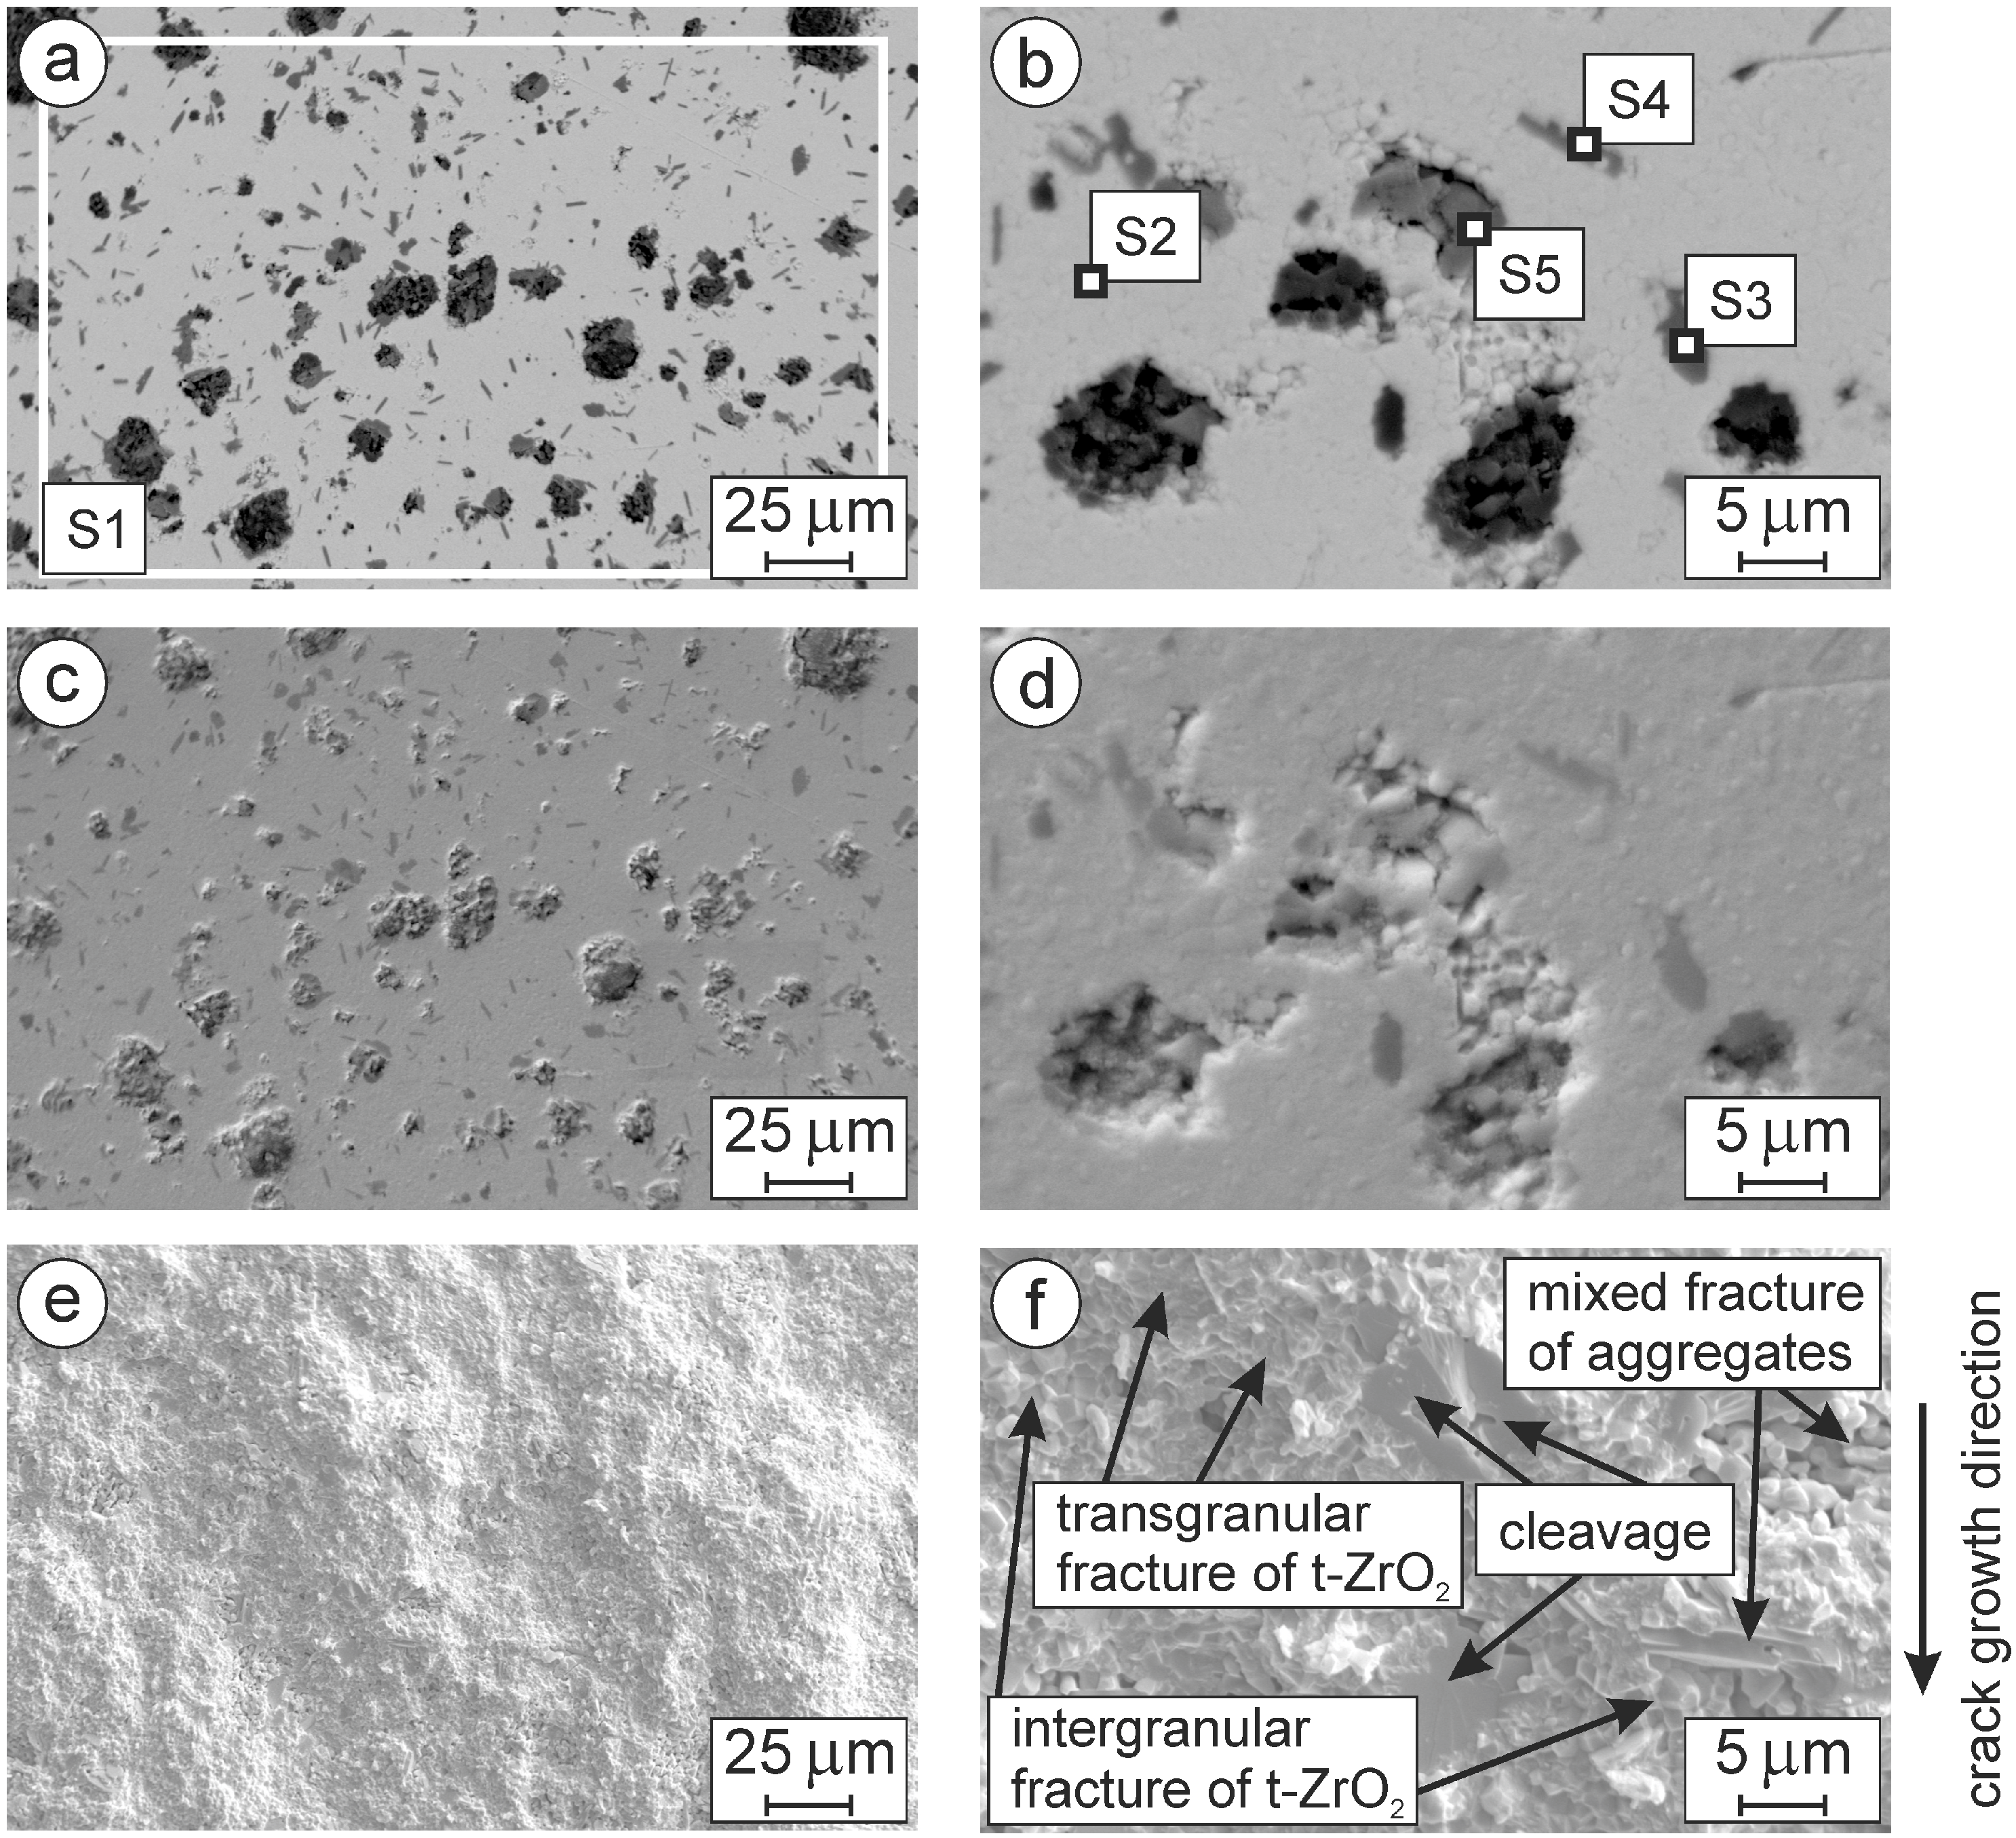
3.2. Microstructure and EDX Analysis of the Microstructural Components

A certain discrepancy between the composition of the original powders before sintering and their determined phase fractions in the sintered ceramics can be explained by microstructural analysis, using local EDX analysis. In all three ceramics, it is possible to observe small needle-like and round particles of a dark-gray color, as well as coarse areas (about 10–25 μm) of black color that contain randomly distributed small particles of a dark-gray color (Figure 3a,c, Figure 4a,c and Figure 5a,c).
All the specified components of the microstructure are more or less evenly distributed in the light-gray matrix. At this magnification of the image, no clear difference between the microstructures was revealed.
However, the images of the microstructures (Figure 3b,d, Figure 4b,d and Figure 5b,d) taken at high magnification clearly demonstrate the features of the above-mentioned microstructural components. Although it was not possible to detect individual grains of the matrix phase on SEM images of the microstructure, the morphology of particles from other phases can be analyzed in sufficient detail.
In general, according to EDX analysis, the ceramic sintered in mode 1 (Figure 3a) contains 24.28 wt% O, 4.21 wt% Al, 0.31 wt% Fe, 66.13 wt% Zr, and 5.07 wt% Ce (spectrum S1 in Table 3). The ceramic sintered in mode 2 (Figure 4a) contains 24.01 wt% O, 6.69 wt% Al, 0.23 wt% Co, 63.29 wt% Zr, and 5.78 wt% Ce (spectrum S1 in Table 4). The ceramic sintered in mode 3 (Figure 5a) contains 23.98 wt% O, 4.54 wt% Al, 0.48 wt% Co, 64.46 wt% Zr, and 6.54 wt% Ce (spectrum S1 in Table 5). Therefore, no significant difference in the chemical composition of the sintered ceramics was found.
According to the local EDX analysis, the light-gray matrix phase of the ceramic sintered in mode 1 (Figure 3b) contains 21.86 wt% O, 0.37 wt% Fe, 0.11 wt% Co, 71.91 wt% Zr, and 5.75 wt% Ce (spectrum S2 in Table 3). The matrix phase of the ceramic sintered in mode 2 (Figure 4b) contains 20.37 wt% O, 0.43 wt% Fe, 0.67 wt% Co, 72.94 wt% Zr, and 5.59 wt% Ce (spectrum S2 in Table 4). The matrix phase of the ceramic sintered in mode 3 (Figure 5b) contains 20.05 wt% O, 0.49 wt% Fe, 0.87 wt% Co, 73.07 wt% Zr, and 5.52 wt% Ce (spectrum S2 in Table 5).
In general, with an increase in the sintering temperature of ceramics, the percentage of Ce in the matrix phase slightly decreases, in contrast to the general increase in the percentage of t-ZrO2 (Figure 2).
Although the detected amount of Ce in the matrix phase confirms that it is t-ZrO2 stabilized by ceria that constitutes the matrix phase, the fact of a decrease in the percentage of Ce indicates a slight migration of this element to other structural components. It should be noted that aluminum was not detected here by EDX analysis, although a certain amount of it could potentially be in solid solution [60,61] in this phase. The size of the t-ZrO2 phase grains in these regions (Figure 3b,d, Figure 4b,d and Figure 5b,d) appears to be 0.5–1.5 μm.
Dark-gray round particles with a size of about 1.5–5 μm in the microstructure of the ceramic sintered in mode 1 (Figure 3b) contain 28.61 wt% O, 47.69 wt% Al, 1.26 wt% Fe, 2.51 wt% Co, and 19.93 wt% Ce (spectrum S3 in Table 3). Such particles of similar sizes in the ceramics in modes 2 (Figure 4b) and 3 (Figure 5b) are of similar chemical compositions but contain, additionally, a small percentage of Mg: 1.22 wt% (spectrum S3 in Table 4) and 1.42 wt% (spectrum S3 in Table 5), respectively.
It is suggested that ternary compounds in the Ce–Al–O system with various stoichiometry were formed in these regions [60,61,62,63]. The energetic advantage of the formation of compounds in this system is explained by the lower melting temperatures of the oxides CeO2 (2400 °C) and Al2O3 (2072 °C) compared to that of ZrO2 (2715 °C); the standard enthalpies of formation of these three oxides, determined by Ellingham diagrams, are –1025 kJ mol−1, –1050 kJ mol−1, and –1080 kJ mol−1, respectively [64]. A small amount of magnesium, which is not characteristic of other phases, was additionally detected here. The slight migration of the element Ce from the matrix phase, noted above, probably occurred precisely to these structural components.
The round, needle-like particles of a dark-gray color about 1.5–5 μm long and 0.5–1.5 μm thick in the microstructure of the ceramic sintered in mode 1 (Figure 3b) contain 35.6 wt% O, 44.37 wt% Al, 0.69 wt% Fe, 1.71 wt% Co, and 17.63 wt% Ce (spectrum S4 in Table 3). Particles of similar shapes and sizes in the ceramics in modes 2 (Figure 4b) and 3 (Figure 5b) are of similar chemical compositions. In contrast to the round particles, EDX analysis of the needle-shaped particles in the ceramics in modes 2 (Figure 4b) and 3 (Figure 5b) revealed the element Zr present in the adjacent matrix phase: 11.66 wt% (spectrum S3 in Table 4) and 12.99 wt% (spectrum S3 in Table 5), respectively.
Dark colored areas 10–25 μm in size are partially filled with small particles of a dark gray color, each of which is 1–3 μm in size. These particles are aggregated and mostly adjacent to the matrix phase, although some of them are unaggregated and distributed over the entire area of the dark color. Dark-gray aggregated particles in the microstructure of the mode 1 ceramic (Figure 3b) contain 34.32 wt% O, 0.95 wt% Mg, 25.06 wt% Al, 0.37 wt% Fe, 1.87 wt% Co, 24.58 wt% Zr, and 12.85 wt% Ce (spectrum S5 in Table 3). These particles in the mode 2 ceramic (Figure 4b) contain 41.43 wt% O, 56.21 wt% Al, 0.6 wt% Fe, 0.43 wt% Co, and 1.33 wt% Ce (spectrum S5 in Table 4). The same particles in the mode 3 ceramic (Figure 5b) contain 32.38 wt% O, 1.42 wt% Mg, 40.46 wt% Al, 0.58 wt% Fe, 1.25 wt% Co, 6.8 wt% Zr, and 17.11 wt% Ce (spectrum S5 in Table 5). This analysis suggests that the dark-gray aggregated particles in the dark regions belong to the same phase as the small dark-gray rounded particles (see above). However, at the edges of these regions, where there are few dark-gray particles, our analysis revealed the element Zr. Such places indicate a diffusion of aluminum out of the aluminum oxide during sintering, which leads to the formation and expansion of dark areas in the structure of the ceramic. As evidenced by EDX analysis (spectrum S5 in Table 2, Table 3 and Table 4), the remains of the aluminum oxide are still preserved in the structure. Such heterogeneity and active interdiffusion of elements during sintering lead to the tetragonal to monoclinic transformation in the zirconia phase and, as a result, a weakening of the matrix material in places adjacent to the dark areas (Figure 3b,d, Figure 4b,d and Figure 5b,d). The negative effect of this phenomenon on the mechanical properties of the material is analyzed below in detail.

3.3. Mechanical Behavior of the Studied Ceramics

The mechanical properties of ceramics (strength, hardness, and fracture toughness) are known to depend on phase balance. The obtained dependences of strength and fracture toughness on the sintering temperature do not all show a linear correlation. The flexural strength was measured to be (Figure 6a) 546 ± 45 MPa for the ceramic sintered in mode 1; 558 ± 140 MPa for the ceramic sintered in mode 2; and 606 ± 148 MPa for the ceramic sintered in mode 3. It is known [65,66,67,68] that the flexural strength strongly depends on the size of pre-existing microcracks. As the microcracks are often present at grain boundaries, the size of the microcracks depends on the grain size and is also related to the dislocation density. Even if the typical diameter of pre-existing microcracks is not small, there is some probability that the dislocation density could be as high as the crystallographic limit if the number of microcracks in the single crystal specimen is very small. However, in our case, the large difference between the obtained values of flexural strength for the same material mode (indicated by the error bars) demonstrates the effect of other microstructural features (homogeneity of chemical composition, powder mixing procedure, etc.).
Fracture toughness vs. sintering temperature dependence was found to be non-linear. The fracture toughness was measured to be (Figure 6b) 5.09 ± 0.31 MPa·m1/2 for the ceramic sintered in mode 1; 5.61 ± 0.24 MPa·m1/2 for the ceramic sintered in mode 2; and 5.22 ± 0.46 MPa·m1/2 for the ceramic sintered in mode 3. Guazzato M. et al. [14] and Kulyk V. et al. [69] reported similar values of fracture toughness and flexural strength for 3Y-TZP ceramics and 6YSZ ceramics, respectively.

4. Discussion

4.1. Effects of Sintering Temperature on Microstructure and Properties

In general, increasing the sintering temperature leads to intensive grain growth in yttria-stabilized zirconia [9,70,71,72,73]. When the average grain size of the t-ZrO2 phase becomes larger than permissible (about 1 μm for ceramics of this type), the retention of metastable tetragonal zirconium dioxide is suppressed. In our case, the t-ZrO2 phase is mainly stabilized by CeO2, the content of which in the original powder was 7 mol%. This amount of CeO2 provides strong stabilization of the tetragonal crystal structure. A slight decrease in the fraction of the m-ZrO2 phase with an increase in the sintering temperature from 1580 °C to 1620 °C (Figure 2) is consistent with a slight increase in the flexural strength of the ceramics (Figure 6a).
Comparatively large regions of dark color, with orientations appropriate to the cleavage planes of aggregates of Ce–Al–O phase particles, affect the flexural strength of the studied materials, especially of ceramics sintered modes 2 and 3, and cause a large difference in the obtained values.
The following observations were made for variations in mechanical behavior with phase balance:
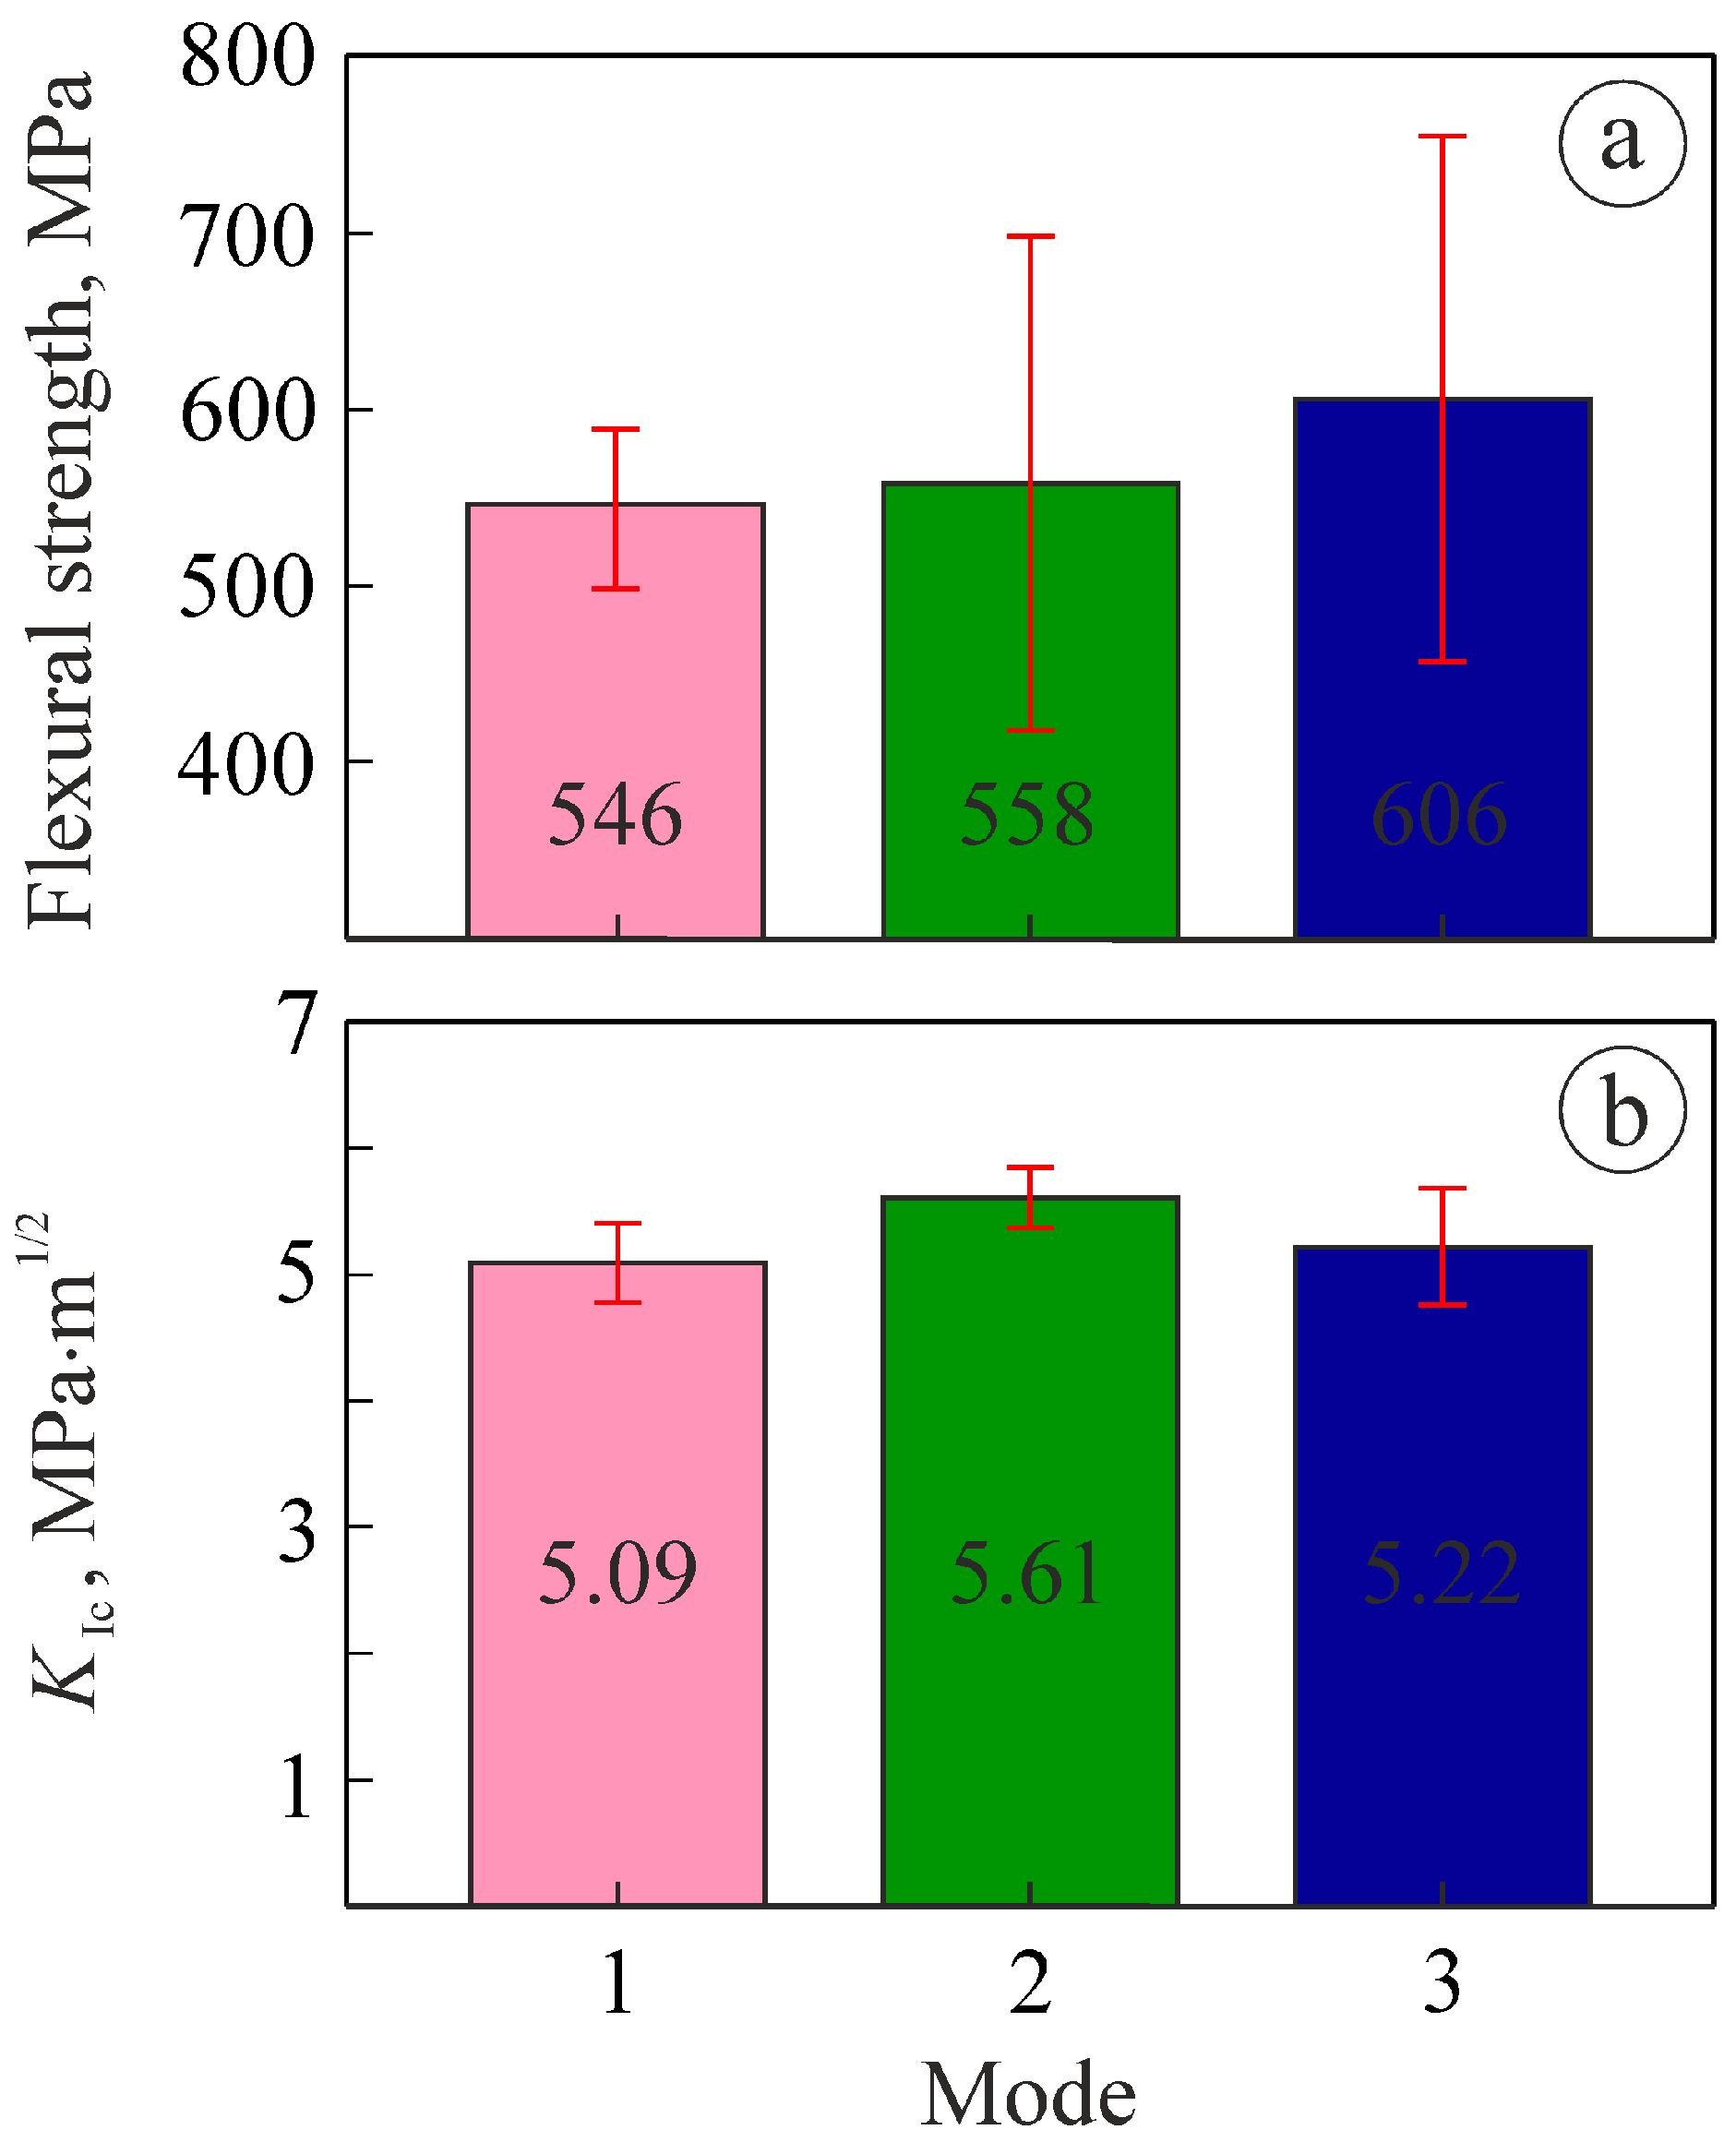
  • Flexural strength is almost linearly related to the t-ZrO2 phase fraction (Figure 6a);
  • There is no linear relationship between the fracture toughness estimated by the SENB method (Figure 6b) and the phase fractions (Figure 2). The maximum values of fracture toughness (5.61 ± 0.24 MPa·m1/2) were determined for the material sintered at intermediate temperature of 1580 °C, whereas the fractions of both the tetragonal and monoclinic ZrO2 phases change linearly with an increase in the sintering temperature.
The trends of the phase balance in the studied ceramics can be summarized as follows:
  • Judging by quantitative EDX analysis, the matrix phase is tetragonal ZrO2;
  • According to our suggestions, ternary Ce–Al–O phase particles with various stoichiometry were formed in the regions where XRD analysis revealed a dominance of O, Al, and Ce elements in the absence of Zr;
  • Although the percentages of zirconium and oxygen were determined in local areas (spectra S3 to S5 in Table 2, Table 3 and Table 4) using EDX analysis, this does not allow us to quantify the percentages of the m-ZrO2 and t-ZrO2 phases in these areas.

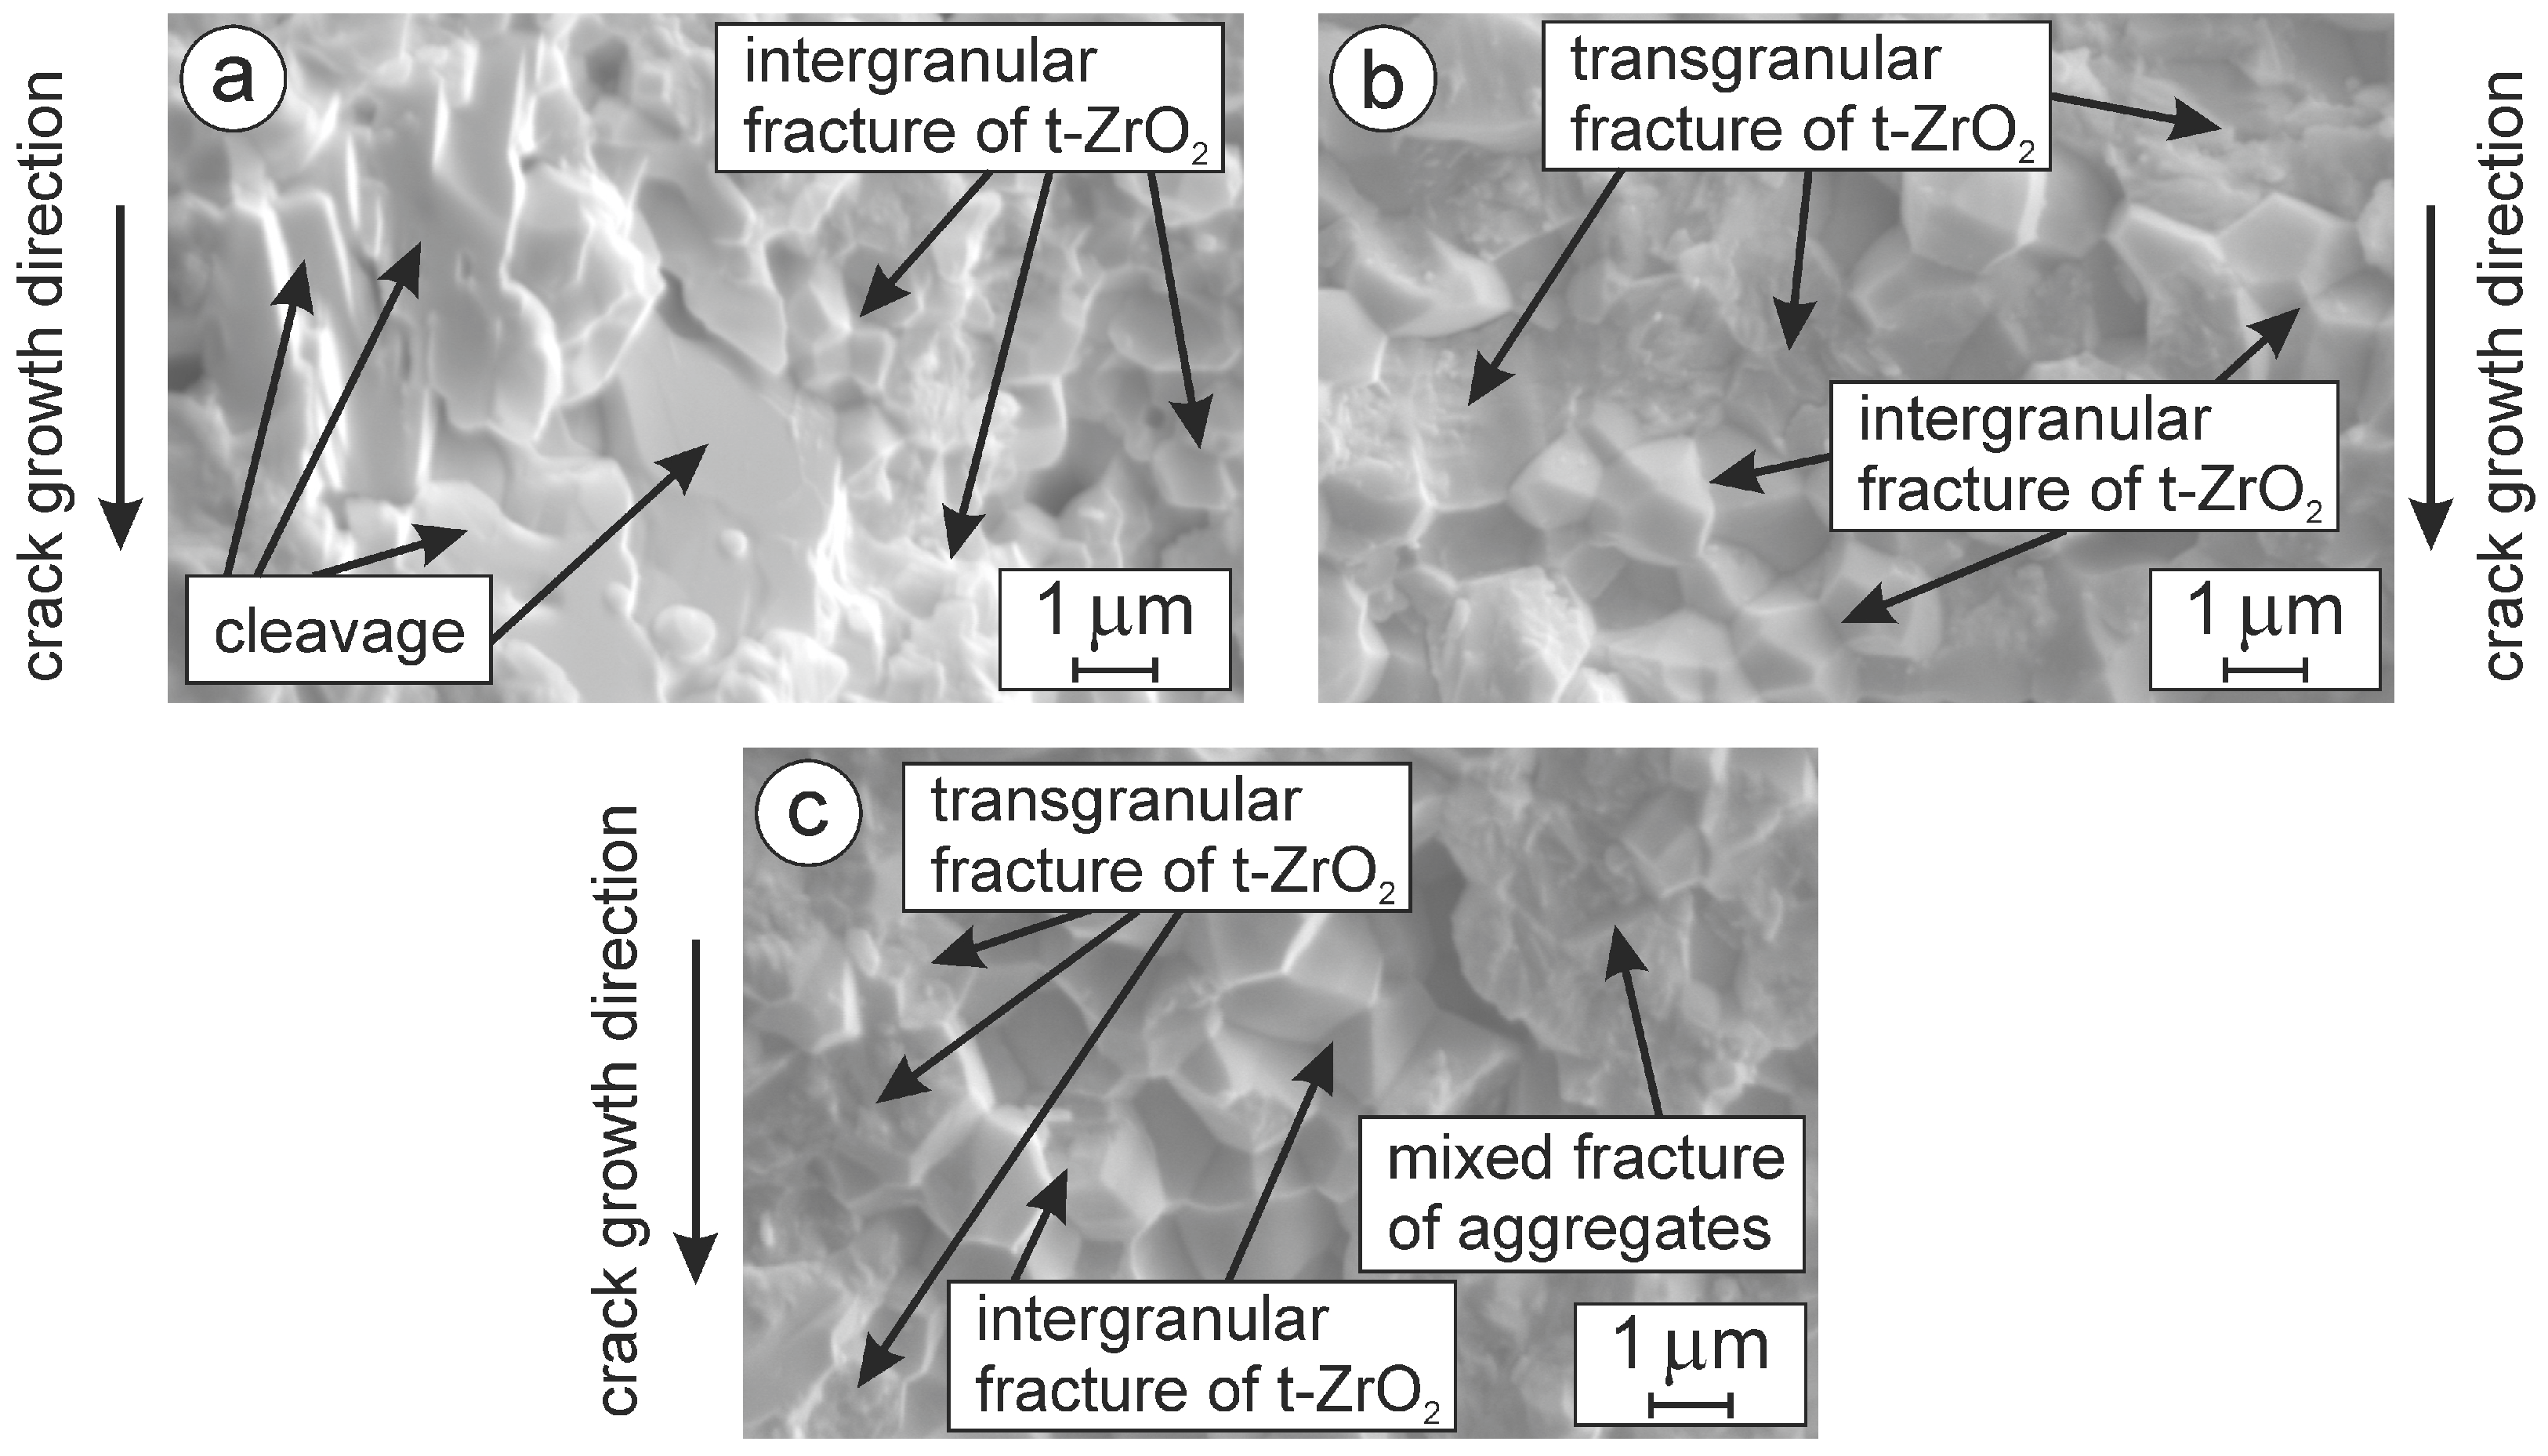
4.2. The Fracture Micromechanisms in Ceramic SENB Specimens That Underwent the Fracture Toughness Test

Ceramic SENB specimens that underwent the fracture toughness test were thoroughly studied for a dominant fracture micromechanism. Fine-grained zirconia ceramics doped with Y2O3, Al2O3, CoO, CeO2, and Fe2O3 exhibited a distinct fracture behavior.
The peculiarities of the fractures were studied in detail at high magnification. The features of the fractures’ micromechanisms were marked in the images taken at lower magnification to show their presence or absence. The main features were as follows (Figure 3f, Figure 4f and Figure 5f): (i) an intergranular fracture along the boundaries of partially sintered grains of the t-ZrO2 phase; (ii) a transgranular fracture by cleavage along appropriate planes occurred in the t-ZrO2 grains; (iii) an intergranular fracture along the boundaries of the aggregates of completely recrystallized fine grains of the ZrO2 phase; (iv) a cleavage along appropriate planes occurred in aggregates of Ce–Al–O phase particles; and (v) crack growth along the t-ZrO2/Ce–Al–O interface.
The SEM image of the fracture surface of the ceramic sintered in mode 1 showed quite smooth morphology at low magnification (Figure 3e). However, several features were revealed on the fracture surface at higher magnification (Figure 3f); namely, the areas of cleavage, the mixed fractures of the aggregates, and the intergranular fracture of t-ZrO2. The SEM image of a fractured specimen sintered in mode 1 (Figure 7a) demonstrates its fracture surface morphology in detail; namely, the areas of the cleavage of aggregates of ternary Ce–Al–O phase particles, 3–4 μm in size, and a mostly intergranular fracture of t-ZrO2 grains, 0.5–1.0 μm in size.
In summary, for the ceramic sintered in mode 1, a comparatively low fracture toughness was associated with a mixed mechanism of intergranular fracture of the t-ZrO2 matrix phase, a low-energy-consuming cleavage fracture in the regions of ternary Ce–Al–O phase particles, and a mixed fracture of the aggregates of these particles.
The SEM image of the fracture surface of the ceramic sintered in mode 2 showed smooth morphology at low magnification (Figure 4e), similar to that of the ceramic sintered in mode 1. At higher magnification (Figure 4f), the areas of a mixed fracture of aggregates, and an intergranular and transgranular fracture of t-ZrO2 can be detected. A detailed observation of the fracture surface of a fractured specimen sintered in mode 2 (Figure 7b) allowed for recognition of the domination of the intergranular fracture of t-ZrO2 that alternates with an occasional transgranular fracture. In this material, coarsened t-ZrO2 grains (0.8–1.2 μm in size) were observed occasionally, compared to those in the material sintered in mode 1. Several works [53,74,75] reported that fracture toughness is higher when there are crack deflections at grain boundaries, crack bridging by fibers or particles, transformation toughening, and pre-existing dislocations acting as barriers to crack propagation. For a specimen in mode 2, sintered at 1580 °C, we can observe the fracture along the boundaries of the aggregates of completely recrystallized fine grains of the ZrO2 phase. Crack deflection at the boundaries of the aggregates occurred due the high bond strength between adjacent ZrO2 grains. Occasionally, the crack grows by cleavage through the ZrO2 grains located directly ahead of its tip. Needle-shaped aggregates of ternary Ce–Al–O phase particles fracture both transgranularly (transverse fracture) and intergranularly (in the weakening locations). The high bond strength ensured the high-energy-consuming micromechanism of fracture in this ceramic, and its highest fracture toughness (5.61 ± 0.24 MPa·m1/2).
The SEM image of the fracture surface of the ceramic sintered in mode 3 also exhibited smooth morphology at low magnification (Figure 5e). The image at higher magnification (Figure 5f) showed the domination of transgranular fractures of the t-ZrO2 matrix phase grains, whereas intergranular fractures along their boundaries (Figure 7c) occurred less often. The main reason for the low fracture toughness of a specimen sintered at 1620 °C is suggested to be the material weakening in the locations where dark areas (Figure 5b,d) are adjacent to the matrix ZrO2 phase. In these locations, a crack grew along the t-ZrO2/Ce–Al–O interface. An additional reason for the low fracture toughness of this specimen is that cleavage along the appropriate planes occurred in aggregates of Ce–Al–O phase particles. The latter two micromechanisms are quite low-energy-consuming and negatively affect the mechanical properties of the material both locally (fracture toughness) and in bulk (flexural strength).
In summary, it can be stated that the sintering mode 2, namely, a sintering temperature of 1580 °C and isothermal holding time of 2 h, ensures a comparatively high fracture toughness (5.61 ± 0.24 MPa·m1/2) and moderate flexural strength (558 ± 140 MPa) of the studied ceramics due to the formation of an appropriate microstructure and phase composition.

5. Conclusions

Our thorough investigation of the mechanical and fracture properties of ZrO2–Y2O3–Al2O3–CoO–CeO2–Fe2O3 ceramics, supported with microstructural analysis, resulted in the following conclusions:
  • Doping zirconia with Y2O3, Al2O3, CoO, CeO2, and Fe2O3 stabilizes the t-ZrO2 phase and promotes the formation of a fine-grained microstructure.
  • In the material sintered at 1580 °C, somewhat coarsened t-ZrO2 grains were observed compared to the material sintered at 1550 °C. In the material sintered at 1620 °C, a weakening of the t-ZrO2 matrix phase occurred in locations adjacent to the regions of ternary Ce–Al–O phase particles. Such local degradations of the material caused by the active interdiffusion of elements during the sintering process and the tetragonal to monoclinic transformation in the t-ZrO2 phase deteriorated the mechanical properties both locally (fracture toughness) and in bulk (flexural strength).
  • Sintering at a temperature of 1580 °C for 2 h in an argon shielding atmosphere is recommended as the best processing route to obtain optimum mechanical properties. This generates t-ZrO2 grains with the highest bond strength and allows the implementation of the high-energy-consuming fracture micromechanism; namely, intergranular fracture along the boundaries of the aggregates of completely recrystallized fine grains of the t-ZrO2 phase and occasionally transgranular fractures of t-ZrO2 grains located directly ahead of the crack tip. As a result, the highest fracture toughness (5.61 ± 0.24 MPa·m1/2) of this ceramic can be achieved.

Author Contributions

Conceptualization, V.K., B.V. and Z.D.; methodology, V.K., B.V. and P.L.; validation, V.K., B.V., Z.D. and A.K.; formal analysis, Z.D. and A.K.; investigation, B.V., P.L. and V.V.; writing—original draft preparation, V.K., B.V. and V.V.; writing—review and editing, V.K., B.V., Z.D. and V.V.; supervision, V.K. and B.V.; funding acquisition, V.K. and Z.D. All authors have read and agreed to the published version of the manuscript.

Funding

This research was supported by the Ministry of Education and Science of Ukraine, under the project number 0122U000952, “Development of a scientific basis for the creation of multifunctional oxide ceramic materials and coatings”.

Data Availability Statement

The original contributions presented in the study are included in the article, further inquiries can be directed to the corresponding authors.

Acknowledgments

The authors are thankful to the staff of the Center of Electron Microscopy and X-ray Diffraction Microanalysis at Karpenko Physico-Mechanical Institute of the National Academy of Sciences of Ukraine for their kind help in performing the microstructural and microfractographic studies. Valentyna Vavrukh is also thankful to the Australian Academy of Science for the grant STV00014 that supported her visit to the University of Queensland (Australia) and her access to the microstructure characterization facilities at the Centre for Microscopy and Microanalysis (UQ), where some results presented in this paper were obtained.

Conflicts of Interest

The authors declare no conflicts of interest.

References

  1. Rahaman, M.N. Sintering of Ceramics, 1st ed.; CRC Press: Boca Raton, FL, USA, 2007; p. 388. [Google Scholar] [CrossRef]
  2. Arun, A.; Kumar, K.; Chowdhury, A. Influence of a grain-locking morphology on properties of doped ZrO2 ceramics made with ultrafine (~3 nm) nanoparticles. J. Mater. Res. 2022, 37, 4255–4267. [Google Scholar] [CrossRef]
  3. Wen, T.; Yuan, L.; Liu, T.; Sun, Q.; Jin, E.; Tian, C.; Yu, J. Enhanced ionic conductivity and thermal shock resistance of MgO stabilized ZrO2 doped with Y2O3. Ceram. Int. 2020, 46, 19835–19842. [Google Scholar] [CrossRef]
  4. Cokic, S.M.; Vleugels, J.; Van Meerbeek, B.; Camargo, B.; Willems, E.; Li, M.; Zhang, F. Mechanical properties, aging stability and translucency of speed-sintered zirconia for chairside restorations. Dent. Mater. 2020, 36, 959–972. [Google Scholar] [CrossRef] [PubMed]
  5. Kosmač, T.; Oblak, C.; Jevnikar, P.; Funduk, N.; Marion, L. The effect of surface grinding and sandblasting on flexural strength and reliability of Y-TZP zirconia ceramic. Dent. Mater. 1999, 15, 426–433. [Google Scholar] [CrossRef] [PubMed]
  6. Studart, A.R.; Filser, F.; Kocher, P.; Gauckler, L.J. Fatigue of zirconia under cyclic loading in water and its implications for the design of dental bridges. Dent. Mater. 2007, 23, 106–114. [Google Scholar] [CrossRef] [PubMed]
  7. Vojtko, M.; Puchy, V.; Múdra, E.; Milkovič, O.; Kovalčíková, A. Coarse-grain CeO2 doped ZrO2 ceramic prepared by spark plasma sintering. J. Eur. Ceram. Soc. 2020, 40, 4844–4852. [Google Scholar] [CrossRef]
  8. Kozlovskiy, A.L.; Zdorovets, M.V.; Shlimas, D.I. Study of the morphological and structural features of inert matrices based on ZrO2–CeO2 doped with Y2O3 and the effect of grain sizes on the strength properties of ceramics. Metals 2022, 12, 1687. [Google Scholar] [CrossRef]
  9. Kim, M.J.; Ahn, J.S.; Kim, J.H.; Kim, H.Y.; Kim, W.C. Effects of the sintering conditions of dental zirconia ceramics on the grain size and translucency. J. Adv. Prosthodont. 2013, 5, 161. [Google Scholar] [CrossRef]
  10. Denry, I.; Kelly, J.R. Emerging ceramic-based materials for dentistry. J. Dent. Res. 2014, 93, 1235–1242. [Google Scholar] [CrossRef]
  11. Denry, I.; Kelly, J. State of the art of zirconia for dental applications. Dent. Mater. 2008, 24, 299–307. [Google Scholar] [CrossRef]
  12. Reveron, H.; Chevalier, J. Yttria-stabilized zirconia as a biomaterial: From orthopedic towards dental applications. In Encyclopedia of Materials: Technical Ceramics and Glasses; Pomeroy, M., Ed.; Elsevier: Amsterdam, The Netherlands, 2021; pp. 540–552. [Google Scholar] [CrossRef]
  13. Chevalier, J.; Gremillard, L. 11-Zirconia ceramics. In Woodhead Publishing Series in Biomaterials, Bioceramics and Their Clinical Applications; Kokubo, T., Ed.; Woodhead Publishing: Cambridge, UK, 2008; pp. 243–265. [Google Scholar] [CrossRef]
  14. Guazzato, M.; Albakry, M.; Ringer, S.P.; Swain, M.V. Strength, fracture toughness and microstructure of a selection of all-ceramic materials. Part II. Zirconia-based dental ceramics. Dent. Mater. 2004, 20, 449–456. [Google Scholar] [CrossRef]
  15. Matsui, K.; Yoshida, H.; Ikuhara, Y. Isothermal sintering effects on phase separation and grain growth in yttria-stabilized tetragonal zirconia polycrystal. J. Am. Ceram. Soc. 2009, 92, 467–475. [Google Scholar] [CrossRef]
  16. Belli, R.; Hurle, K.; Schürrlein, J.; Petschelt, A.; Werbach, K.; Peterlik, H.; Rabe, T.; Mieller, B.; Lohbauer, U. Relationships between fracture toughness, Y2O3 fraction and phases content in modern dental yttria-doped zirconias. J. Eur. Ceram. Soc. 2021, 41, 7771–7782. [Google Scholar] [CrossRef]
  17. Rada, S.; Culea, E.; Rada, M. Novel ZrO2 based ceramics stabilized by Fe2O3, SiO2 and Y2O3. Chem. Phys. Lett. 2018, 696, 92–99. [Google Scholar] [CrossRef]
  18. Gupta, A.; Nisar, A.; Omar, S.; Balani, K. Densification kinetics of CeO2 reinforced 8 mol.% Y2O3 stabilized ZrO2 ceramics. JOM 2018, 70, 1937–1945. [Google Scholar] [CrossRef]
  19. Schlichting, K.W.; Padture, N.P.; Jordan, E.H.; Gell, M. Failure modes in plasma-sprayed thermal barrier coatings. Mater. Sci. Eng. A 2003, 342, 120–130. [Google Scholar] [CrossRef]
  20. Yang, E.; Luo, X.; Yang, G.; Li, C.; Li, C.; Takahashi, M. Epitaxial grain growth during 8YSZ splat formation on polycrystalline YSZ substrates by plasma spraying. Surf. Coat. Technol. 2015, 274, 37–43. [Google Scholar] [CrossRef]
  21. Zhu, D.; Miller, R.A. Development of advanced low conductivity thermal barrier coatings. Int. J. Appl. Ceram. Technol. 2004, 1, 86–94. [Google Scholar] [CrossRef]
  22. Loghman-Estarki, M.R.; Nejati, M.; Edris, H.; Shoja Razavi, R.; Jamali, H.; Pakseresht, A.H. Evaluation of hot corrosion behavior of plasma sprayed scandia and yttria co-stabilized nanostructured thermal barrier coatings in the presence of molten sulfate and vanadate salt. J. Eur. Ceram. Soc. 2014, 35, 693–702. [Google Scholar] [CrossRef]
  23. Guo, L.; Zhang, C.; Xu, L. Effects of TiO2 doping on the defect chemistry and thermo-physical properties of Yb2O3 stabilized ZrO2. J. Eur. Ceram. Soc. 2017, 37, 4163–4169. [Google Scholar] [CrossRef]
  24. Nagaraj, B.A.; Wortman, D.J. Burner rig evaluation of ceramic coatings with vanadium-contaminated fuels. J. Eng. Gas Turbines Power 1990, 112, 536–542. [Google Scholar] [CrossRef]
  25. Cutler, R.A.; Reynolds, J.R.; Jones, A. Sintering and characterization of polycrystalline monoclinic, tetragonal, and cubic zirconia. J. Am. Ceram. Soc. 1992, 75, 2173–2183. [Google Scholar] [CrossRef]
  26. Park, S.Y.; Kim, J.H.; Kim, M.C.; Song, H.S.; Park, C.G. Microscopic observation of degradation behavior in yttria and ceria stabilized zirconia thermal barrier coatings under hot corrosion. Surf. Coat. Technol. 2005, 190, 357–365. [Google Scholar] [CrossRef]
  27. Jones, R.L.; Jones, S.R.; Williams, C.E. Sulfation of CeO2 and ZrO2 relating to hot corrosion. J. Electrochem. Soc. 1985, 132, 1498–1501. [Google Scholar] [CrossRef]
  28. Jones, R.L.; Williams, C.E.; Jones, S.R. Reaction of vanadium compounds with ceramic oxides. J. Electrochem. Soc. 1986, 133, 227–230. [Google Scholar] [CrossRef]
  29. Palmero, P.; Fornabaio, M.; Montanaro, L.; Reveron, H.; Esnouf, C.; Chevalier, J. Towards long lasting zirconia-based composites for dental implants. Part I: Innovative synthesis, microstructural characterization and in vitro stability. Biomaterials 2015, 50, 38–46. [Google Scholar] [CrossRef]
  30. Reveron, H.; Fornabaio, M.; Palmero, P.; Fürderer, T.; Adolfsson, E.; Lughi, V.; Bonifacio, A.; Sergo, V.; Montanaro, L.; Chevalier, J. Towards long lasting zirconia-based composites for dental implants: Transformation induced plasticity and its consequence on ceramic reliability. Acta Biomater. 2017, 48, 423–432. [Google Scholar] [CrossRef] [PubMed]
  31. Nawa, M.; Kurizoe, N.; Okamoto, Y.; Ueno, A. Transformation-induced plastic deformation in Ce-TZP/alumina nanocomposite generated during fatigue tests at room temperature. J. Eur. Ceram. Soc. 2014, 34, 4337–4345. [Google Scholar] [CrossRef]
  32. Dmitrievskii, A.; Zhigachev, A.; Zhigacheva, D.; Tyurin, A. Structure and mechanical properties of the CaO–ZrO2–Al2O3 ceramic composites at low corundum concentrations. Tech. Phys. 2019, 64, 86–91. [Google Scholar] [CrossRef]
  33. Zhigachev, A.O.; Rodaev, V.V.; Zhigacheva, D.V.; Lyskov, N.V.; Shchukina, M.A. Doping of scandia-stabilized zirconia electrolytes for intermediate-temperature solid oxide fuel cell: A review. Ceram. Int. 2021, 47, 32490–32504. [Google Scholar] [CrossRef]
  34. Guo, C.X.; Wang, J.X.; He, C.R.; Wang, W.G. Effect of alumina on the properties of ceria and scandia co-doped zirconia for electrolyte-supported SOFC. Ceram. Int. 2013, 39, 9575–9582. [Google Scholar] [CrossRef]
  35. Badwal, S.P.S.; Ciacchi, F.T.; Milosevic, D. Scandia–zirconia electrolytes for intermediate temperature solid oxide fuel cell operation. Solid State Ion. 2000, 136, 91–99. [Google Scholar] [CrossRef]
  36. Vasyliv, B.D. A procedure for the investigation of mechanical and physical properties of ceramics under the conditions of biaxial bending of a disk specimen according to the ring–ring scheme. Mater. Sci. 2009, 45, 571–575. [Google Scholar] [CrossRef]
  37. Ostash, O.P.; Vasyliv, B.D.; Podhurs’ka, V.Y.; Vasyl’ev, O.D.; Brodnikovs’kyi, E.M.; Ushkalov, L.M. Optimization of the properties of 10Sc1CeSZ–NiO composite by the redox treatment. Mater. Sci. 2011, 46, 653–659. [Google Scholar] [CrossRef]
  38. Podhurska, V.; Vasyliv, B.; Ostash, O.; Brodnikovskyi, Y.; Vasylyev, O. Influence of treatment temperature on microstructure and properties of YSZ–NiO anode materials. Nanoscale Res. Lett. 2016, 11, 93. [Google Scholar] [CrossRef] [PubMed]
  39. Miyazaki, H.; Hyuga, H.; Hirao, K.; Ohji, T. Comparison of fracture resistance as measured by the indentation fracture method and fracture toughness determined by the single-edge-precracked beam technique using silicon nitrides with different microstructures. J. Eur. Ceram. Soc. 2007, 27, 2347–2354. [Google Scholar] [CrossRef]
  40. Moradkhani, A.; Baharvandi, H.; Tajdari, M.; Latifi, H.; Martikainen, J. Determination of fracture toughness using the area of micro-crack tracks left in brittle materials by Vickers indentation test. J. Adv. Ceram. 2013, 2, 87–102. [Google Scholar] [CrossRef]
  41. ASTM E 399-20a; Standard Test Method for Linear-Elastic Plane-Strain Fracture Toughness of Metallic Materials. ASTM International: West Conshohocken, PA, USA, 2020. [CrossRef]
  42. ASTM C 1421-18; Standard Test Methods for Determination of Fracture Toughness of Advanced Ceramics at Ambient Temperature. ASTM International: West Conshohocken, PA, USA, 2018. [CrossRef]
  43. Kübier, J. Fracture toughness of ceramics using the SEVNB method. In Fracture Resistance Testing of Monolithic and Composite Brittle Materials; Salem, J.A., Quinn, G.D., Jenkins, M.G., Eds.; ASTM International: West Conshohocken, PA, USA, 2002; pp. 93–106. [Google Scholar] [CrossRef]
  44. Anstis, G.R.; Chantikul, P.; Lawn, B.R.; Marshall, D.B. A critical evaluation of indentation techniques for measuring fracture toughness: I, Direct crack measurements. J. Am. Ceram. Soc. 1981, 64, 533–538. [Google Scholar] [CrossRef]
  45. Nindhia, T.G.T.; Lube, T. Single edge precrack V-notched beam (SEPVNB) fracture toughness testing on silicon nitride. Mater. Sci. Forum 2019, 962, 205–209. [Google Scholar] [CrossRef]
  46. Begand, S.; Spintzyk, S.; Geis-Gerstorfer, J.; Bourauel, C.; Keilig, L.; Lohbauer, U.; Worpenberg, C.; Greuling, A.; Adjiski, R.; Jandt, K.D.; et al. Fracture toughness of 3Y-TZP ceramic measured by the chevron-notch beam method: A round-robin study. Dent. Mater. 2022, 38, 1128–1139. [Google Scholar] [CrossRef]
  47. Yao, Q.; Chen, Y.; Wang, Z.; Qi, H. Evaluations on ceramic fracture toughness measurement by edge chipping. Coatings 2022, 12, 1146. [Google Scholar] [CrossRef]
  48. Romaniv, O.M.; Zalite, I.V.; Simin’kovych, V.M.; Tkach, O.N.; Vasyliv, B.D. Effect of the concentration of zirconium dioxide on the fracture resistance of Al2O3–ZrO2 ceramics. Mater. Sci. 1996, 31, 588–594. [Google Scholar] [CrossRef]
  49. Kulyk, V.V.; Duriagina, Z.A.; Vasyliv, B.D.; Vavrukh, V.I.; Lyutyy, P.Y.; Kovbasiuk, T.M.; Holovchuk, M.Y. Effects of yttria content and sintering temperature on the microstructure and tendency to brittle fracture of yttria-stabilized zirconia. Arch. Mater. Sci. Eng. 2021, 109, 65–79. [Google Scholar] [CrossRef]
  50. ISO 6872; Dentistry–Ceramic Materials. International Organization of Standardization: Geneva, Switzerland, 2015.
  51. Flamant, Q.; García Marro, F.; Roa Rovira, J.J.; Anglada, M. Hydrofluoric acid etching of dental zirconia. Part 1: Etching mechanism and surface characterization. J. Eur. Ceram. Soc. 2015, 36, 121–134. [Google Scholar] [CrossRef]
  52. Gere, J.M.; Timoshenko, S.P. Mechanics of Materials, 4th ed.; PWS Publishing Company: Boston, MA, USA, 1997; p. 912. [Google Scholar]
  53. Romaniv, O.M.; Vasyliv, B.D. Some features of formation of the structural strength of ceramic materials. Mater. Sci. 1998, 34, 149–161. [Google Scholar] [CrossRef]
  54. WinCSD. A Crystal Structure Determination and Crystallographic Calculation Software. Available online: https://www.wincsd.eu/ (accessed on 16 September 2023).
  55. Baubekova, G.; Akilbekov, A.; Feldbach, E.; Grants, R.; Manika, I.; Popov, A.I.; Schwartz, K.; Vasil’chenko, E.; Zdorovets, M.; Lushchik, A. Accumulation of radiation defects and modification of micromechanical properties under MgO crystal irradiation with swift 132Xe ions. Nucl. Instrum. Methods Phys. Res. Sect. B Beam Interact. Mater. At. 2020, 463, 50–54. [Google Scholar] [CrossRef]
  56. Lushchik, A.; Grants, R.; Kudryavtseva, I.; Manika, I.; Popov, A.I.; Seeman, V.; Shablonin, E.; Trautmann, C.; Vasil’chenko, E. Accumulation of structural defects and modification of micromechanical properties of MgAl2O4 single crystals irradiated with swift heavy ions. Opt. Mater. 2023, 142, 114035. [Google Scholar] [CrossRef]
  57. Kozlovskiy, A.; Borgekov, D.B.; Zdorovets, M.V.; Kadyrzhanov, K.K.; Shlimas, D.I. Study of radiation-induced damage processes in CeZrO4–YZrO3 ceramics caused by Helium irradiation. Materials 2022, 16, 198. [Google Scholar] [CrossRef]
  58. Feighery, A.J.; Irvine, J.T.S.; Fagg, D.P.; Kaiser, A. Phase relations at 1500°C in the ternary system ZrO2–Y2O3–TiO2. J. Solid State Chem. 1999, 143, 273–276. [Google Scholar] [CrossRef]
  59. Aoyama, T.; Kurata, N.; Hirota, K.; Yamaguchi, O. Formation of PbZrO3 by transformation of cubic ZrO2 solid solution. J. Am. Ceram. Soc. 1995, 78, 3163–3164. [Google Scholar] [CrossRef]
  60. Quadri, S.B.; Gilmore, C.M.; Quinn, C.; Skelton, E.F. Phase stability of ZrO2–Al2O3 thin films deposited by magnetron sputtering. Phys. Rev. B Condens. Matter 1989, 39, 6234–6237. [Google Scholar] [CrossRef] [PubMed]
  61. Mizuno, M.; Berjoan, R.; Coutures, J.P.; Foex, M. Phase diagram of the system Al2O3-CeO2 at liquidus temperature. Yogyo-Kyokai-Shi 1975, 83, 50–56. (In Japanese) [Google Scholar] [CrossRef]
  62. Maleki, H.; Bertola, V. Co–Ce–Al–O mesoporous catalysts for hydrogen generation via ammonia decomposition. Int. J. Hydrogen Energy 2024, 51, 267–275. [Google Scholar] [CrossRef]
  63. Mehta, A.; Vasudev, H.; Singh, S. Development and characterization of YSZ/Al2O3/CeO2 plasma spray coatings. Mater. Today Proc. 2023; in press. [Google Scholar] [CrossRef]
  64. Massachusetts Institute of Technology. Available online: https://web.mit.edu/2.813/www/readings/Ellingham_diagrams.pdf (accessed on 14 December 2023).
  65. Anderson, T.L. Fracture Mechanics: Fundamentals and Applications, 3rd ed.; CRC Press: Boca Raton, FL, USA, 2017; p. 684. [Google Scholar] [CrossRef]
  66. François, D.; Pineau, A.; Zaoui, A.; François, D. Mechanical Behaviour of Materials. 2: Viscoplasticity, damage, fracture and contact mechanics. In Solid Mechanics and Its Applications; Kluwer Academic Publishers: Dordrecht, The Netherlands, 1998; p. 414. [Google Scholar] [CrossRef]
  67. Yasui, K.; Hamamoto, K. Theoretical upper limit of dislocation density in slightly-ductile single-crystal ceramics. J. Phys. Condens. Matter 2023, 35, 455701. [Google Scholar] [CrossRef] [PubMed]
  68. German, R.M. Sintering trajectories: Description on how density, surface area, and grain size change. JOM 2016, 68, 878–884. [Google Scholar] [CrossRef]
  69. Kulyk, V.; Duriagina, Z.; Kostryzhev, A.; Vasyliv, B.; Marenych, O. Effects of sintering temperature and yttria content on microstructure, phase balance, fracture surface morphology, and strength of yttria-stabilized zirconia. Appl. Sci. 2022, 12, 11617. [Google Scholar] [CrossRef]
  70. Jiang, S.; Huang, X.; He, Z.; Buyers, A. Phase transformation and lattice parameter changes of non-trivalent rare earth-doped YSZ as a function of temperature. J. Mater. Eng. Perform. 2018, 27, 2263–2270. [Google Scholar] [CrossRef]
  71. Kumar, A.; Kumar, P.; Dhaliwal, A.S. Structural studies of zirconia and yttria doped zirconia for analysing it phase stabilization criteria. IOP Conf. Ser. Mater. Sci. Eng. 2021, 1033, 012052. [Google Scholar] [CrossRef]
  72. Vasyliv, B.D.; Podhurs’ka, V.Y.; Ostash, O.P.; Vasyl’ev, O.D.; Brodnikovs’kyi, E.M. Influence of reducing and oxidizing media on the physicomechanical properties of ScCeSZ–NiO and YSZ–NiO ceramics. Mater. Sci. 2013, 49, 135–144. [Google Scholar] [CrossRef]
  73. Khajavi, P.; Hendriksen, P.V.; Chevalier, J.; Gremillard, L.; Frandsen, H.L. Improving the fracture toughness of stabilized zirconia-based solid oxide cells fuel electrode supports: Effects of type and concentration of stabilizer(s). J. Eur. Ceram. Soc. 2020, 40, 5670–5682. [Google Scholar] [CrossRef]
  74. Barsoum, M.W. Fundamentals of Ceramics, 2nd ed.; CRC Press: Boca Raton, FL, USA, 2019; p. 648. [Google Scholar] [CrossRef]
  75. Yasui, K.; Hamamoto, K. Possibility of high ionic conductivity and high fracture toughness in all-dislocation-ceramics. Materials 2024, 17, 428. [Google Scholar] [CrossRef] [PubMed]
Figure 1. XRD patterns of sintered ceramics in modes 1 to 3 (Table 1). Notation: t is tetragonal and m is monoclinic ZrO2.
Crystals 14 00175 g001
Figure 2. Phase balance in the studied ceramics (Table 1). Notation: t is tetragonal and m is monoclinic ZrO2. The numbers above the bars indicate average values of the corresponding phase fractions.
Crystals 14 00175 g002
Figure 3. SEM (ad) microstructures and (e,f) fractography (SENB test method) of specimens of the investigated ceramics in mode 1 at (a,c,e) low and (b,d,f) high magnifications (Table 1). (a,b) BSD images; (cf) SE images. Zones of (a) general (spectrum S1) and (b) local (spectra S2, S3, S4, and S5) EDX analyses are marked with rectangles. The black arrows show the crack growth directions, the areas of cleavage, the mixed fractures of aggregates, and the intergranular fracture of t-ZrO2.
Crystals 14 00175 g003
Figure 4. SEM (ad) microstructures and (e,f) fractography (SENB test method) of specimens of the investigated ceramics in mode 2 at (a,c,e) low and (b,d,f) high magnifications (Table 1). (a,b) BSD images; (cf) SE images. Zones of (a) general (spectrum S1) and (b) local (spectra S2, S3, S4, and S5) EDX analyses are marked with rectangles. The black arrows show the crack growth directions, the areas of mixed fractures of aggregates, and the intergranular and transgranular fracture of t-ZrO2.
Crystals 14 00175 g004
Figure 5. SEM (ad) microstructures and (e,f) fractography (SENB test method) of specimens of the investigated ceramics in mode 3 at (a,c,e) low and (b,d,f) high magnifications (Table 1). (a,b) BSD images; (cf) SE images. Zones of (a) general (spectrum S1) and (b) local (spectra S2, S3, S4, and S5) EDX analyses are marked with rectangles. The black arrows show the crack growth directions, the areas of cleavage, the mixed fractures of aggregates, and the intergranular and transgranular fracture of t-ZrO2.
Crystals 14 00175 g005
Figure 6. Changes in the mechanical characteristics of the studied ceramics (Table 1): (a) flexural strength; (b) fracture toughness measured by the SENB method under three-point bending. The numbers inside the bars indicate the mean values of the corresponding parameters. The segments in red show the standard deviations for the corresponding parameters.
Crystals 14 00175 g006
Figure 7. SEM fractography (SE images; SENB test method) of specimens of the investigated ceramics in modes (a) 1, (b) 2, and (c) 3, taken at high magnification (Table 1). The black arrows show the crack growth directions, the areas of cleavage, the mixed fractures of aggregates, and the intergranular and transgranular fracture of t-ZrO2.
Crystals 14 00175 g007
Table 1. Marking of the investigated ceramics, their chemical compositions, and sintering modes.
Mode MarkingSystem and Chemical Composition of the Initial Powder Mixture (mol%)Sintering Mode
Temperature (°C)Time (h)
178ZrO2–1Y2O3–12Al2O3–1CoO–7CeO2–1Fe2O315502
278ZrO2–1Y2O3–12Al2O3–1CoO–7CeO2–1Fe2O315802
378ZrO2–1Y2O3–12Al2O3–1CoO–7CeO2–1Fe2O316202
Table 2. Lattice parameters and physical properties of the monoclinic and tetragonal ZrO2 phases of the studied ceramics sintered in modes 1–3.
ModePhase
MonoclinicTetragonal
Lattice ParameterCell Volume,
Ǻ3
ρ, g/cm3Lattice ParameterCell Volume,
Ǻ3
ρ, g/cm3
a, Ǻb, Ǻc, Ǻβ, deg.a, Ǻc, Ǻ
Refs. [58,59]5.31295.21255.147199.218140.73.5785.1966.64
15.167(2)5.261(3)5.375(2)98.57(2)144.5(2)5.665(7)3.6170(4)5.2000(6)68.03(2)6.015(2)
25.177(2)5.217(2)5.370(2)98.65(2)143.4(2)5.707(7)3.6150(3)5.1976(5)67.92(2)6.024(2)
35.163(3)5.268(3)5.378(3)98.59(2)144.7(2)5.657(9)3.6164(4)5.2000(6)68.01(2)6.017(2)
Table 3. The data of the EDX spectra 1–5, marked in Figure 3, for a ceramic specimen sintered in mode 1.
Chemical Element and X-ray SeriesSpectra
S1
(General)
S2
(Matrix)
S3S4S5
wt%at%wt%at%wt%at%wt%at%wt%at%
O K24.2862.1921.8661.9828.6147.5235.6055.1234.3261.07
Mg K0.951.12
Al K4.216.3947.6946.9744.3740.7325.0626.44
Fe K0.310.230.370.301.260.600.690.310.370.19
Co K0.110.092.511.131.710.721.870.90
Y L
Zr L66.1329.7171.9135.7724.587.67
Ce L5.071.485.751.8619.933.7817.633.1212.852.61
Table 4. The data of the EDX spectra 1–5, marked in Figure 4, for a ceramic specimen sintered in mode 2.
Chemical Element and X-ray SeriesSpectra
S1
(General)
S2
(Matrix)
S3S4S5
wt%at%wt%at%wt%at%wt%at%wt%at%
O K24.0160.3320.3759.7233.6052.8334.9256.1841.4355.09
Mg K1.221.26
Al K6.699.9744.4341.4238.5337.2156.2144.32
Fe K0.430.361.200.540.720.350.600.23
Co K0.230.160.670.541.780.761.630.710.430.16
Y L
Zr L63.2927.8972.9437.5111.663.52
Ce L5.781.655.591.8717.773.1912.542.031.330.20
Table 5. The data of the EDX spectra 1–5, marked in Figure 5, for a ceramic specimen sintered in mode 3.
Chemical Element and X-ray SeriesSpectra
S1
(General)
S2
(Matrix)
S3S4S5
wt%at%wt%at%wt%at%wt%at%wt%at%
O K23.9861.7220.0559.2435.1854.0034.4357.2232.3853.11
Mg K1.421.431.421.54
Al K4.546.9344.9540.9135.6735.1640.4639.35
Fe K0.490.380.350.160.710.340.580.27
Co K0.480.340.870.591.360.571.590.721.250.56
Y L
Zr L64.4629.0973.0738.0712.993.796.801.96
Ce L6.541.925.521.7216.742.9314.612.7717.113.21
Disclaimer/Publisher’s Note: The statements, opinions and data contained in all publications are solely those of the individual author(s) and contributor(s) and not of MDPI and/or the editor(s). MDPI and/or the editor(s) disclaim responsibility for any injury to people or property resulting from any ideas, methods, instructions or products referred to in the content.

