
Phylloplane Biodiversity and Activity in the City at Different Distances from the Traffic Pollution Source

 , , , , and
Abstract
: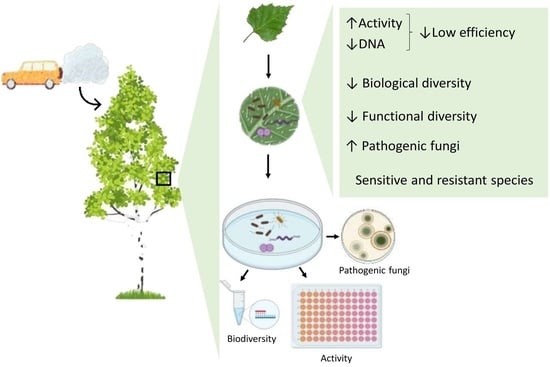
1. Introduction
2. Results
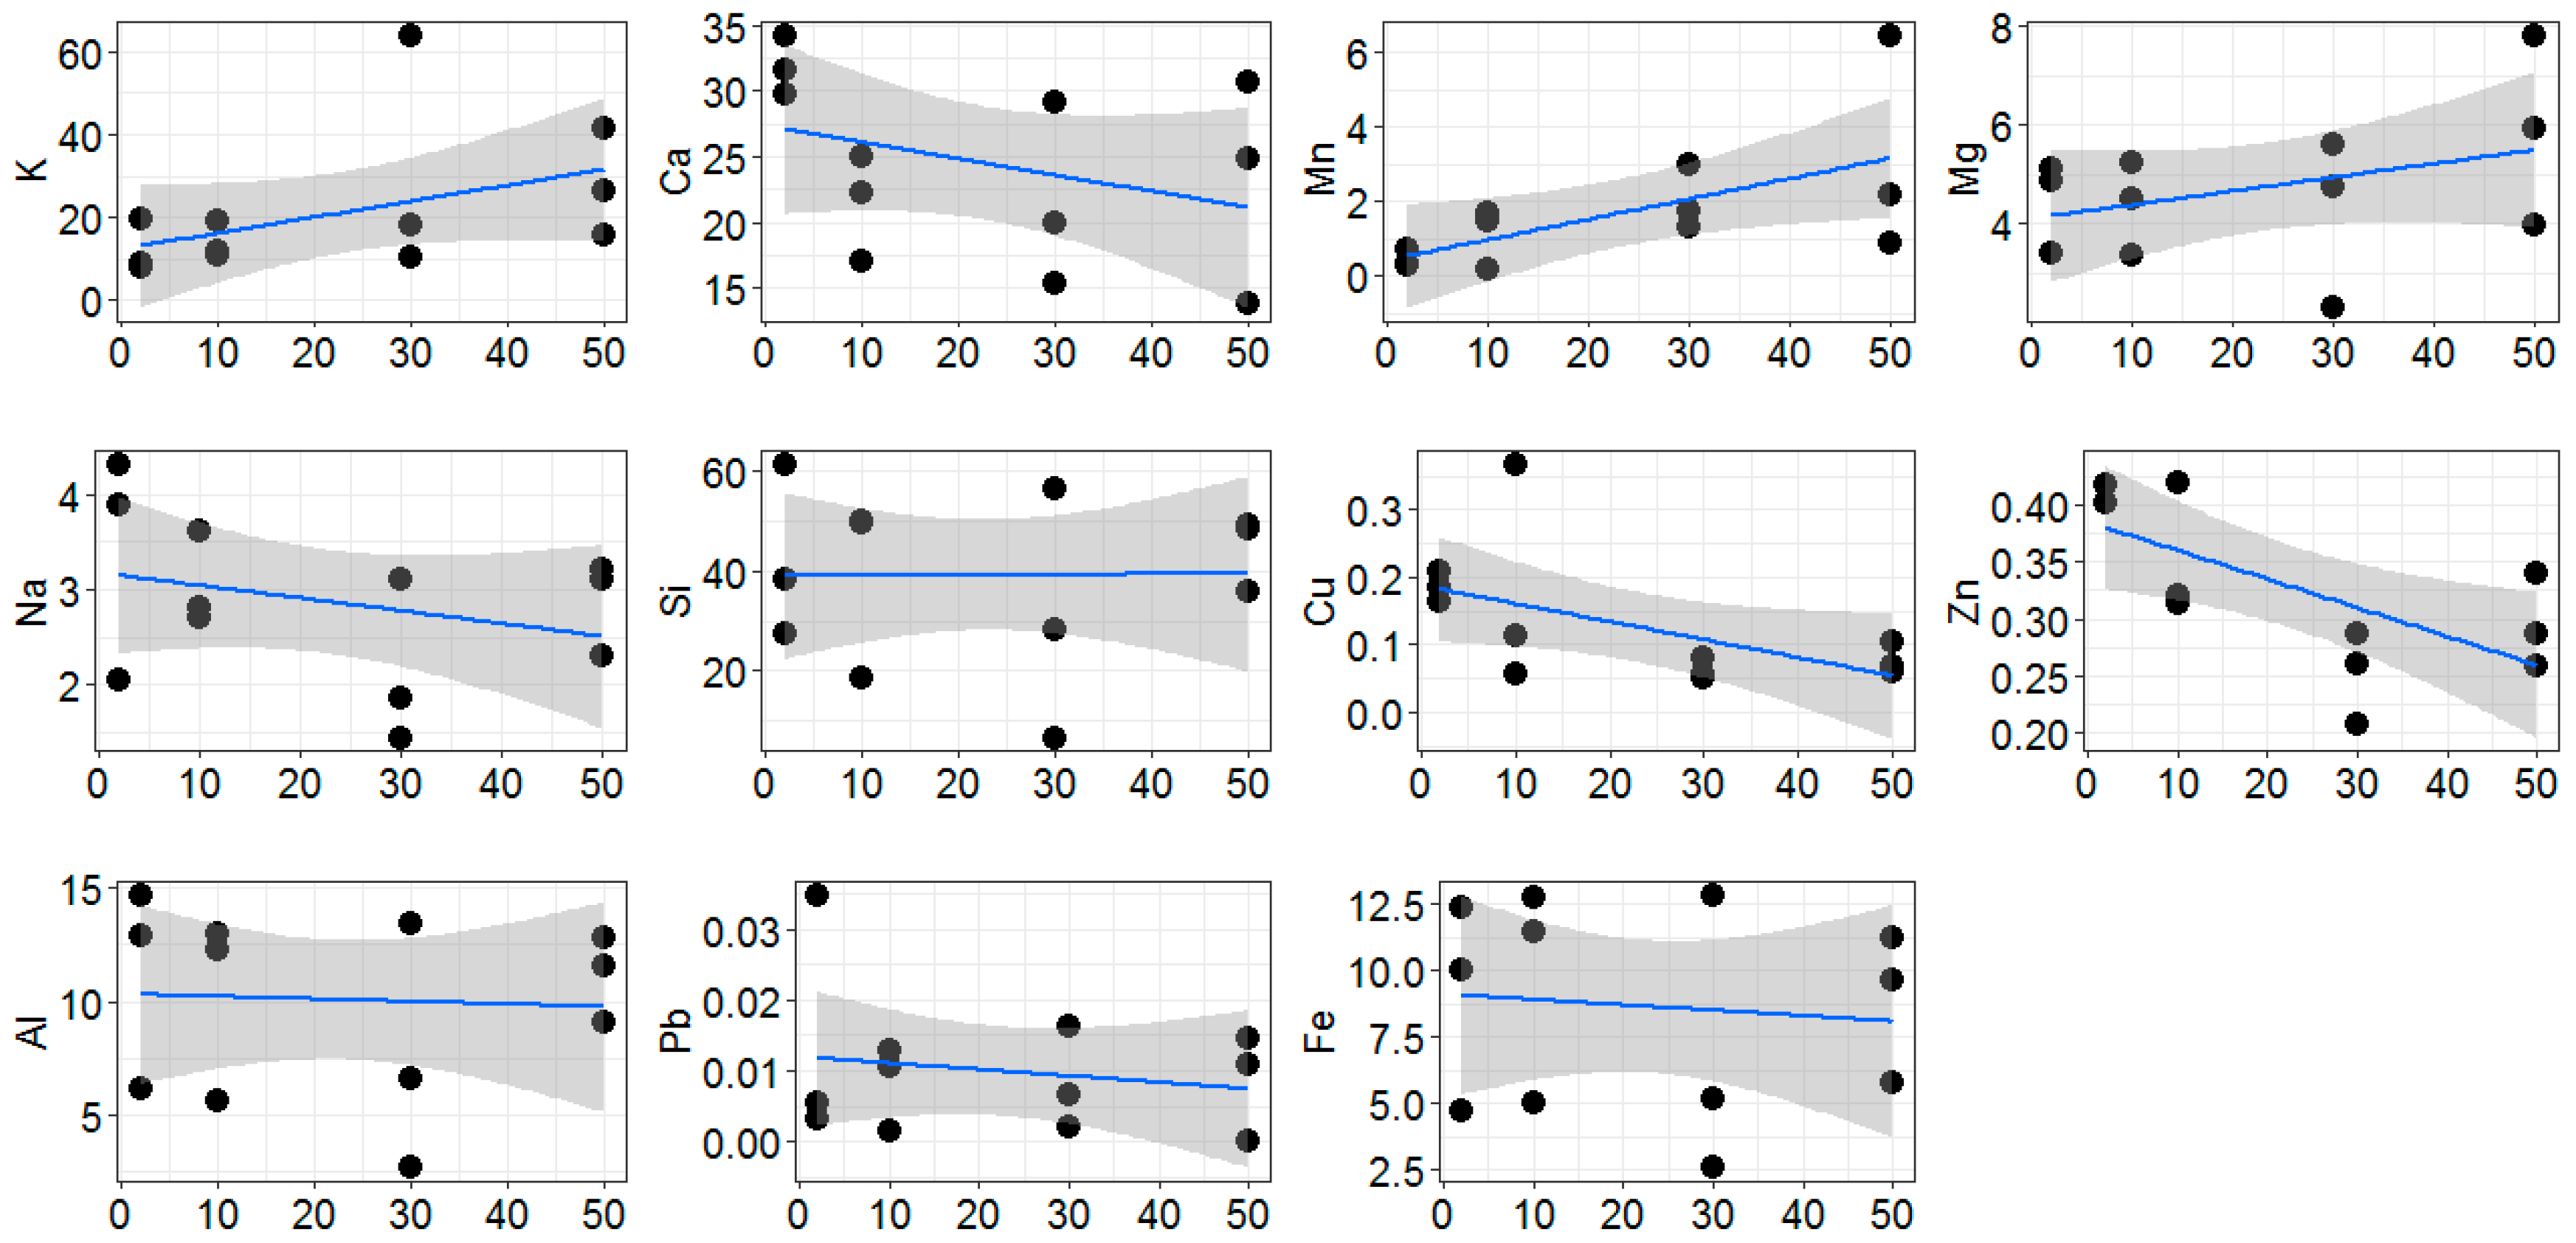
2.1. Environmental Conditions along the Gradient
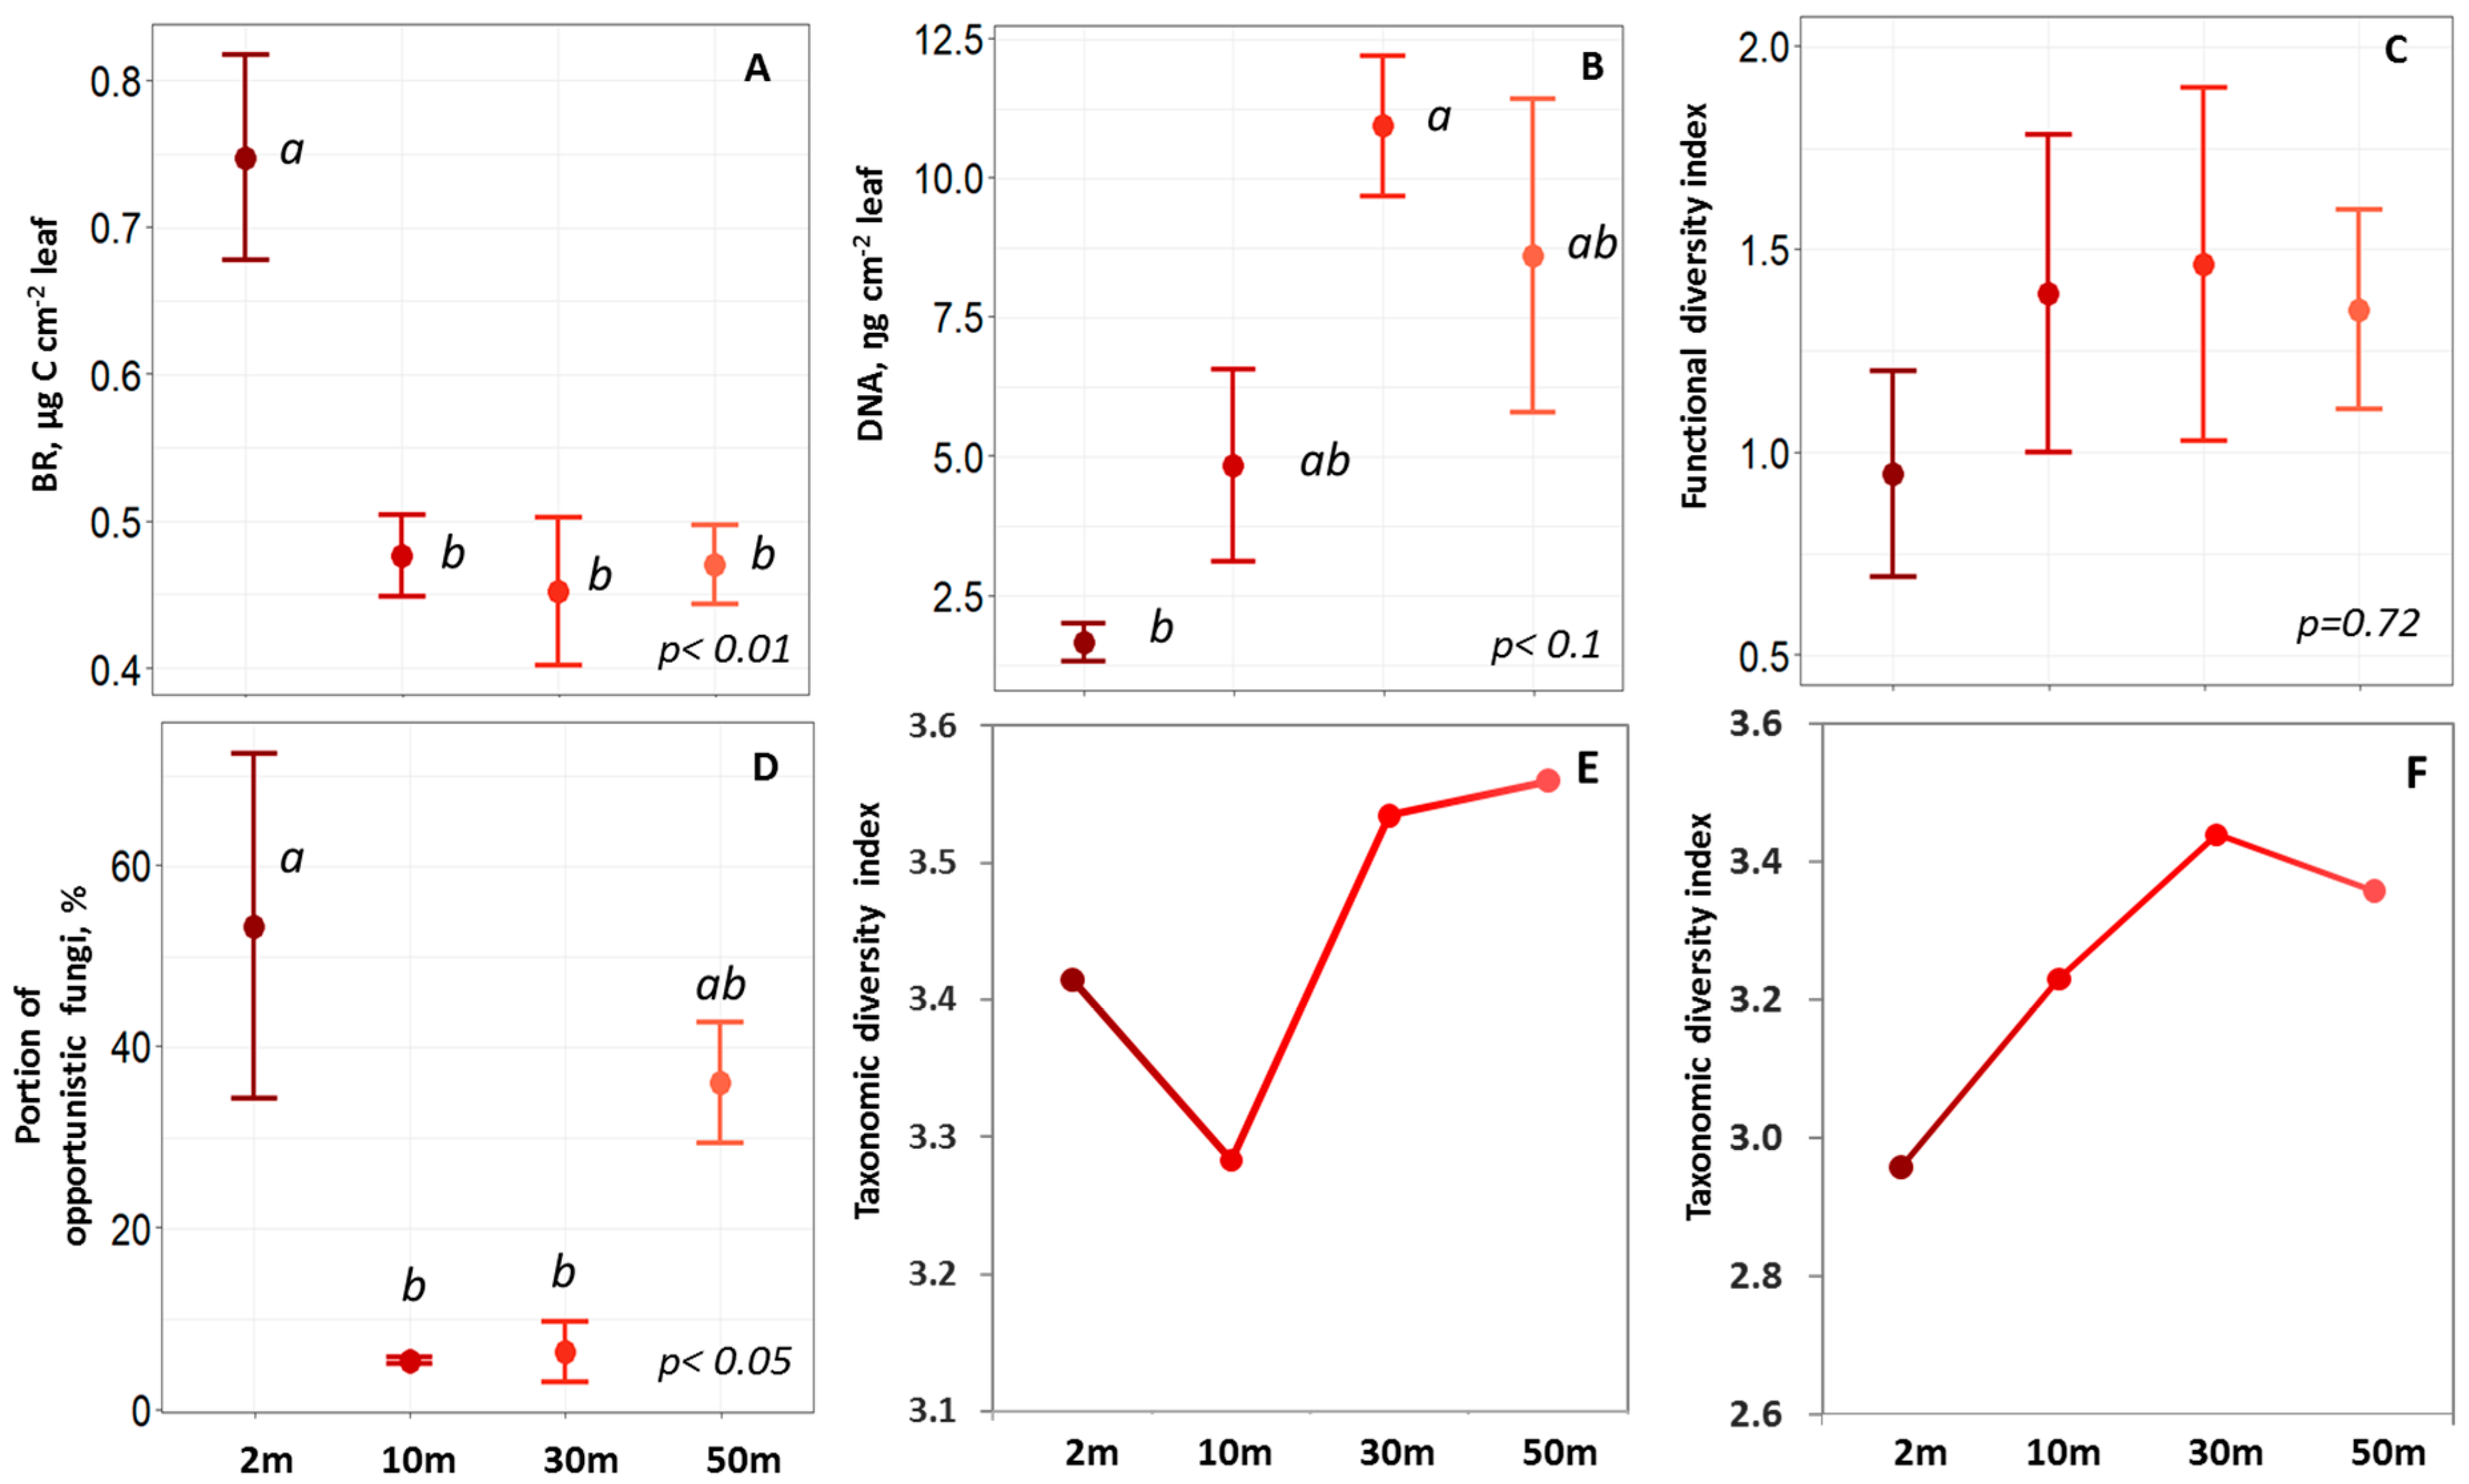
2.2. Phylloplane Activity, DNA Amount, Pathogens, and Diversity
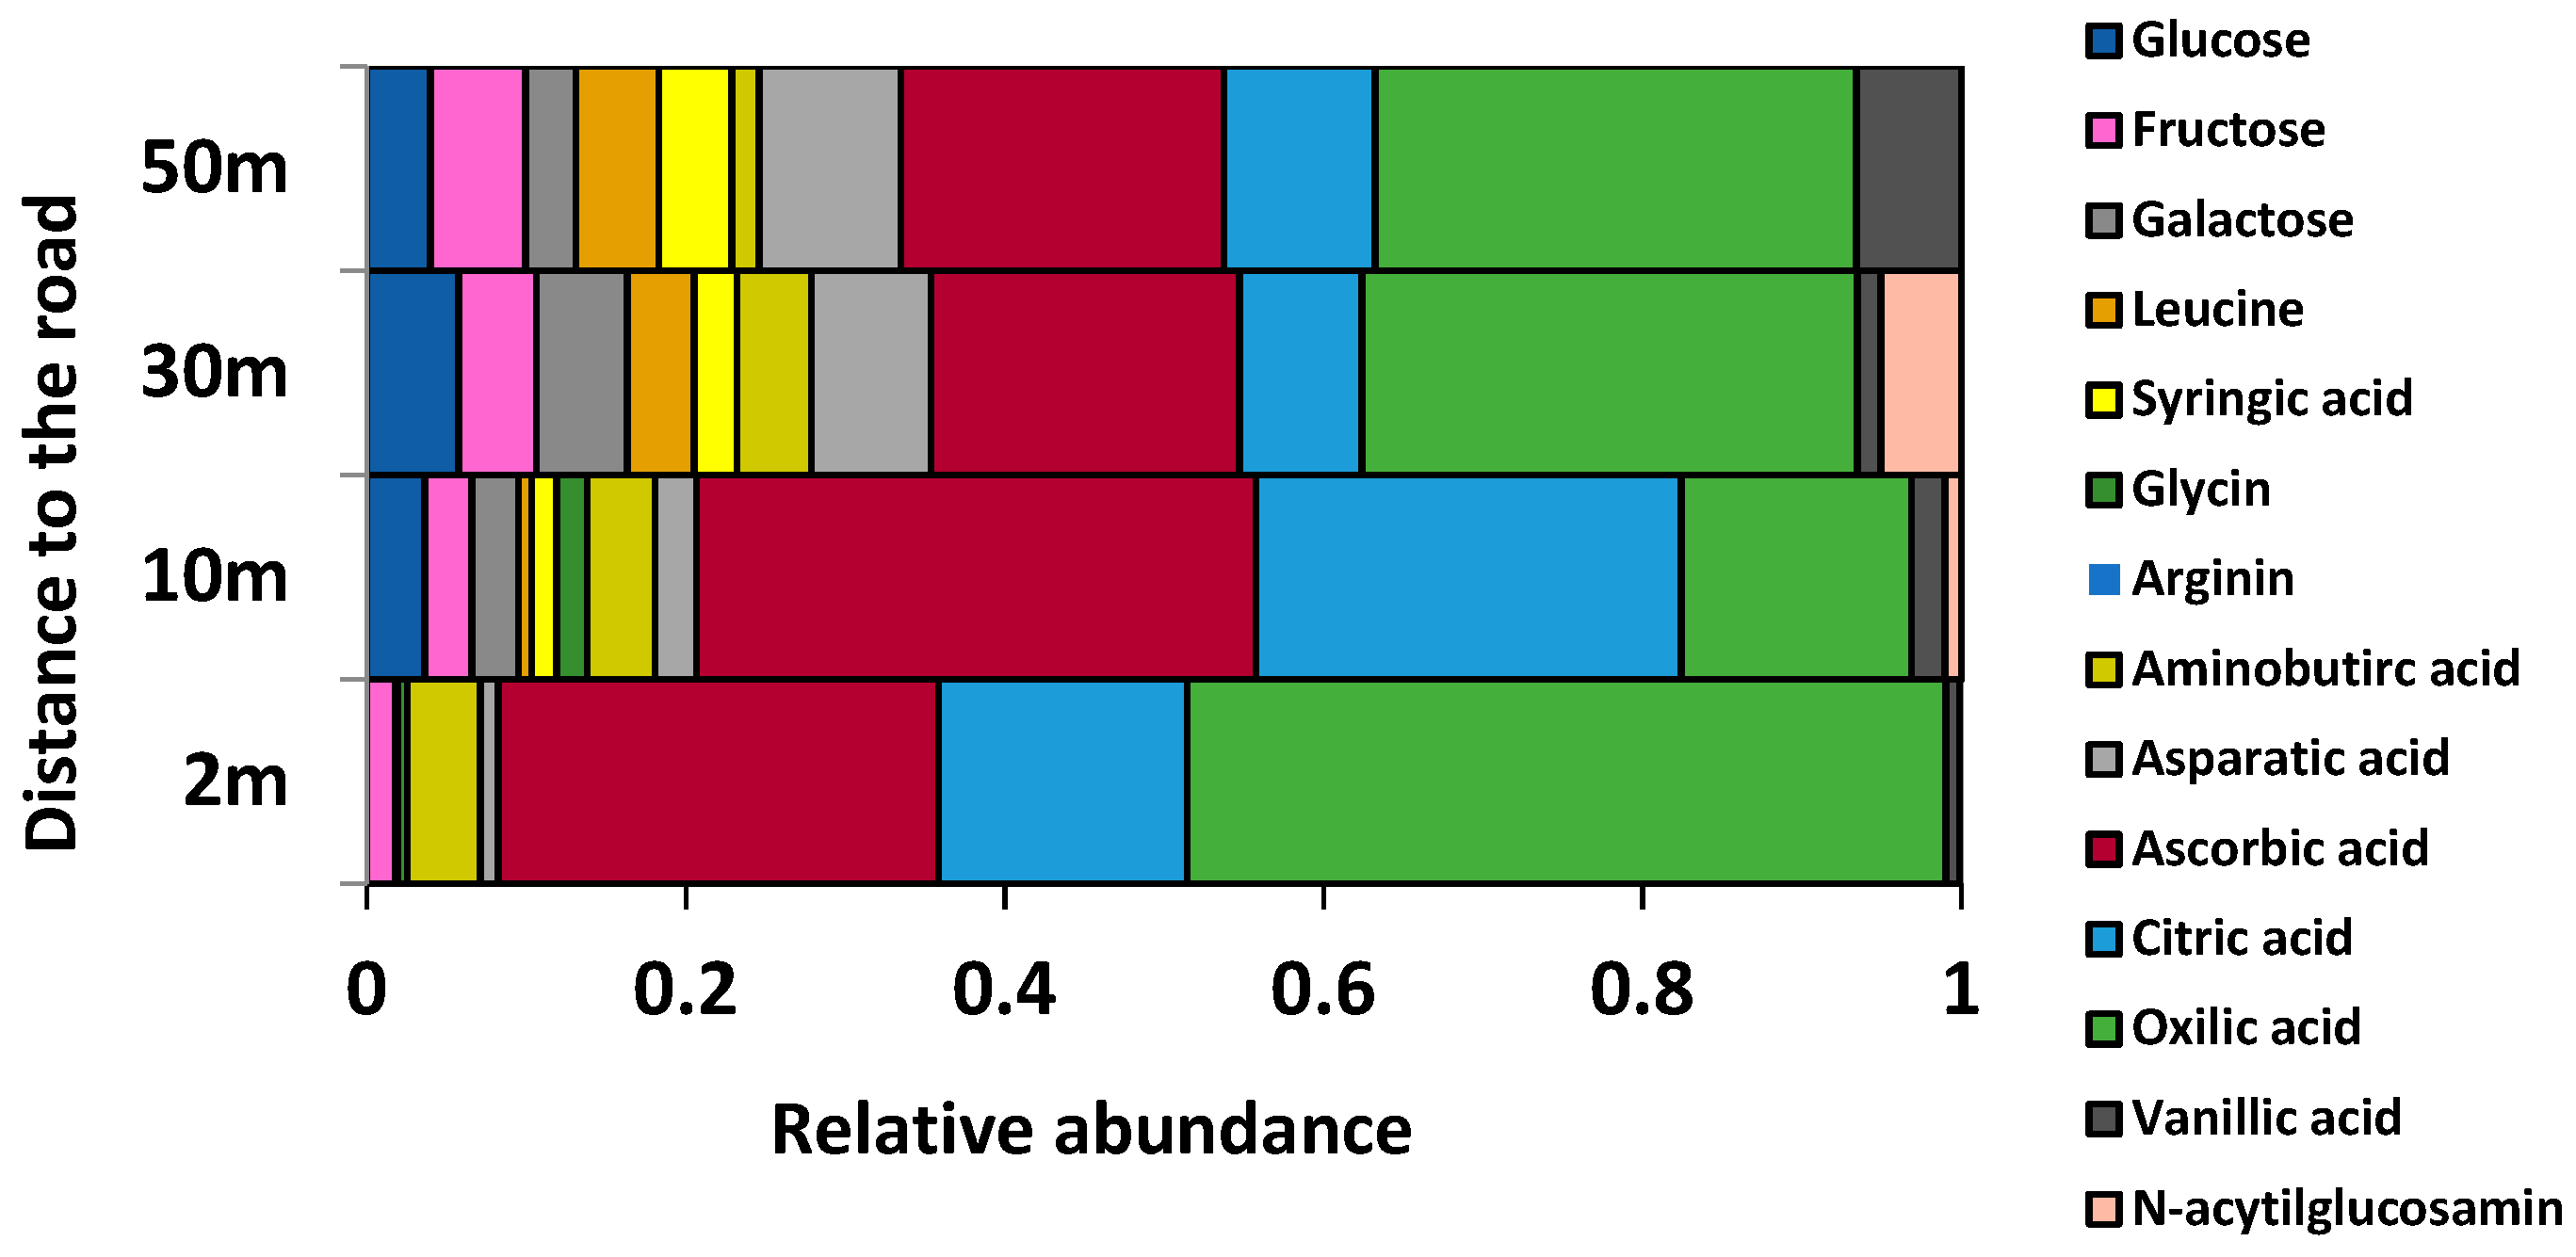
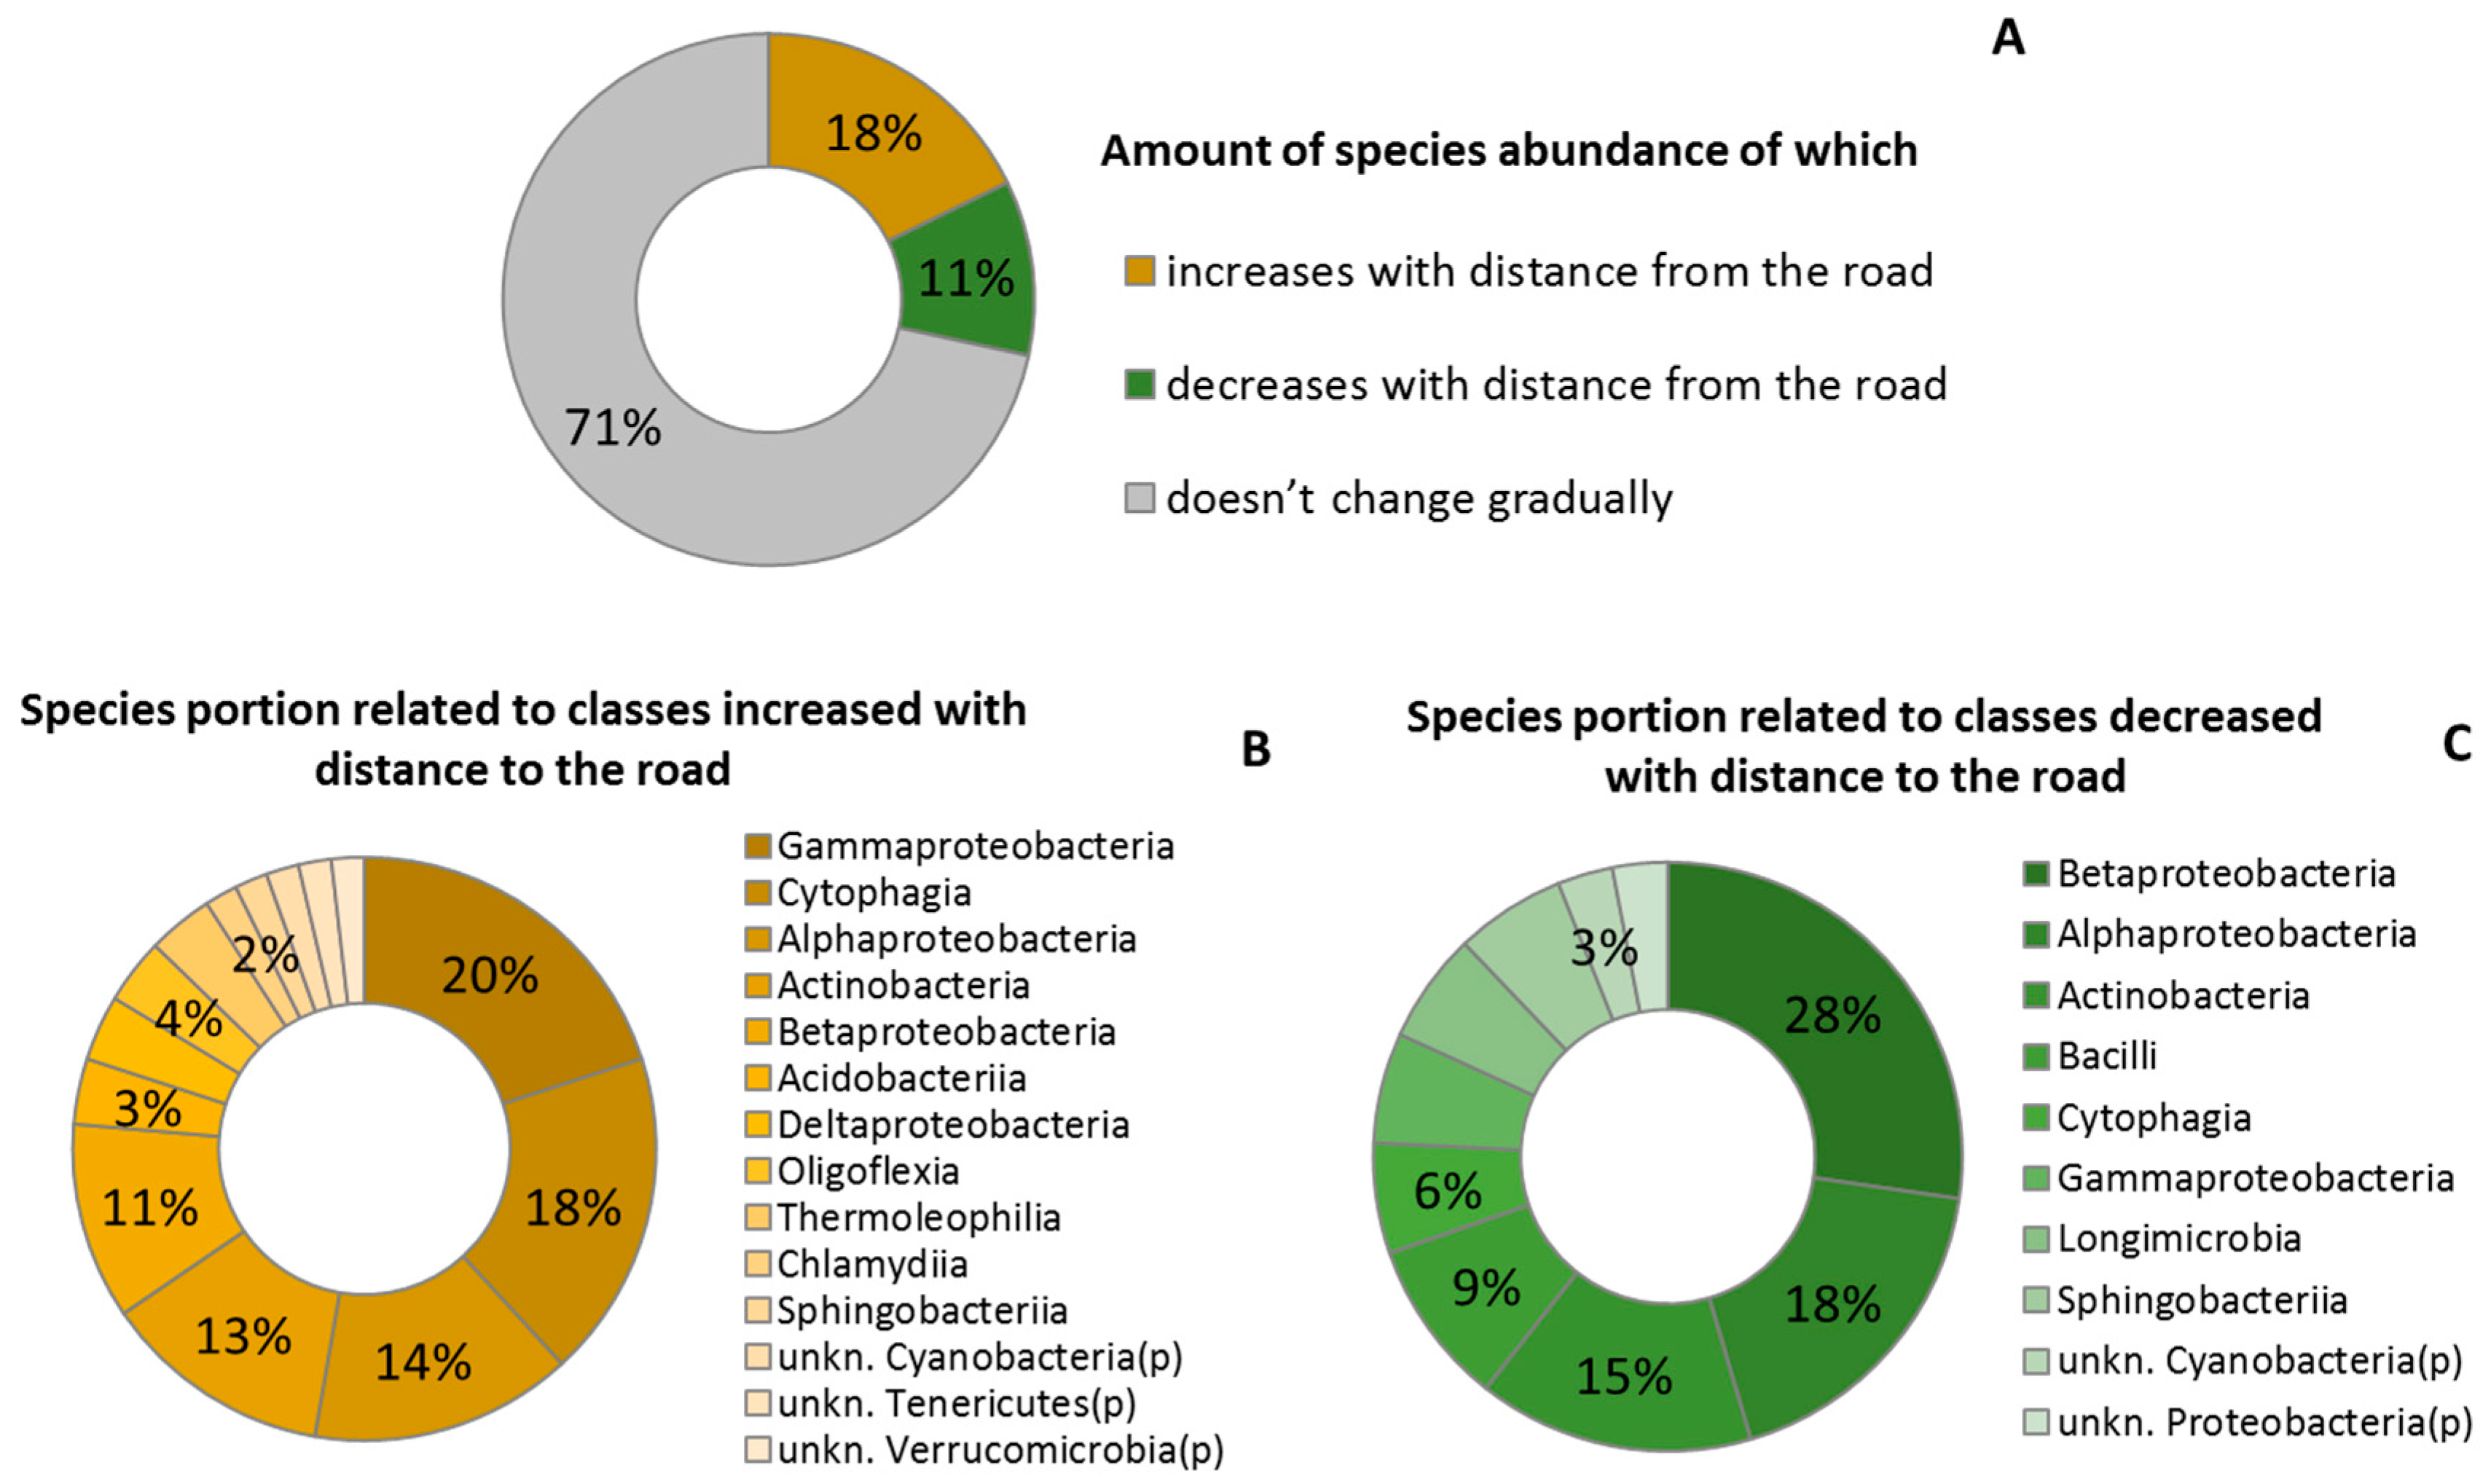
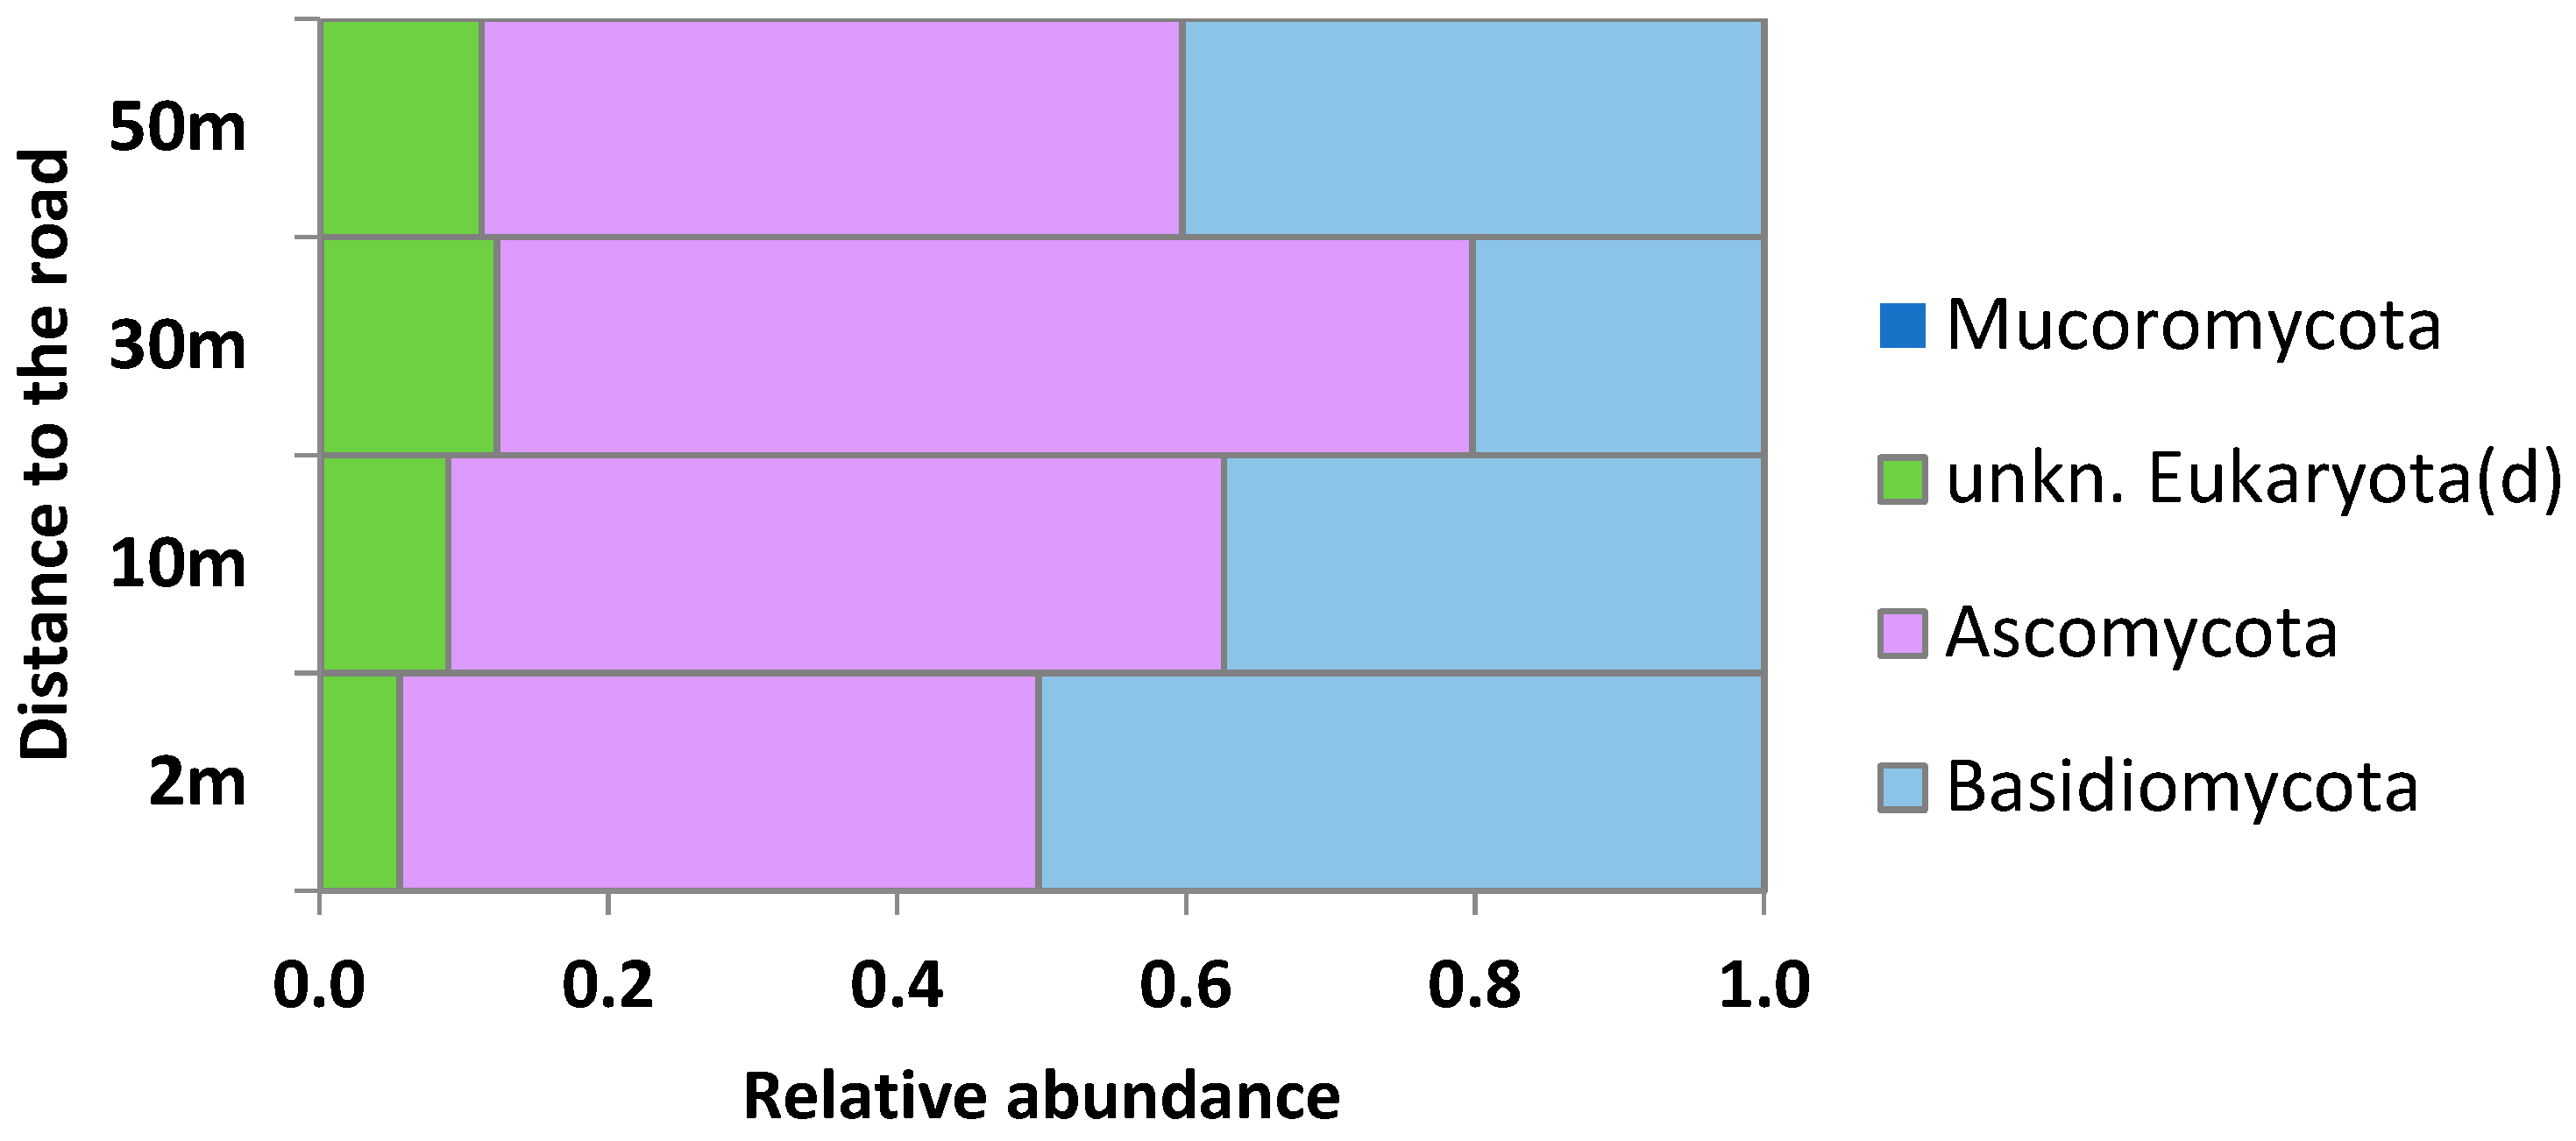
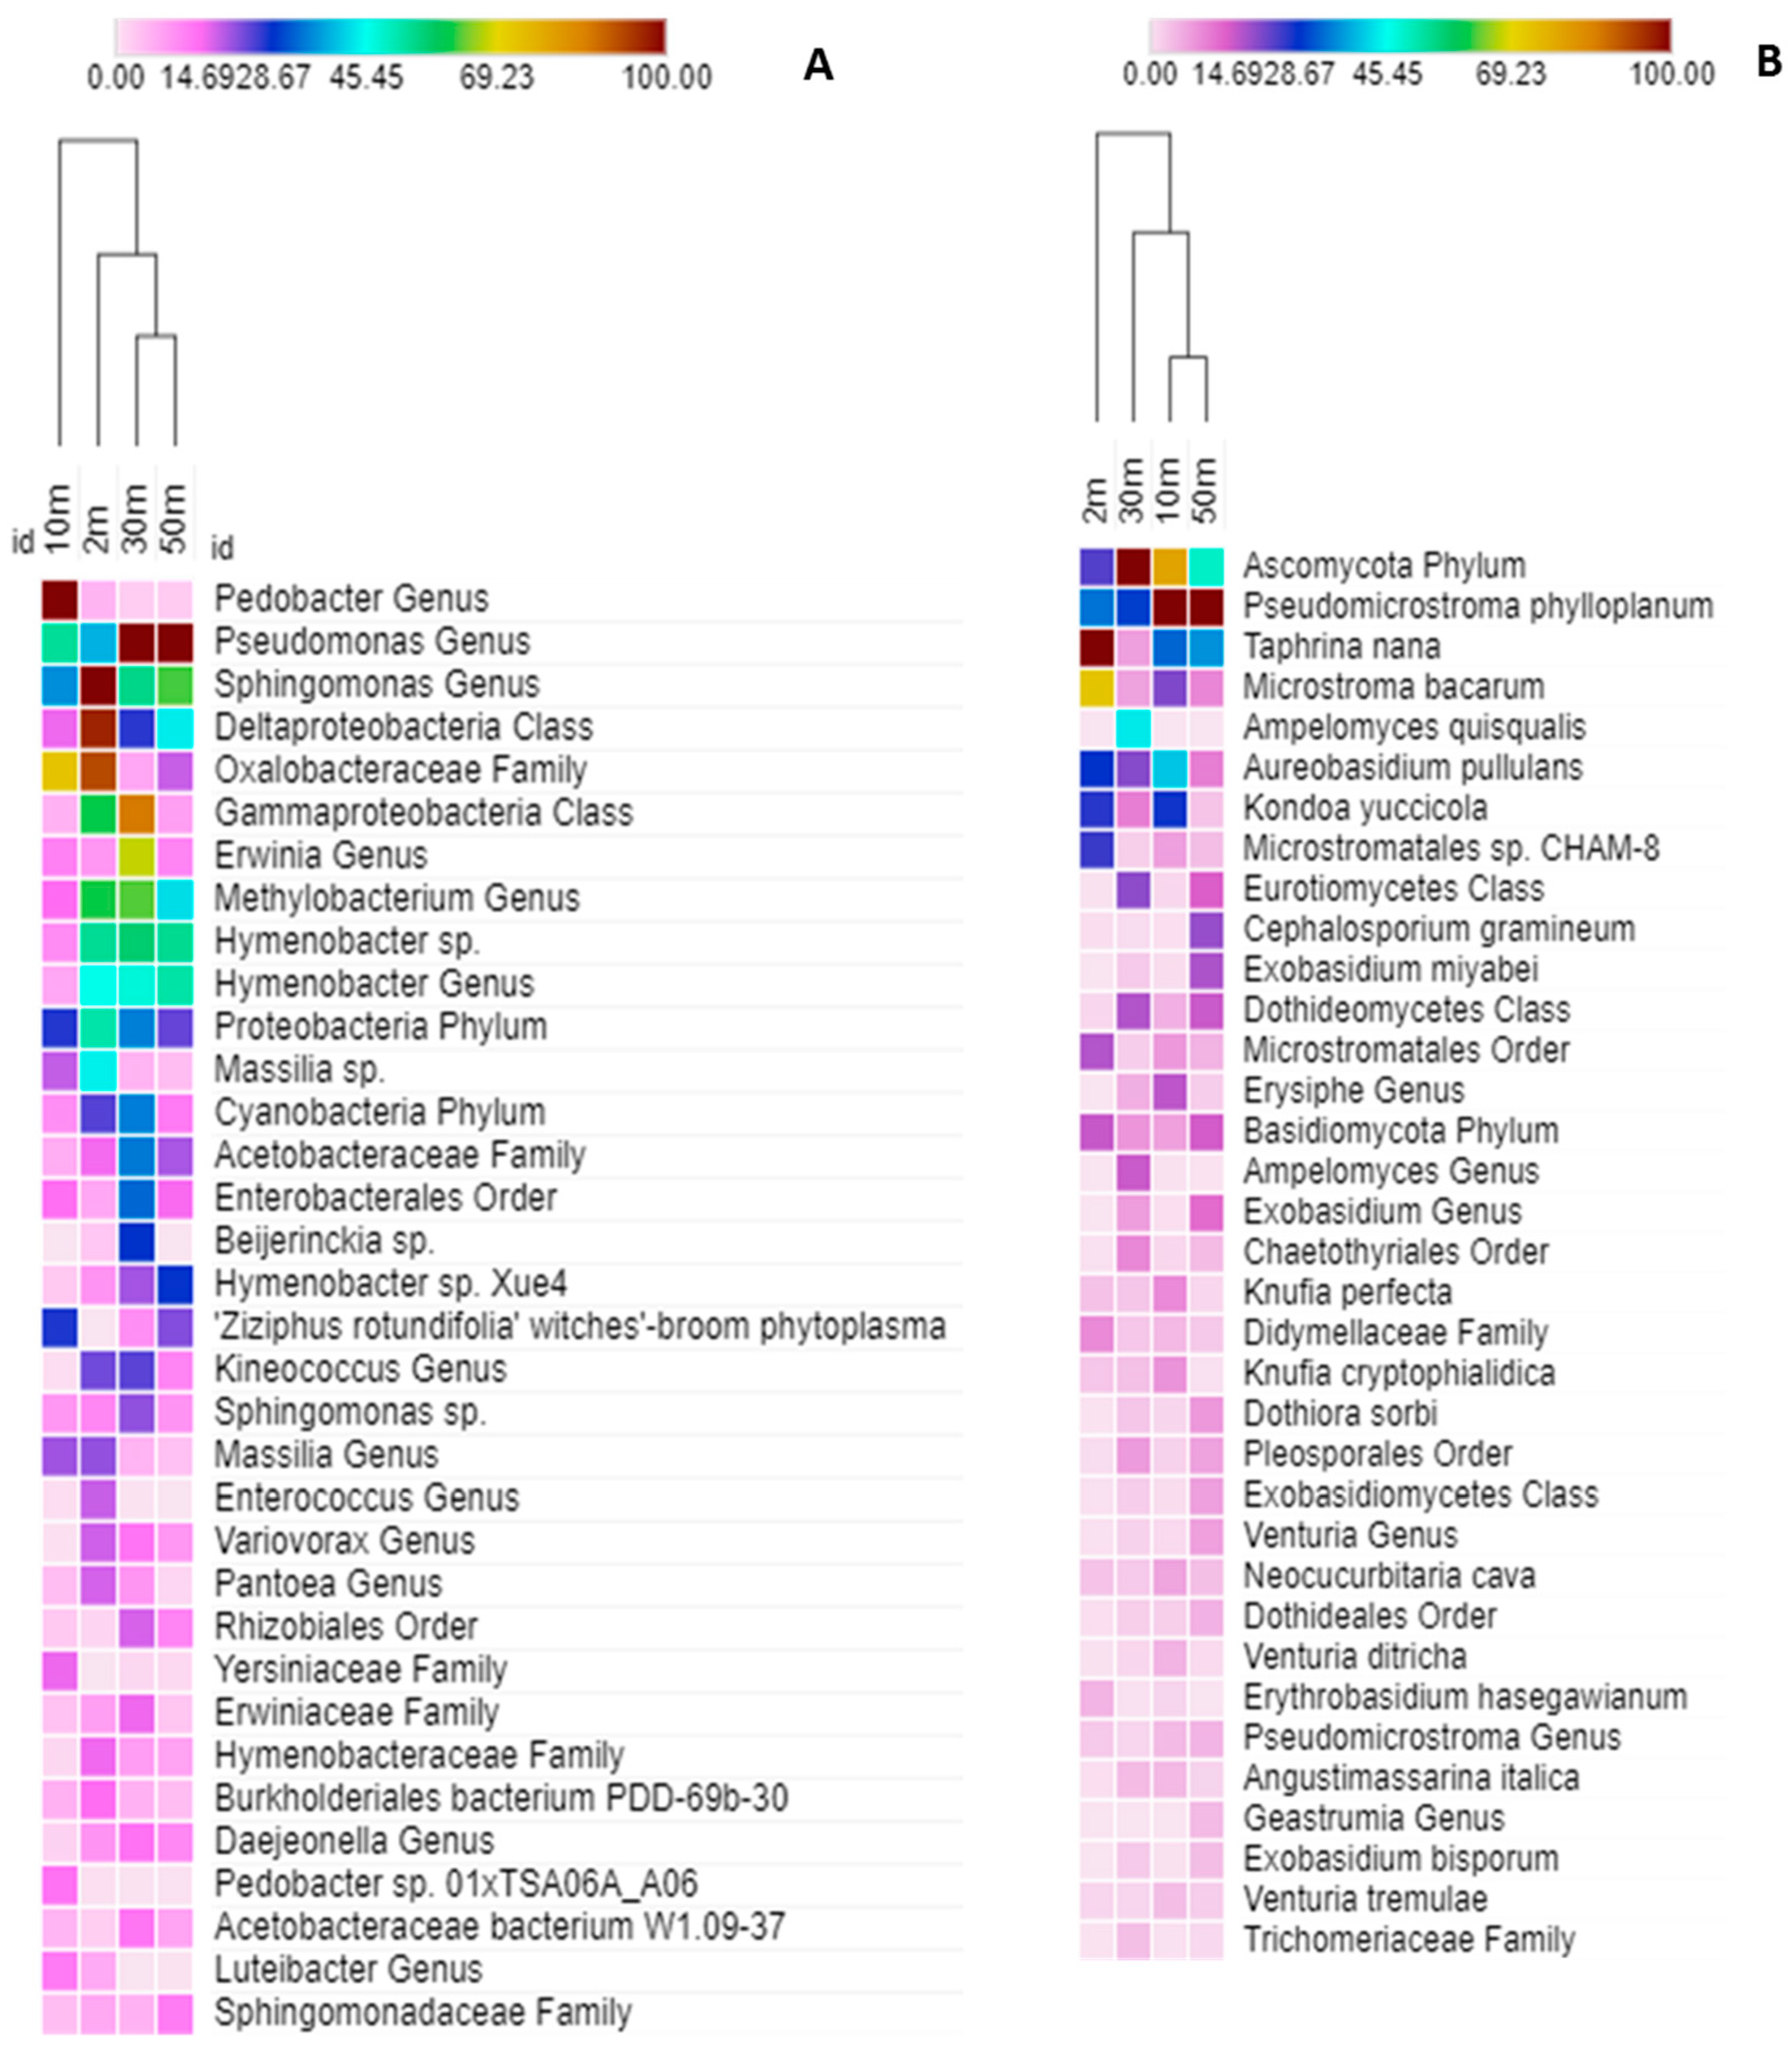
2.3. Taxonomic Structure of the Phylloplane’s Microbial Community
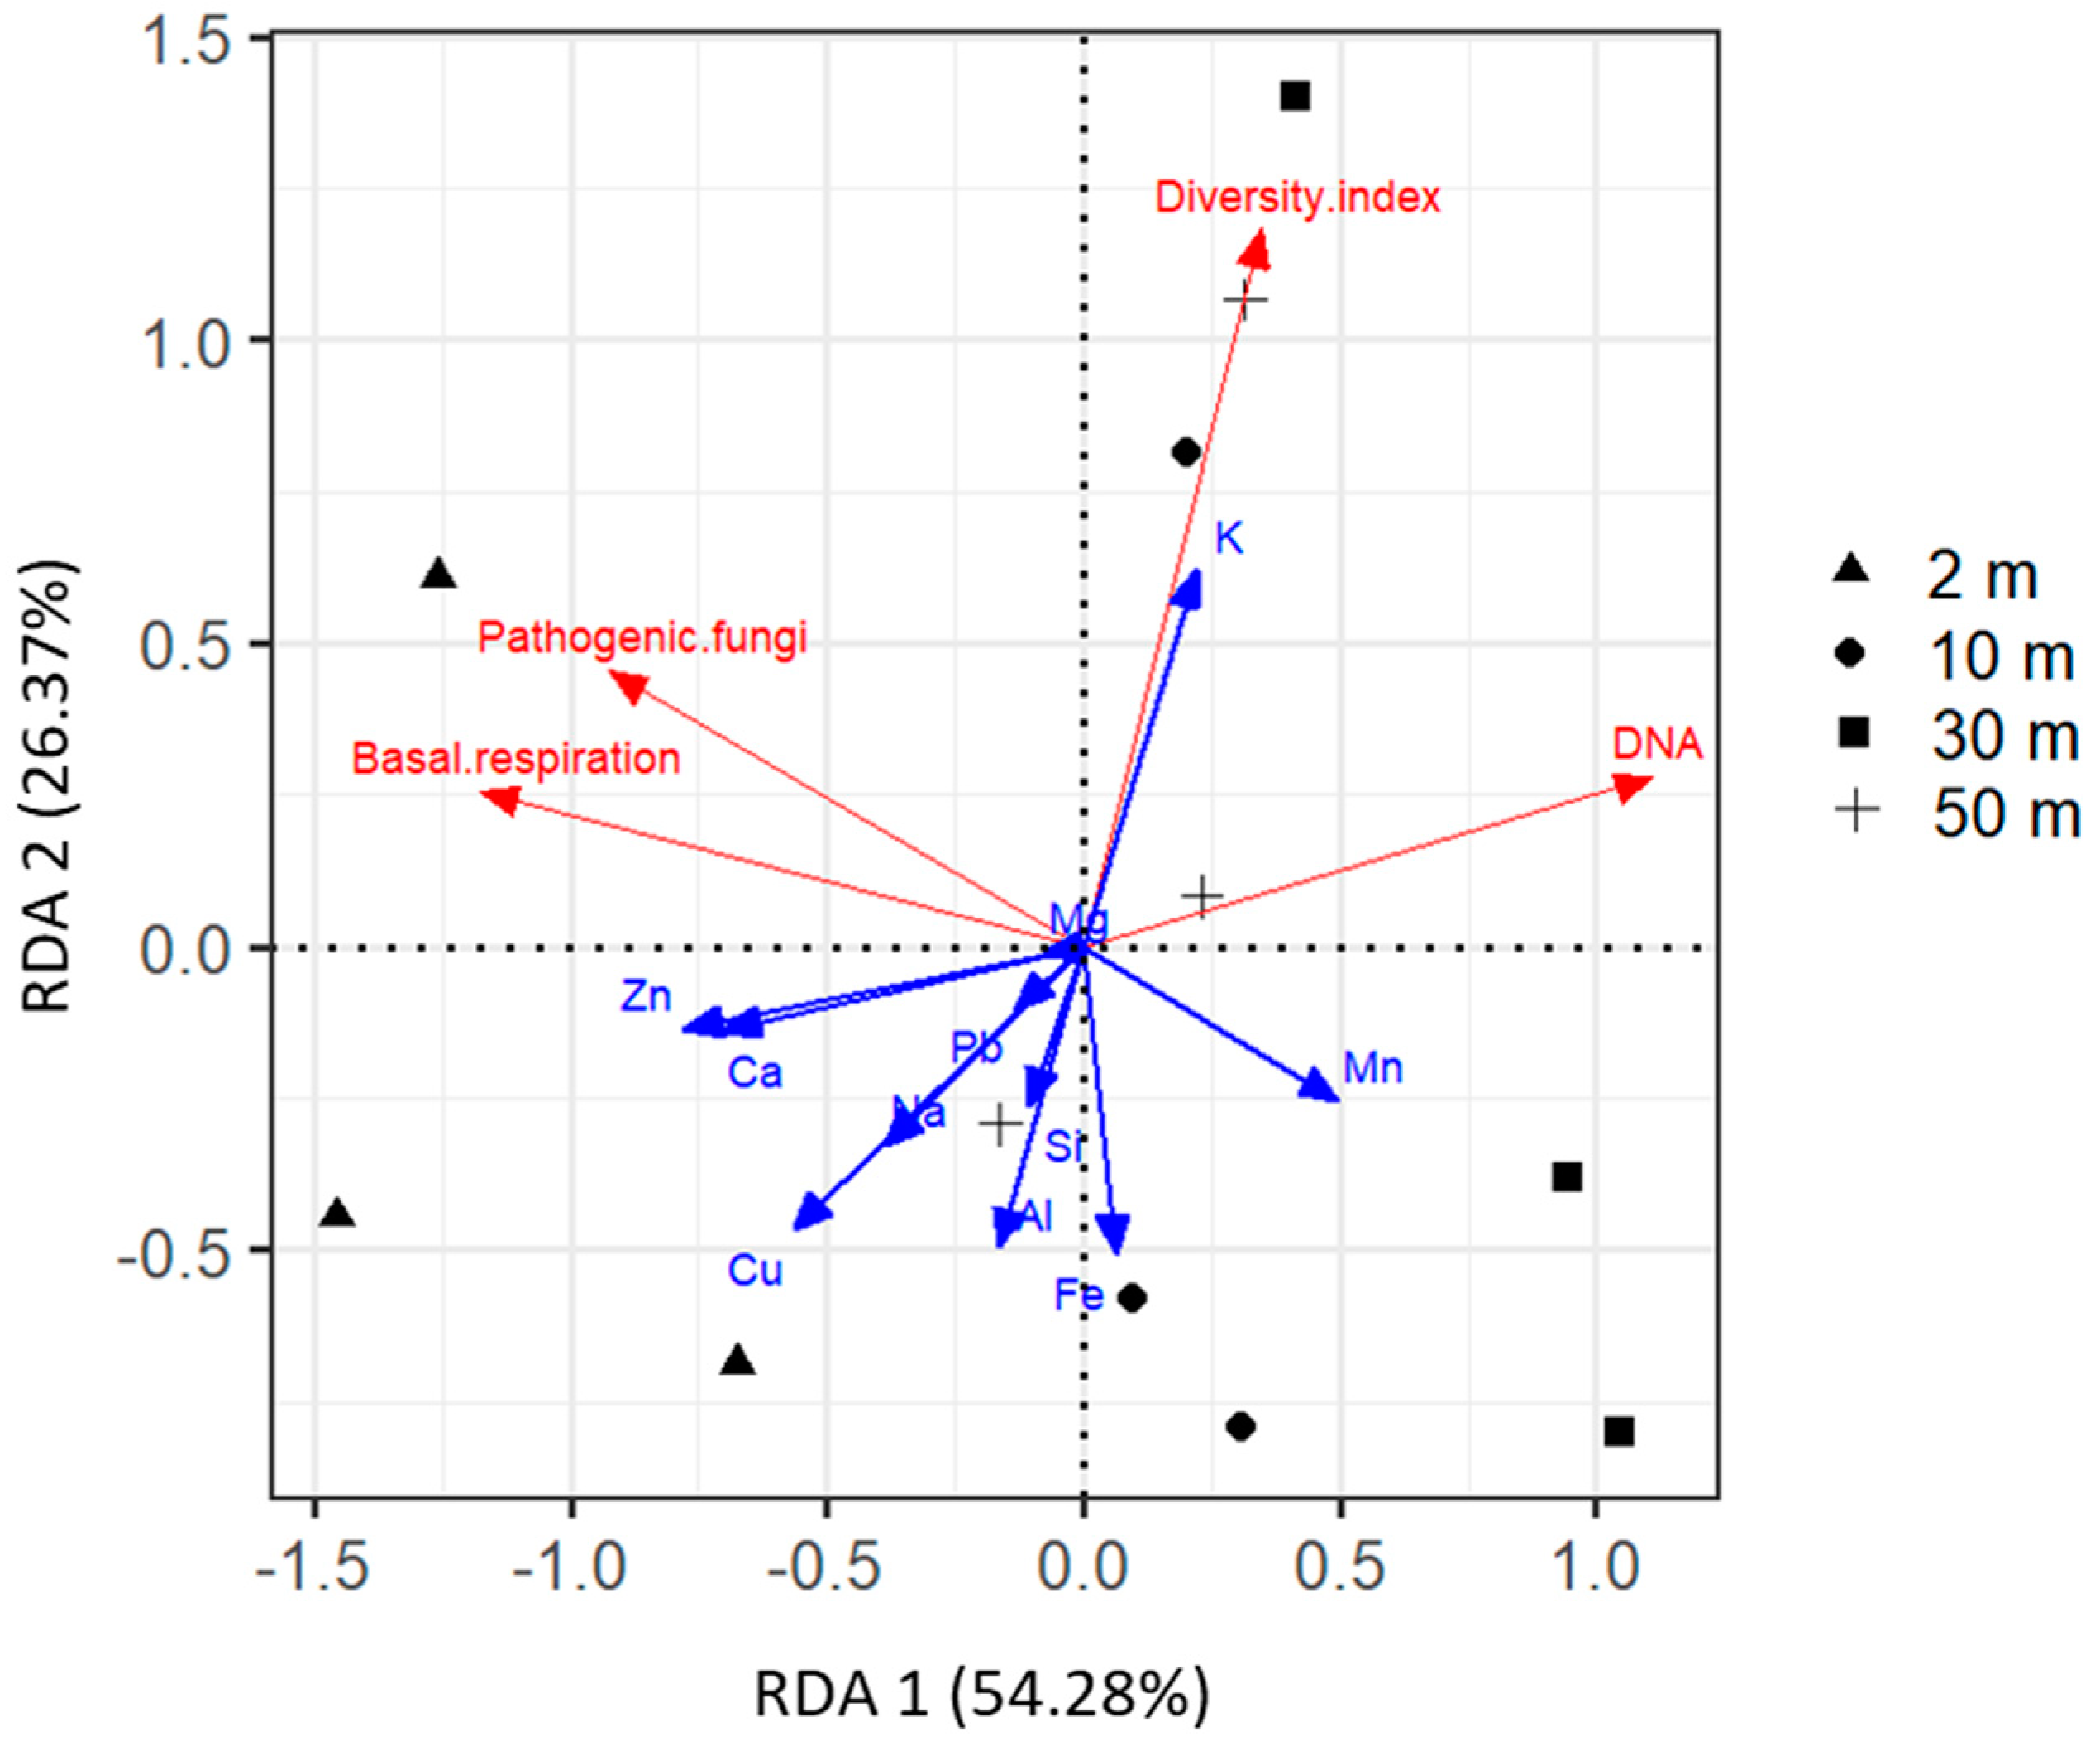
2.4. Driving Factors of Phylloplane Characteristics
3. Discussion
3.1. Environmental Conditions
3.2. Phylloplane: Sensitive Indicators to Distance from the Road
3.3. Phylloplane: Resistance to Traffic-Related Air Pollution
4. Materials and Methods
4.1. Study Site and Sampling
4.2. Chemical Analysis
4.3. DNA Extraction
4.4. PCR Amplification, Library Preparation, and Sequencing
4.5. Bioinformatics
4.6. Microbial Activity
4.7. Microorganism Cultivation
4.8. Statistics
Supplementary Materials
Author Contributions
Funding
Institutional Review Board Statement
Informed Consent Statement
Data Availability Statement
Conflicts of Interest
References
- Matasov, V.; Belelli Marchesini, L.; Yaroslavtsev, A.; Sala, G.; Fareeva, O.; Seregin, I.; Castaldi, S.; Vasenev, V.; Valentini, R. IoT Monitoring of Urban Tree Ecosystem Services: Possibilities and Challenges. Forests 2020, 11, 775. [Google Scholar] [CrossRef]
- Bush, J.; Ashley, G.; Foster, B.; Hall, G. Integrating Green Infrastructure into Urban Planning: Developing Melbourne’s Green Factor Tool. Urban Plan. 2021, 6, 20–31. [Google Scholar] [CrossRef]
- Remus-Emsermann, M.N.P.; Schlechter, R.O. Phyllosphere microbiology: At the interface between microbial individuals and the plant host. New Phytol. 2018, 218, 1327–1333. [Google Scholar] [CrossRef] [PubMed]
- Laforest-Lapointe, I.; Paquette, A.; Messier, C.; Kembel, S.W. Leaf bacterial diversity mediates plant diversity and ecosystem function relationships. Nature 2017, 546, 145–147. [Google Scholar] [CrossRef] [PubMed]
- Into, P.; Pontes, A.; Sampaio, J.P.; Limtong, S. Yeast Diversity Associated with the Phylloplane of Corn Plants Cultivated in Thailand. Microorganisms 2020, 8, 80. [Google Scholar] [CrossRef] [Green Version]
- Nayak, B.K.; Anandhu, R. Biodiversity of Phylloplane and Endophytic Fungi from Different Aged Leaves of Medicinal Mangrove Plant Species, Avicennia marina. J. Pharm. Sci. Res. 2017, 9, 6. [Google Scholar]
- Wuyts, K.; Smets, W.; Lebeer, S.; Samson, R. Green infrastructure and atmospheric pollution shape diversity and composition of phyllosphere bacterial communities in an urban landscape. FEMS Microbiol. Ecol. 2019, 96, fiz173. [Google Scholar] [CrossRef]
- Ouyang, W.; Morakinyo, T.E.; Ren, C.; Liu, S.; Ng, E. Thermal-irradiant performance of green infrastructure typologies: Field measurement study in a subtropical climate city. Sci. Total Environ. 2021, 764, 144635. [Google Scholar] [CrossRef]
- Baycan-Levent, T.; Nijkamp, P. Planning and Management of Urban Green Spaces in Europe: Comparative Analysis. J. Urban Plan. Dev. 2009, 135, 1–12. [Google Scholar] [CrossRef]
- Nikolaeva, O.; Tikhonov, V.; Vecherskii, M.; Kostina, N.; Fedoseeva, E.; Astaikina, A. Ecotoxicological effects of traffic-related pollutants in roadside soils of Moscow. Ecotoxicol. Environ. Saf. 2019, 172, 538–546. [Google Scholar] [CrossRef]
- Gómez-Baggethun, E.; Barton, D.N. Classifying and valuing ecosystem services for urban planning. Ecol. Econ. 2013, 86, 235–245. [Google Scholar] [CrossRef]
- Baldacchini, C.; Castanheiro, A.; Maghakyan, N.; Sgrigna, G.; Verhelst, J.; Alonso, R.; Amorim, J.H.; Bellan, P.; Bojović, D.Đ.; Breuste, J.; et al. How Does the Amount and Composition of PM Deposited on Platanus acerifolia Leaves Change Across Different Cities in Europe? Environ. Sci. Technol. 2017, 51, 1147–1156. [Google Scholar] [CrossRef] [PubMed]
- Smets, W.; Wuyts, K.; Oerlemans, E.; Wuyts, S.; Denys, S.; Samson, R.; Lebeer, S. Impact of urban land use on the bacterial phyllosphere of ivy (Hedera sp.). Atmos. Environ. 2016, 147, 376–383. [Google Scholar] [CrossRef]
- Kjellstrom, T.; Friel, S.; Dixon, J.; Corvalan, C.; Rehfuess, E.; Campbell-Lendrum, D.; Gore, F.; Bartram, J. Urban Environmental Health Hazards and Health Equity. J. Urban Health 2007, 84, 86–97. [Google Scholar] [CrossRef] [Green Version]
- Slukovskaya, M.V.; Vasenev, V.I.; Ivashchenko, K.V.; Morev, D.V.; Drogobuzhskaya, S.V.; Ivanova, L.A.; Kremenetskaya, I.P. Technosols on mining wastes in the subarctic: Efficiency of remediation under Cu-Ni atmospheric pollution. Int. Soil Water Conserv. Res. 2019, 7, 297–307. [Google Scholar] [CrossRef]
- Siebielec, S.; Siebielec, G.; Sugier, P.; Woźniak, M.; Grządziel, J.; Gałązka, A.; Stuczyński, T. Activity and Diversity of Microorganisms in Root Zone of Plant Species Spontaneously Inhabiting Smelter Waste Piles. Molecules 2020, 25, 5638. [Google Scholar] [CrossRef]
- Watmough, S.A.; Rabinowitz, T.; Baker, S. The impact of pollutants from a major northern highway on an adjacent hardwood forest. Sci. Total Environ. 2017, 579, 409–419. [Google Scholar] [CrossRef]
- Szwalec, A.; Mundała, P.; Kędzior, R.; Pawlik, J. Monitoring and assessment of cadmium, lead, zinc and copper concentrations in arable roadside soils in terms of different traffic conditions. Environ. Monit. Assess. 2020, 192, 155. [Google Scholar] [CrossRef] [Green Version]
- Wuytack, T.; Wuyts, K.; Van Dongen, S.; Baeten, L.; Kardel, F.; Verheyen, K.; Samson, R. The effect of air pollution and other environmental stressors on leaf fluctuating asymmetry and specific leaf area of Salix alba L. Environ. Pollut. 2011, 159, 2405–2411. [Google Scholar] [CrossRef]
- Vitali, F.; Raio, A.; Sebastiani, F.; Cherubini, P.; Cavalieri, D.; Cocozza, C. Environmental pollution effects on plant microbiota: The case study of poplar bacterial-fungal response to silver nanoparticles. Appl. Microbiol. Biotechnol. 2019, 103, 8215–8227. [Google Scholar] [CrossRef]
- Booker, F.; Muntifering, R.; McGrath, M.; Burkey, K.; Decoteau, D.; Fiscus, E.; Manning, W.; Krupa, S.; Chappelka, A.; Grantz, D. The ozone component of global change: Potential effects on agricultural and horticultural plant yield, product quality and interactions with invasive species. J. Integr. Plant Biol. 2009, 51, 337–351. [Google Scholar] [CrossRef] [PubMed]
- Paoletti, E.; Grulke, N.E.; Matyssek, R. Ozone Amplifies Water Loss from Mature Trees in the Short Term But Decreases It in the Long Term. Forests 2020, 11, 46. [Google Scholar] [CrossRef] [Green Version]
- Xie, W.-Y.; Su, J.-Q.; Zhu, Y.-G. Arsenite Oxidation by the Phyllosphere Bacterial Community Associated with Wolffia australiana. Environ. Sci. Technol. 2014, 48, 9668–9674. [Google Scholar] [CrossRef] [PubMed]
- Sangthong, S.; Suksabye, P.; Thiravetyan, P. Air-borne xylene degradation by Bougainvillea buttiana and the role of epiphytic bacteria in the degradation. Ecotoxicol. Environ. Saf. 2016, 126, 273–280. [Google Scholar] [CrossRef]
- Mohamed, R.M.; Abo-Amer, A.E. Isolation and characterization of heavy-metal resistant microbes from roadside soil and phylloplane. J. Basic Microbiol. 2012, 52, 53–65. [Google Scholar] [CrossRef]
- Zhao, D.; Liu, G.; Wang, X.; Daraz, U.; Sun, Q. Abundance of human pathogen genes in the phyllosphere of four landscape plants. J. Environ. Manage. 2020, 255, 109933. [Google Scholar] [CrossRef]
- Korneykova, M.V.; Soshina, A.S.; Novikov, A.I.; Ivashchenko, K.V.; Sazonova, O.I.; Slukovskaya, M.V.; Shirokaya, A.A.; Vasenev, V.I.; Vetrova, A.A.; Gavrichkova, O. Microscopic Fungi in Big Cities: Biodiversity, Source, and Relation to Pollution by Potentially Toxic Metals. Atmosphere 2021, 12, 1471. [Google Scholar] [CrossRef]
- Blagodatskaya, E.; Kuzyakov, Y. Active microorganisms in soil: Critical review of estimation criteria and approaches. Soil Biol. Biochem. 2013, 67, 192–211. [Google Scholar] [CrossRef]
- Bérard, A.; Mazzia, C.; Sappin-Didier, V.; Capowiez, L.; Capowiez, Y. Use of the MicroRespTM method to assess Pollution-Induced Community Tolerance in the context of metal soil contamination. Ecol. Indic. 2014, 40, 27–33. [Google Scholar] [CrossRef]
- Thiele-Bruhn, S.; Schloter, M.; Wilke, B.-M.; Beaudette, L.A.; Martin-Laurent, F.; Cheviron, N.; Mougin, C.; Römbke, J. Identification of new microbial functional standards for soil quality assessment. SOIL 2020, 6, 17–34. [Google Scholar] [CrossRef] [Green Version]
- Malcolm, K.; Dighton, J.; Barkay, T. Mercury affects the phylloplane fungal community of blueberry leaves to a lesser extent than plant age. Mycology 2018, 9, 49–58. [Google Scholar] [CrossRef] [PubMed] [Green Version]
- Sánchez-López, A.S.; González-Chávez M del, C.A.; Solís-Domínguez, F.A.; Carrillo-González, R.; Rosas-Saito, G.H. Leaf Epiphytic Bacteria of Plants Colonizing Mine Residues: Possible Exploitation for Remediation of Air Pollutants. Front. Microbiol. 2018, 9, 28. [Google Scholar] [CrossRef] [PubMed]
- Łukowski, A.; Popek, R.; Karolewski, P. Particulate matter on foliage of Betula pendula, Quercus robur, and Tilia cordata: Deposition and ecophysiology. Environ. Sci. Pollut. Res. 2020, 27, 10296–10307. [Google Scholar] [CrossRef] [PubMed] [Green Version]
- Kulbachevksy, A.O. Report on the Environmental State in Moscow in 2016; NIA-Priroda: Moscow, Russia, 2017. (In Russian) [Google Scholar]
- Romzaykina, O.N.; Vasenev, V.I.; Paltseva, A.; Kuzyakov, Y.V.; Neaman, A.; Dovletyarova, E.A. Assessing and mapping urban soils as geochemical barriers for contamination by heavy metal(loid)s in Moscow megapolis. J. Environ. Qual. 2021, 50, 22–37. [Google Scholar] [CrossRef]
- Prokof’eva, T.; Shishkov, V.; Kiriushin, A. Calcium carbonate accumulations in Technosols of Moscow city. J. Soils Sediments 2021, 21, 2049–2058. [Google Scholar] [CrossRef]
- De Silva, S.; Ball, A.S.; Huynh, T.; Reichman, S.M. Metal accumulation in roadside soil in Melbourne, Australia: Effect of road age, traffic density and vehicular speed. Environ. Pollut. 2016, 208, 102–109. [Google Scholar] [CrossRef]
- Shi, G.; Chen, Z.; Xu, S.; Zhang, J.; Wang, L.; Bi, C.; Teng, J. Potentially toxic metal contamination of urban soils and roadside dust in Shanghai, China. Environ. Pollut. 2008, 156, 251–260. [Google Scholar] [CrossRef]
- Clarke, L.W.; Jenerette, G.D.; Bain, D.J. Urban legacies and soil management affect the concentration and speciation of trace metals in Los Angeles community garden soils. Environ. Pollut. 2015, 197, 1–12. [Google Scholar] [CrossRef]
- Werkenthin, M.; Kuge, B.; Wessolek, G. Metals in European roadside soil and soil solution—A review. Environ. Pollut. 2014, 189, 98–110. [Google Scholar] [CrossRef]
- Li, Y.; Hu, Y.; Li, X.; Xiao, D. A review on road ecology. Chin. J. Appl. Ecol. 2003, 14, 447–452. [Google Scholar]
- Massimi, L.; Ristorini, M.; Astolfi, M.L.; Perrino, C.; Canepari, S. High resolution spatial mapping of element concentrations in PM10: A powerful tool for localization of emission sources. Atmos. Res. 2020, 244, 105060. [Google Scholar] [CrossRef]
- Karner, A.A.; Eisinger, D.S.; Niemeier, D.A. Near-roadway air quality: Synthesizing the findings from real-world data. Environ. Sci. Technol. 2010, 44, 5334–5344. [Google Scholar] [CrossRef] [PubMed]
- Xing, Y.; Brimblecombe, P. Dispersion of traffic derived air pollutants into urban parks. Sci. Total Environ. 2018, 622, 576–583. [Google Scholar] [CrossRef] [PubMed]
- Adamiec, E.; Jarosz-Krzemińska, E.; Wieszała, R. Heavy metals from non-exhaust vehicle emissions in urban and motorway road dusts. Environ. Monit. Assess. 2016, 188, 369. [Google Scholar] [CrossRef] [Green Version]
- Vasenev, V.I.; Smagin, A.V.; Ananyeva, N.D.; Ivashchenko, K.V.; Gavrilenko, E.G.; Prokofeva, T.V.; Patlseva, A.; Stoorvogel, J.J.; Gosse, D.D.; Valentini, R. Urban soil’s functions: Monitoring, assessment, and management. In Adaptive Soil Management: From Theory to Practices; Rakshit, A., Chirakuzhyil, P., Harikesh, A., Singh, B., Eds.; Springer: Singapore, 2017; pp. 359–409. [Google Scholar]
- Smagin, A.V.; Azovtseva, N.A.; Smagina, M.V.; Stepanov, A.L.; Myagkova, A.D.; Kurbatova, A.S. Criteria and methods to assess the ecological status of soils in relation to the landscaping of urban territories. Eurasian Soil Sci. 2006, 39, 539–551. [Google Scholar] [CrossRef]
- Hamada, S.; Ohta, T. Seasonal variations in the cooling effect of urban green areas on surrounding urban areas. Urban For. Urban Green. 2010, 9, 15–24. [Google Scholar] [CrossRef]
- Yu, Z.; Xu, S.; Zhang, Y.; Jørgensen, G.; Vejre, H. Strong contributions of local background climate to the cooling effect of urban green vegetation. Sci. Rep. 2018, 8, 6798. [Google Scholar] [CrossRef] [PubMed]
- Diffey, B.L.; Diffey, J.L. Sun protection with trees. Br. J. Dermatol. 2002, 147, 397–398. [Google Scholar] [CrossRef]
- Chapman, S.J.; Campbell, C.D.; Artz, R.R.E. Assessing CLPPs using MicroResp™. J. Soils Sediments 2007, 7, 406–410. [Google Scholar] [CrossRef]
- Tlili, A.; Corcoll, N.; Bonet, B.; Morin, S.; Montuelle, B.; Bérard, A.; Guasch, H. In situ spatio-temporal changes in pollution-induced community tolerance to zinc in autotrophic and heterotrophic biofilm communities. Ecotoxicology 2011, 20, 1823–1839. [Google Scholar] [CrossRef]
- Campbell, C.D.; Chapman, S.J.; Cameron, C.M.; Davidson, M.S.; Potts, J.M. A rapid microtiter plate method to measure carbon dioxide evolved from carbon substrate amendments so as to determine the physiological profiles of soil microbial communities by using whole soil. Appl. Environ. Microbiol. 2003, 69, 3593–3599. [Google Scholar] [CrossRef] [PubMed] [Green Version]
- Batista, D.; Tlili, A.; Gessner, M.O.; Pascoal, C.; Cássio, F. Nanosilver impacts on aquatic microbial decomposers and litter decomposition assessed as pollution-induced community tolerance (PICT). Environ. Sci. Nano 2020, 7, 2130–2139. [Google Scholar] [CrossRef]
- Bunster, L.; Fokkema, N.J.; Schippers, B. Effect of Surface-Active Pseudomonas spp. on Leaf Wettability. Appl. Environ. Microbiol. 1989, 55, 1340–1345. [Google Scholar] [CrossRef] [Green Version]
- Lindow, S.E.; Brandl, M.T. Microbiology of the phyllosphere. Appl. Environ. Microbiol. 2003, 69, 1875–1883. [Google Scholar] [CrossRef] [PubMed] [Green Version]
- Womack, A.M.; Artaxo, P.E.; Ishida, F.Y.; Mueller, R.C.; Saleska, S.R.; Wiedemann, K.T.; Bohannan, B.J.; Green, J.L. Characterization of active and total fungal communities in the atmosphere over the Amazon rainforest. Biogeosciences 2015, 12, 6337–6349. [Google Scholar] [CrossRef] [Green Version]
- Samaké, A.; Bonin, A.; Jaffrezo, J.L.; Taberlet, P.; Weber, S.; Uzu, G.; Jacob, V.; Conil, S.; Martins, J.M. High levels of primary biogenic organic aerosols are driven by only a few plant-associated microbial taxa. Atmos. Chem. Phys. 2020, 20, 5609–5628. [Google Scholar] [CrossRef]
- De Silva, S.; Ball, A.S.; Shahsavari, E.; Indrapala, D.V.; Reichman, S.M. The effects of vehicular emissions on the activity and diversity of the roadside soil microbial community. Environ. Pollut. 2021, 277, 116744. [Google Scholar] [CrossRef]
- Semenov, M.; Blagodatskaya, E.; Stepanov, A.; Kuzyakov, Y. DNA-based determination of soil microbial biomass in alkaline and carbonaceous soils of semi-arid climate. J. Arid. Environ. 2018, 150, 54–61. [Google Scholar] [CrossRef]
- Joergensen, R.G.; Emmerling, C. Methods for evaluating human impact on soil microorganisms based on their activity, biomass, and diversity in agricultural soils. Z Pflanz. Bodenk 2006, 169, 295–309. [Google Scholar] [CrossRef]
- Soares, M.; Rousk, J. Microbial growth and carbon use efficiency in soil: Links to fungal-bacterial dominance, SOC-quality and stoichiometry. Soil Biol. Biochem. 2019, 131, 195–205. [Google Scholar] [CrossRef]
- Liao, M.; Xie, X.M. Effect of Heavy Metals on Substrate Utilization Pattern, Biomass, and Activity of Microbial Communities in a Reclaimed Mining Wasteland of Red Soil Area. Ecotoxicol. Environ. Saf. 2007, 66, 217–223. [Google Scholar] [CrossRef] [PubMed]
- Vasenev, V.I.; Ananeva, N.D.; Ivashchenko, K.V. The effect of pollutants (heavy metals and diesel fuel) on the respiratory activity of constructozems (artificial soils). Russ. J. Ecol. 2013, 44, 475–483. [Google Scholar] [CrossRef]
- Mu, H.; Chen, Y.; Xiao, N.D. Effects of metal oxide nanoparticles (TiO2, Al2O3SiO2 and ZnO) on waste activated sludge anaerobic digestion. Bioresour. Technol. 2011, 102, 10305–10311. [Google Scholar] [CrossRef] [PubMed]
- Kaurin, A.; Cernilogar, Z.; Lestan, D. Revitalisation of metalcontaminated, EDTA-washed soil by addition of unpolluted soil, compost and biochar: Effects on soil enzyme activity, microbial community composition and abundance. Chemosphere 2018, 193, 726–736. [Google Scholar] [CrossRef] [PubMed]
- Jiang, B.; Adebayo, A.; Jia, J.; Xing, Y.; Deng, S.; Guo, L.; Liang, Y.; Zhang, D. Impacts of heavy metals and soil properties at a Nigerian e-waste site on soil microbial community. J. Hazard. Mater. 2019, 362, 187–195. [Google Scholar] [CrossRef]
- Rajapaksha, R.M.C.P.; Tobor-Kapłon, M.A.; Bååth, E. Metal toxicity affects fungal and bacterial activities in soil differently. Appl. Environ. Microbiol. 2004, 70, 2966–2973. [Google Scholar] [CrossRef] [Green Version]
- Stefanowicz, A.M.; Niklińska, M.; Laskowski, R. Metals affect soil bacterial and fungal functional diversity differently. Environ. Toxicol. Chem. 2008, 27, 591–598. [Google Scholar] [CrossRef]
- Muniz, S.; Lacarta, J.; Pata, M.P.; Jimenez, J.J.; Navarro, E. Analysis of the diversity of substrate utilisation of soil bacteria exposed to Cd and earthworm activity using Generalised Additive Models. PLoS ONE 2014, 9, e85057. [Google Scholar] [CrossRef]
- Polukarova, M.; Markiewicz, A.; Björklund, K.; Strömvall, A.M.; Galfi, H.; Sköld, Y.A.; Gustafsson, M.; Järlskog, I.; Aronsson, M. Organic pollutants, nano-and microparticles in street sweeping road dust and washwater. Environ. Int. 2020, 135, 105337. [Google Scholar] [CrossRef]
- Hassan, S.K.; Mohammed, A.M.; Khoder, M.I. Characterization and health risk assessment of human exposure to PAHs in dust deposited on leaves of street trees in Egypt. Polycycl. Aromat. Compd. 2020, 40, 1013–1027. [Google Scholar] [CrossRef]
- Azevedo, M.M.; Cássio, F. Effects of metals on growth and sporulation of aquatic fungi. Drug Chem. Toxicol. 2010, 33, 269–278. [Google Scholar] [CrossRef] [PubMed]
- Goupil, K.; Nkongolo, K.K.; Nasserulla, S. Characterization of fungal communities in limed and unlimed lands contaminated with metals: Phospholipid fatty acid (PLFA) analysis and soil respiration. Am. J. Biochem. Biotechnol. 2015, 11, 45–56. [Google Scholar] [CrossRef]
- Meli, K.; Kamika, I.; Keshri, J.; Momba, M.N.B. The impact of zinc oxide nanoparticles on the bacterial microbiome of activated sludge systems. Sci. Rep. 2016, 6, 39176. [Google Scholar] [CrossRef] [PubMed] [Green Version]
- Fanourakis, D.; Aliniaeifard, S.; Sellin, A.; Giday, H.; Körner, O.; Nejad, A.R.; Delis, C.; Bouranis, D.; Koubouris, G.; Kambourakis, E.; et al. Stomatal behavior following mid- or long-term exposure to high relative air humidity: A review. Plant Physiol. Biochem. 2020, 153, 92–105. [Google Scholar] [CrossRef]
- Mumivand, H.; Shayganfar, A.; Tsaniklidis, G.; Emami Bistgani, Z.; Fanourakis, D.; Nicola, S. Pheno-Morphological and Essential Oil Composition Responses to UVA Radiation and Protectants: A Case Study in Three Thymus Species. Horticulturae 2022, 8, 31. [Google Scholar] [CrossRef]
- Hinsinger, P.; Plassard, C.; Tang, C.; Jaillard, B. Origins of root-mediated pH changes in the rhizosphere and their responses to environmental constraints: A review. Plant Soil 2003, 248, 43–59. [Google Scholar] [CrossRef]
- Fierer, N. Embracing the unknown: Disentangling the complexities of the soil microbiome. Nat. Rev. Microbiol. 2017, 15, 579–590. [Google Scholar] [CrossRef]
- Gilbert, K.J.; Renner, T. Acid or base? How do plants regulate the ecology of their phylloplane? AoB PLANTS 2021, 13, plab032. [Google Scholar] [CrossRef]
- Bruins, M.R.; Kapil, S.; Oehme, F.W. Microbial resistance to metals in the environment. Ecotoxicol. Environ. Saf. 2000, 45, 198–207. [Google Scholar] [CrossRef] [PubMed]
- Podol’skaia, V.I.; Gruzina, T.G.; Ul’berg, Z.P.; Sokolovskaia, A.S.; Grishchenko, N.I. Effect of arsenic on bacterial growth and plasma membrane ATPase activity. Appl. Biochem. Microbiol. 2002, 38, 48–52. [Google Scholar] [CrossRef]
- Vélez, N.; Monteoliva, L.; Sánchez-Quitian, Z.-A.; Amador-García, A.; García-Rodas, R.; Ceballos-Garzón, A.; Gil, C.; Escandón, P.; Zaragoza, Ó.; Parra-Giraldo, C.-M. The Combination of Iron and Copper Increases Pathogenicity and Induces Proteins Related to the Main Virulence Factors in Clinical Isolates of Cryptococcus neoformans var. grubii. J. Fungi 2022, 8, 57. [Google Scholar] [CrossRef] [PubMed]
- Svistova, I.D.; Talalaiko, N.N.; Devyatova, T.A.; Shcherbakov, A.P. Microbiological monitoring of urban soils in Voronezh. In Modern Problems of Soil Pollution, Proceedings of the International Conference; MGU: Moscow, Russia, 2004; pp. 276–278. (In Russian) [Google Scholar]
- Marfenina, O.E.; Kulko, A.B.; Ivanova, A.E.; Sogonov, M.V. The microfungal communities in the urban outdoor environment. Mikol. Fitopatol. 2002, 36, 22–32. (In Russian) [Google Scholar]
- Talalaiko, N.N. Microbiological Indication of Urban Soils in the Voronezh City. Ph.D. Thesis, Voronezh State Pedagogical University, Voronezh, Russia, 2005. (In Russian). [Google Scholar]
- Ivanova, A.M.; Kircideli, I.Y. Microfungi from air at St.-Petersburg. Nov. Sist. Nizshikh Rasteniy 2005, 39, 136–141. (In Russian) [Google Scholar]
- Gostinčar, C.; Zajc, J.; Lenassi, M.; Plemenitaš, A.; De Hoog, S.; Al-Hatmi, A.M.; Gunde-Cimerman, N. Fungi between extremotolerance and opportunistic pathogenicity on humans. Fungal Divers. 2018, 93, 195–213. [Google Scholar] [CrossRef] [Green Version]
- Wang, M.; Danesi, P.; James, T.Y.; Al Hatmi, A.M.; Najafzadeh, M.J.; Dolatabadi, S.; Ming, C.; Liou, G.Y.; Kang, Y.; de Hoog, S. Comparative pathogenicity of opportunistic black yeasts in Aureobasidium. Mycoses 2019, 62, 803–811. [Google Scholar] [CrossRef] [PubMed]
- Argenbright, R. New Moscow: An Exploratory Assessment. Eurasian Geogr. Econ. 2011, 52, 857–875. [Google Scholar] [CrossRef]
- Lepneva, O.M.; Obukhov, A.I. The lead content in the soil-plant system in the zones of influence of highways. In Lead in the Environment; Dobrovolskiy, V.V., Ed.; The Science: Moscow, Russia, 1987; pp. 149–165. (In Russian) [Google Scholar]
- Gladkov, E.A. The integrated effect of heavy metals on plants in megacities. Ecology 2007, 1, 71–74. (In Russian) [Google Scholar]
- Kasimov, N.S.; Vlasov, D.V.; Kosheleva, N.E.; Nikiforova, E.M. Geochemistry of Landscapes in the Eastern Moscow; APR: Moscow, Russia, 2016. (In Russian) [Google Scholar]
- Kosheleva, N.E.; Vlasov, D.V.; Korlyakov, I.D.; Kasimov, N.S. Contamination of urban soils with heavy metals in Moscow as affected by building development. Sci. Total Environ. 2018, 636, 854–863. [Google Scholar] [CrossRef]
- Mattheck, C.; Breloer, H. Field guide for visual tree assessment (Vta). Arboric. J. 1994, 18, 1–23. [Google Scholar] [CrossRef]
- Herlemann, D.P.; Labrenz, M.; Jürgens, K.; Bertilsson, S.; Waniek, J.J.; Andersson, A.F. Transitions in bacterial communities along the 2000 km salinity gradient of the Baltic Sea. ISME J. 2011, 5, 1571–1579. [Google Scholar] [CrossRef] [Green Version]
- White, T.J.; Bruns, T.; Lee, S.; Taylor, J.W. 1990 Amplification and direct sequencing of fungal ribosomal RNA genes for phylogenetics. In PCR Protocols: A Guide to Methods and Applications; Innis, M.A., Gelfand, D.H., Sninsky, J.J., White, T.J., Eds.; Academic Press, Inc.: New York, NY, USA, 1990; pp. 315–322. [Google Scholar]
- Lozupone, C.; Lladser, M.E.; Knights, D.; Stombaugh, J.; Knight, R. UniFrac: An effective distance metric for microbial community comparison. ISME J. 2011, 5, 169–172. [Google Scholar] [CrossRef] [Green Version]
- Raja, H.A.; Miller, A.N.; Pearce, C.J.; Oberlies, N.H. Fungal Identification Using Molecular Tools: A Primer for the Natural Products Research Community. J. Nat. Prod. 2017, 80, 756–770. [Google Scholar] [CrossRef] [PubMed]
- Zvyagintsev, D.G. Methods of Soil Microbiology and Biochemistry; MSU: Moscow, Russia, 1991. (In Russian) [Google Scholar]
- Klich, M.A. Identification of Common Aspergillus Species; CBS: New York, NY, USA, 2002. [Google Scholar]
- Domsch, K.H. Compendium of Soil Fungi Revised by W. Gams; John Wiley & Sons, Inc.: Hoboken, NJ, USA, 2007. [Google Scholar]
- Seifert, K.A.; Gams, W. The genera of Hyphomycetes—2011 update. Pers.-Mol. Phylogeny Evol. Fungi 2011, 27, 119–129. [Google Scholar] [CrossRef] [PubMed] [Green Version]
- Richardson, M.D. Opportunistic and pathogenic fungi. J. Antimicrob. Chemother. 1991, 28, 1–11. [Google Scholar] [CrossRef] [PubMed]
- de Hoog, G.S.; Guarro, J.; Gené, J.; Figueras, M.J. Atlas of Clinical Fungi, 3rd ed.; Reus: Utrecht, The Netherlands, 2019. [Google Scholar]


| ELM | Distance to the Road, m | p-Value | |||
|---|---|---|---|---|---|
| 2 | 10 | 30 | 50 | ||
| K | 12.1 ± 3.6 a | 13.9 ± 2.6 a | 30.8 ± 16.8 a | 27.8 ± 7.4 a | 0.43 |
| Ca | 31.9 ± 1.3 a | 21.4 ± 2.4 a | 21.5 ± 4.0 a | 23.1 ± 4.9 a | 0.18 |
| Mn | 0.5 ± 0.1 a | 1.1 ± 0.5 a | 2.0 ± 0.5 a | 3.2 ± 1.7 a | 0.25 |
| Mg | 4.4 ± 0.53 a | 4.4 ± 0.5 a | 4.2 ± 0.9 a | 5.9 ± 1.1 a | 0.49 |
| Na | 3.4 ± 0.7 a | 3.0 ± 0.3 a | 2.1 ± 0.5 a | 2.8 ± 0.3 a | 0.35 |
| Si | 42.4 ± 10.0 a | 39.5 ± 10.4 a | 30.4 ± 14.5 a | 44.6 ± 4.4 a | 0.79 |
| Cu | 0.2 ± 0.01 a | 0.2 ± 0.09 a | 0.06 ± 0.009 a | 77 ± 14 a | 0.22 |
| Zn | 0.4 ± 0.01 a | 0.4 ± 0.04 ab | 0.3 ± 0.02 b | 0.3 ± 0.02 b | <0.01 |
| Al | 11.2 ± 2.6 a | 10.3 ± 2.4 a | 7.5 ± 3.1 a | 11.2 ± 1.1 a | 0.68 |
| Pb | 0.01 ± 0.01 a | 0.008 ± 0.003 a | 0.008 ± 0.004 a | 0.008 ± 0.004 a | 0.86 |
| Fe | 9.0 ± 2.3 a | 9.7 ± 2.4 a | 6.8 ± 3.1 a | 8.9 ± 1.62 a | 0.85 |
| Fungi Species | Distance from the Road, m | |||
|---|---|---|---|---|
| 2 | 10 | 30 | 50 | |
| Aspergillus flavus Link | 5.41 | 14.58 | ND | ND |
| A. fumigatus Fresen. | 2.70 | 4.17 | ND | ND |
| A. ochraceus G. Wilh. | 2.70 | ND | ND | ND |
| Ciliciopodium hyalinum Dasz. | 45.95 | ND | 58.33 | ND |
| Paecilomyces variotii Bainier | 2.70 | ND | ND | ND |
| Parasarocladium breve (Sukapure & Thirum.) Summerb., J.A. Scott, Guarro, & Crous | ND | ND | 8.33 | ND |
| Penicillium citrinum Thom | ND | ND | 8.33 | ND |
| P. corylophilum Dierckx | 27.03 | 72.92 | ND | ND |
| P. glabrum (Wehmer) Westling | 2.70 | ND | 8.33 | ND |
| P. restrictum J.C. Gilman & E.V. Abbott | ND | 4.17 | ND | ND |
| Sterilia mycelia white | ND | ND | 8.33 | ND |
| Talaromyces helicus (Raper & Fennell) C.R. Benj. | 10.81 | ND | - | 25.00 |
| T. ruber (Stoll) N. Yilmaz, Houbraken, Frisvad, & Samson | ND | ND | 8.33 | ND |
| Trichoderma aureoviride Rifai | ND | 2.08 | ND | 62.50 |
| T. viride Pers. | ND | 2.08 | ND | 12.50 |
Publisher’s Note: MDPI stays neutral with regard to jurisdictional claims in published maps and institutional affiliations. |
© 2022 by the authors. Licensee MDPI, Basel, Switzerland. This article is an open access article distributed under the terms and conditions of the Creative Commons Attribution (CC BY) license (https://creativecommons.org/licenses/by/4.0/).
Share and Cite
Ivashchenko, K.V.; Korneykova, M.V.; Sazonova, O.I.; Vetrova, A.A.; Ermakova, A.O.; Konstantinov, P.I.; Sotnikova, Y.L.; Soshina, A.S.; Vasileva, M.N.; Vasenev, V.I.; et al. Phylloplane Biodiversity and Activity in the City at Different Distances from the Traffic Pollution Source. Plants 2022, 11, 402. https://doi.org/10.3390/plants11030402
Ivashchenko KV, Korneykova MV, Sazonova OI, Vetrova AA, Ermakova AO, Konstantinov PI, Sotnikova YL, Soshina AS, Vasileva MN, Vasenev VI, et al. Phylloplane Biodiversity and Activity in the City at Different Distances from the Traffic Pollution Source. Plants. 2022; 11(3):402. https://doi.org/10.3390/plants11030402
Chicago/Turabian StyleIvashchenko, Kristina V., Maria V. Korneykova, Olesya I. Sazonova, Anna A. Vetrova, Anastasia O. Ermakova, Pavel I. Konstantinov, Yulia L. Sotnikova, Anastasia S. Soshina, Maria N. Vasileva, Viacheslav I. Vasenev, and et al. 2022. "Phylloplane Biodiversity and Activity in the City at Different Distances from the Traffic Pollution Source" Plants 11, no. 3: 402. https://doi.org/10.3390/plants11030402