Article

Environmental Filtering Drives Fungal Phyllosphere Community in Regional Agricultural Landscapes

1
Leibniz Centre for Agricultural Landscape Research (ZALF), 15374 Müncheberg, Germany
2
Phytomedicine, Albrecht Daniel Thaer Institute, Faculty of Life Science, Humboldt-Universität zu Berlin, 10099 Berlin, Germany
3
State Office for Rural Development, Agriculture and Land Reorganization (LELF) Brandenburg, Division P, 15236 Frankfurt (Oder), Germany
*
Author to whom correspondence should be addressed.
Plants 2023, 12(3), 507; https://doi.org/10.3390/plants12030507
Submission received: 14 October 2022 / Revised: 13 January 2023 / Accepted: 18 January 2023 / Published: 22 January 2023
(This article belongs to the Special Issue Phytomicrobiome Research for Disease and Pathogen Management)

Abstract

:
To adapt to climate change, several agricultural strategies are currently being explored, including a shift in land use areas. Regional differences in microbiome composition and associated phytopathogens need to be considered. However, most empirical studies on differences in the crop microbiome focused on soil communities, with insufficient attention to the phyllosphere. In this study, we focused on wheat ears in three regions in northeastern Germany (Magdeburger Börde (MBB), Müncheberger Sander (MSA), Uckermärkisches Hügelland (UKH)) with different yield potentials, soil, and climatic conditions. To gain insight into the fungal community at different sites, we used a metabarcoding approach (ITS-NGS). Further, we examined the diversity and abundance of Fusarium and Alternaria using culture-dependent and culture-independent techniques. For each region, the prevalence of different orders rich in phytopathogenic fungi was determined: Sporidiobolales in MBB, Capnodiales and Pleosporales in MSA, and Hypocreales in UKH were identified as taxonomic biomarkers. Additionally, F. graminearum was found predominantly in UKH, whereas F. poae was more abundant in the other two regions. Environmental filters seem to be strong drivers of these differences, but we also discuss the possible effects of dispersal and interaction filters. Our results can guide shifting cultivation regions to be selected in the future concerning their phytopathogenic infection potential.

1. Introduction

Various agriculture strategies are currently being reviewed as part of the increased adaptation to climate change. In addition to agricultural diversification [1,2,3,4] and new ways to improve the water retention capacity of soils [5,6,7], the spatial (northern) shift of arable crop acreage is also discussed [8,9,10]. Even though shifting agricultural zones northward seems to be an attractive solution, there are some concerns and risks associated with this approach. At the agroecological scale, the location, landscape structure, climatic memory, and soil composition must be considered and can act as an environmental filter. This influence may have a strong negative impact on arable crops by the locally established relevant plant diseases and pathogenic microorganism communities in the rhizo- and phyllosphere of the plants. It can be assumed that certain areas are predestined for higher pathogen infestations, even in generally considered high-yield regions. Therefore, a holistic view of the ecological status of the region and the variability within a region on a smaller scale is essential.
Wheat, Triticum aestivum L., the most cultivated cereal in Europe, is particularly interesting due to its economic importance [11,12]. Fusarium head blight (FHB) in wheat, caused by a large group of Fusarium species, is already causing enormous economic damage and is under strict control, mainly due to the associated production of mycotoxins. Due to climate change, wheat susceptibility to FHB is expected to increase in predestined regions [13,14]. Another mycotoxin-producing phytopathogen is Alternaria, which also infests wheat and has an increased incidence in weakened plants [15,16,17]. Thus, to provide adequate crop protection and further select alternative cultivation sites, it is essential to study the influence of regional characteristics on the composition of the fungal community and its major pathogenic fungi.
Within-field distribution differences between Fusarium and Alternaria could already be detected [18]. These were mainly based on microclimate and showed that Fusarium was more abundant at humid and less warm sample sites. In contrast, Alternaria was more abundant at sparse sites and thus warmer and drier spots in the heterogeneous field [18]. Romero et al. [19] provide a clear summary of the influence of humidity and high temperature on fungal disease outbreaks and confirm that these two factors positively affect the occurrence and pathogen load of Fusarium.
Kivlin et al. [20] further showed that the assembly of the soil fungal community capable of aerial dispersal is mainly shaped by environmental filtering at the regional scale rather than by the range of its dispersal. Similarly, a study from Canada demonstrated that the population dynamics of F. graminearum are primarily directed by complex adaptive landscapes with varying regional selection pressures [21]. Nevertheless, no specific determinant could be identified. Instead, it appeared to be a result of the combination of climatic differences, site-specific undefined characteristics, and host prevalence at the various sites. In Europe, Pasquali et al. [22] contributed greatly to the coverage of F. graminearum and F. culmorum trichothecene genotypes. A database created through this work enables visualization apparent differences in the spatial distribution of the chemotypes of the respective Fusarium species.
However, sufficient studies on Fusarium species distribution in different regions and a list of site-specific characteristics shaping the Fusarium community are rare. For maize, a study by Goertz et al. [23], which investigated different Fusarium species throughout Germany and their mycotoxin formation, already recognizes regional differences. Precipitation and temperature differences were indicated as the main causes for the occurrence of different Fusarium species and mycotoxin profiles consisting of fumonisin, deoxynivalenol (DON), and zearalenone. Regional conditions such as soil and long-term mean precipitation were not further discussed. The impact of long-term mean precipitation values, in particular, could have a much stronger influence on the occurrence of Fusarium and an increase in the mycotoxin levels of DON than the amount of precipitation in the year of harvest [24]. Hence, it is hypothesized that the landscape forms a memory that affects the composition of microorganisms over a more extended period [24].
There are still insufficient studies on regional differences in the composition of the phyllosphere fungal community in Germany. Often only one species, such as F. graminearum or F. culmorum, was observed. Nevertheless, with the strong emergence of new molecular biological methods for community characterization, better insight into these complex structures is possible. Moreover, most metacommunity and metabarcoding studies in agriculture are related to soil [25,26]. Studies on the formation and composition of fungal communities in the phyllosphere of wheat are often lacking. Moreover, the few studies on mycotic phyllosphere composition usually focus on species composition and lose sight of the regional context [26,27,28]. Besides temperature and precipitation, no other parameters of the region are often considered.
This raises the question, on the one hand, to what extent the fungal community and, in particular, the Fusarium population in the phyllosphere of wheat differ in various regions. Do region-specific characteristics always result in the same dominant species, families, or fungal orders? On the other hand, can differences be detected only on a large scale between regions or on a small scale between fields in the same region? Further, to what can these differences be attributed? Answers to these questions are still lacking and are investigated in the present study.
For this purpose, we investigated plants of three regions (with 2–5 fields each) in North-East Germany with different wheat yield potentials, soil composition, and climatic conditions. We chose wheat after maize as the cropping system to favor the associated phytopathogenic fungal contamination with Fusarium and Alternaria. We hypothesized that all three regions would show different fungal community structures and dominant families. In addition, we expected that small-scale differences between fields in the same region, compared to regional differences, would be minor. We discuss typical regional characteristics as possible environmental filters, such as soil landscapes, soil values, yield potentials, long-term mean values of precipitation and temperature, and annual climate data. To characterize fungal infestations, wheat ears from conventionally managed fields were sampled and analyzed for Fusarium and Alternaria species composition and abundance, as well as the fungal community using a next-generation sequencing (NGS) approach targeting the nuclear ribosomal internal transcribed spacer (ITS) region as a universal DNA barcode marker for fungi. The purpose was to determine if relationships between the presence of Fusarium, Alternaria, and fungal communities and site characteristics can be observed.

2. Results

The results shown refer to ten study sites divided among the three regions Magdeburger Börde (MBB), Müncheberger Sander (MSA), and Uckermärkisches Hügelland (UKH). The regions differ in their yield potential and environmental parameters, such as soil type, temperature, and precipitation (Table 1).

2.1. Height of Wheat Plants

The measured height of the plants can be related to biomass production. However, the results also depend on the variety and the use of growth regulators and, therefore, should be considered primarily in connection with other parameters. Comparing the mean values per field, field UKH5 had the highest values with a mean of 94 cm. In contrast, the two fields in the Müncheberger Sander region, MSA1 and MSA2, had the lowest heights, with means of 73 cm and 74 cm, respectively (Figure 1). All three regions are significantly different from each other. Thus, the observations on plant height confirm the ad hoc selection of the regions for their different yield potential.

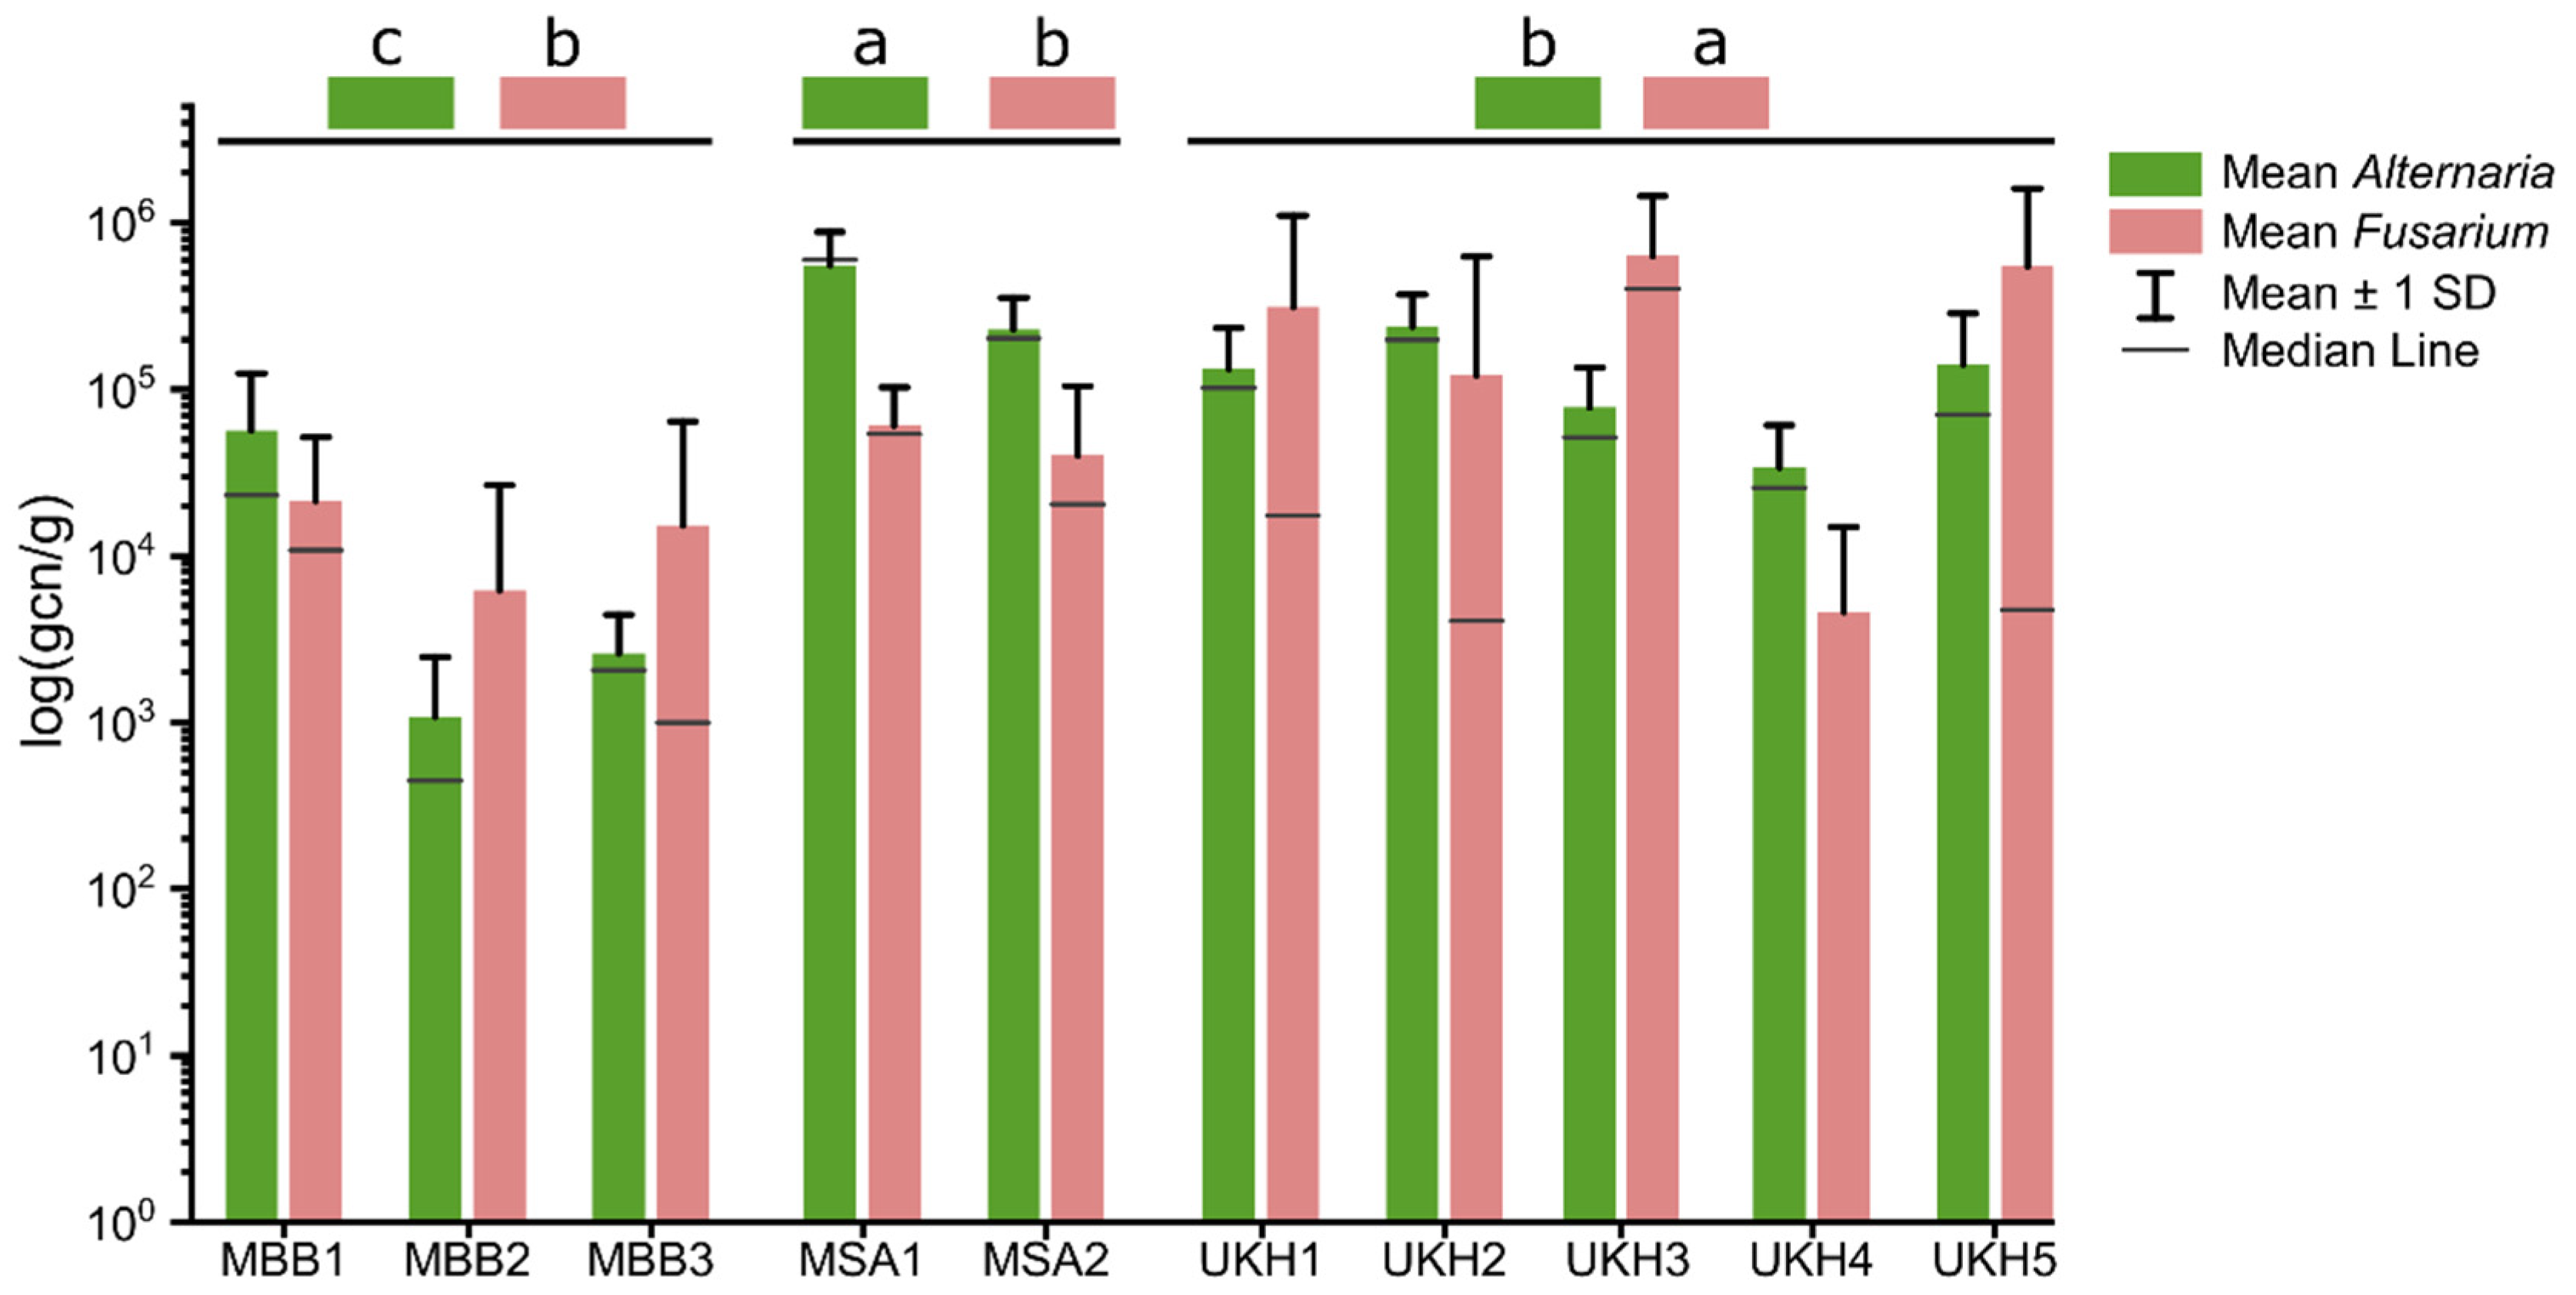
2.2. Quantitative Abundances of Fusaria and Alternaria

Quantitative analyses of wheat ears by qPCR confirmed Fusarium and Alternaria infestation in all fields. Nevertheless, Fusarium could not be found at all points. In UKH4 and MBB2, Fusarium could only be detected at 9 and 11 of 27 sampling points, respectively. Most Uckermark fields showed a Fusarium frequency above 5 × 10⁴ gene copy number per gram dry mass (gcn/g) (Figure 2). Only UKH4 deviated from this with 4.6 × 10³ gcn/g. The fields most affected by Fusarium were UKH1 (3.1 × 10⁵ gcn/g), UKH3 (6.3 × 10⁵ gcn/g), and UKH5 (5.5 × 10⁵ gcn/g). The fields from the Müncheberger Sander region had Fusarium frequencies of 5 × 10⁴ gcn/g. The fields from the Magdeburger Börde region were among those with the lowest Fusarium and Alternaria counts, such as the abundances we observed that was based on culture-dependent Fusarium isolation. Moreover, the MBB region is characterized by high soil quality and relatively lower long-term precipitation (Table 1). The field UKH4 (3.4 × 10⁴ gcn/g) also belonged to the fields with a comparatively low Alternaria abundance (Figure 2). Alternaria abundances in all regions differed significantly from each other. Fusaria abundance differed significantly between the MBB and UKH (α = 0.01) and MSA and UKH (α = 0.05) regions. In contrast, there were no significant differences in Fusarium abundances between the MBB and MSA regions (Figure 2).

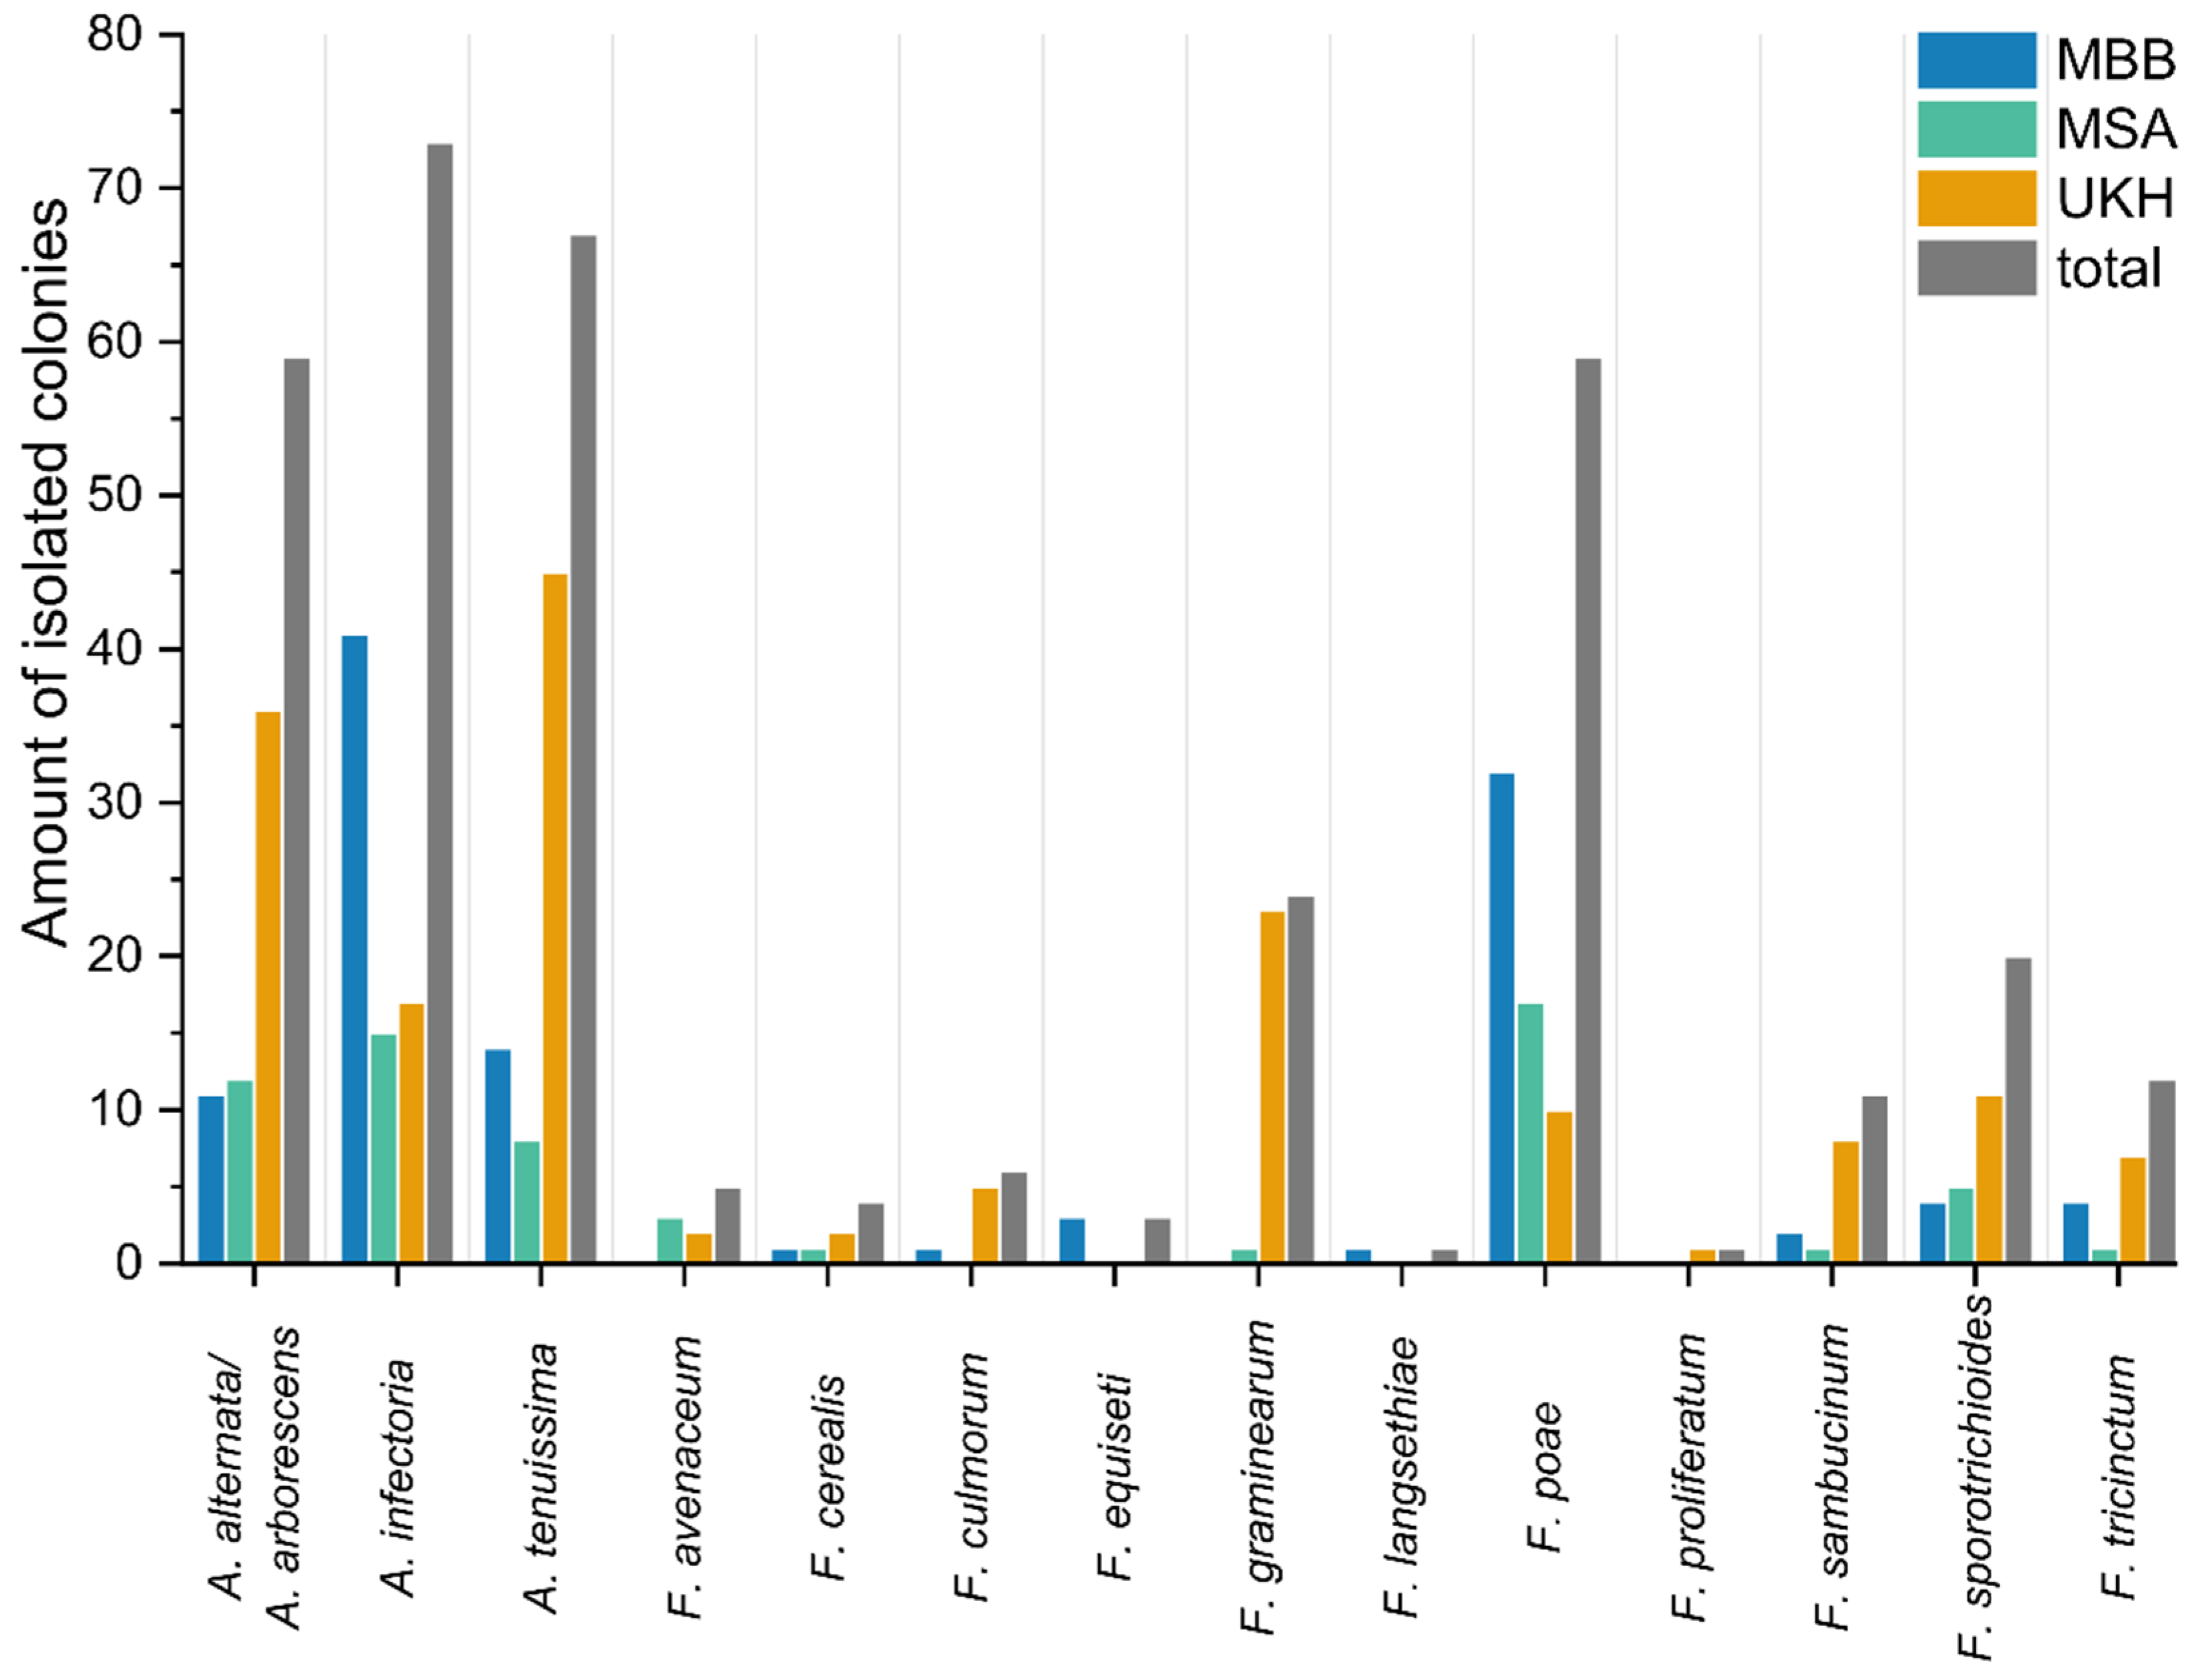
2.3. Culture-Based Identification of Fusaria and Alternaria

Fusaria and alternaria were successfully isolated at all study sites. All species found were already associated with wheat in Germany. The goal of 20 isolates per species per field, however, was not met in most cases (Table A1). The following fields offered less than 20 Alternaria isolates: UKH2, UKH3, MSA1, MSA2, MBB1, and MBB2. The field UKH3 was the only one that reached the minimum of 20 Fusarium isolates. The sample site UKH4 stood out with a low isolation success of fewer than ten fusaria per field (Table A1) and reflected the generally low Fusarium abundance (Section 2.2).
The most abundant isolated Fusarium species were F. poae, F. graminearum, and F. sporotrichioides (Figure 3). The composition consisted of 2–7 Fusarium species per field, strongly distributed in a field-specific. In the Uckermark, field UKH4 stood out, resulting in only three different species. In addition, the species composition was unique, with a large proportion of F. tricinctum and F. avenaceum. F. poae was predominantly found in the fields outside the Uckermark. This was most evident in field MBB1, where 95% of the isolates were F. poae. In contrast, the fields in the Uckermark, except UKH4, had significantly more F. graminearum (20–30%, Figure 4), found only once in MSA2. Field UKH2 was the only one from which F. proliferatum and MBB3 from which F. langsethiae could be isolated (Figure 4). F. equiseti could only be found in the MBB region.
Among the isolated species, Alternaria species groups were abundant in all fields. All three species groups had the lowest presence in MSA, a region with low soil quality and the highest amount of precipitation in the first half of 2020 compared to the other regions (Table 1). A. infectoria dominated in MBB, and UKH had twice as much A. alternata/A. arborescens and A. tenuissima as the other regions (Figure 3). There were no pronounced differences in Alternaria group composition between fields in a region, apart from MSA (Figure 5). In the fields of MBB, A. infectoria predominated. In contrast, in UKH, mycotoxin-producing alternaria accounted for 70% and more.

2.4. NGS Data Analysis (ITS)

After filtering out non-fungal sequences and excluding OTUs that occurred only two or fewer times per sample, 849 OTUs and 246 samples remained. These were affiliated with 5 phyla, 22 classes, 51 orders, 104 families, 104 genera, and 317 species. The average sequencing depth was 15,400 reads per sample. In total, the data comprised 3.8 million reads from 246 samples.

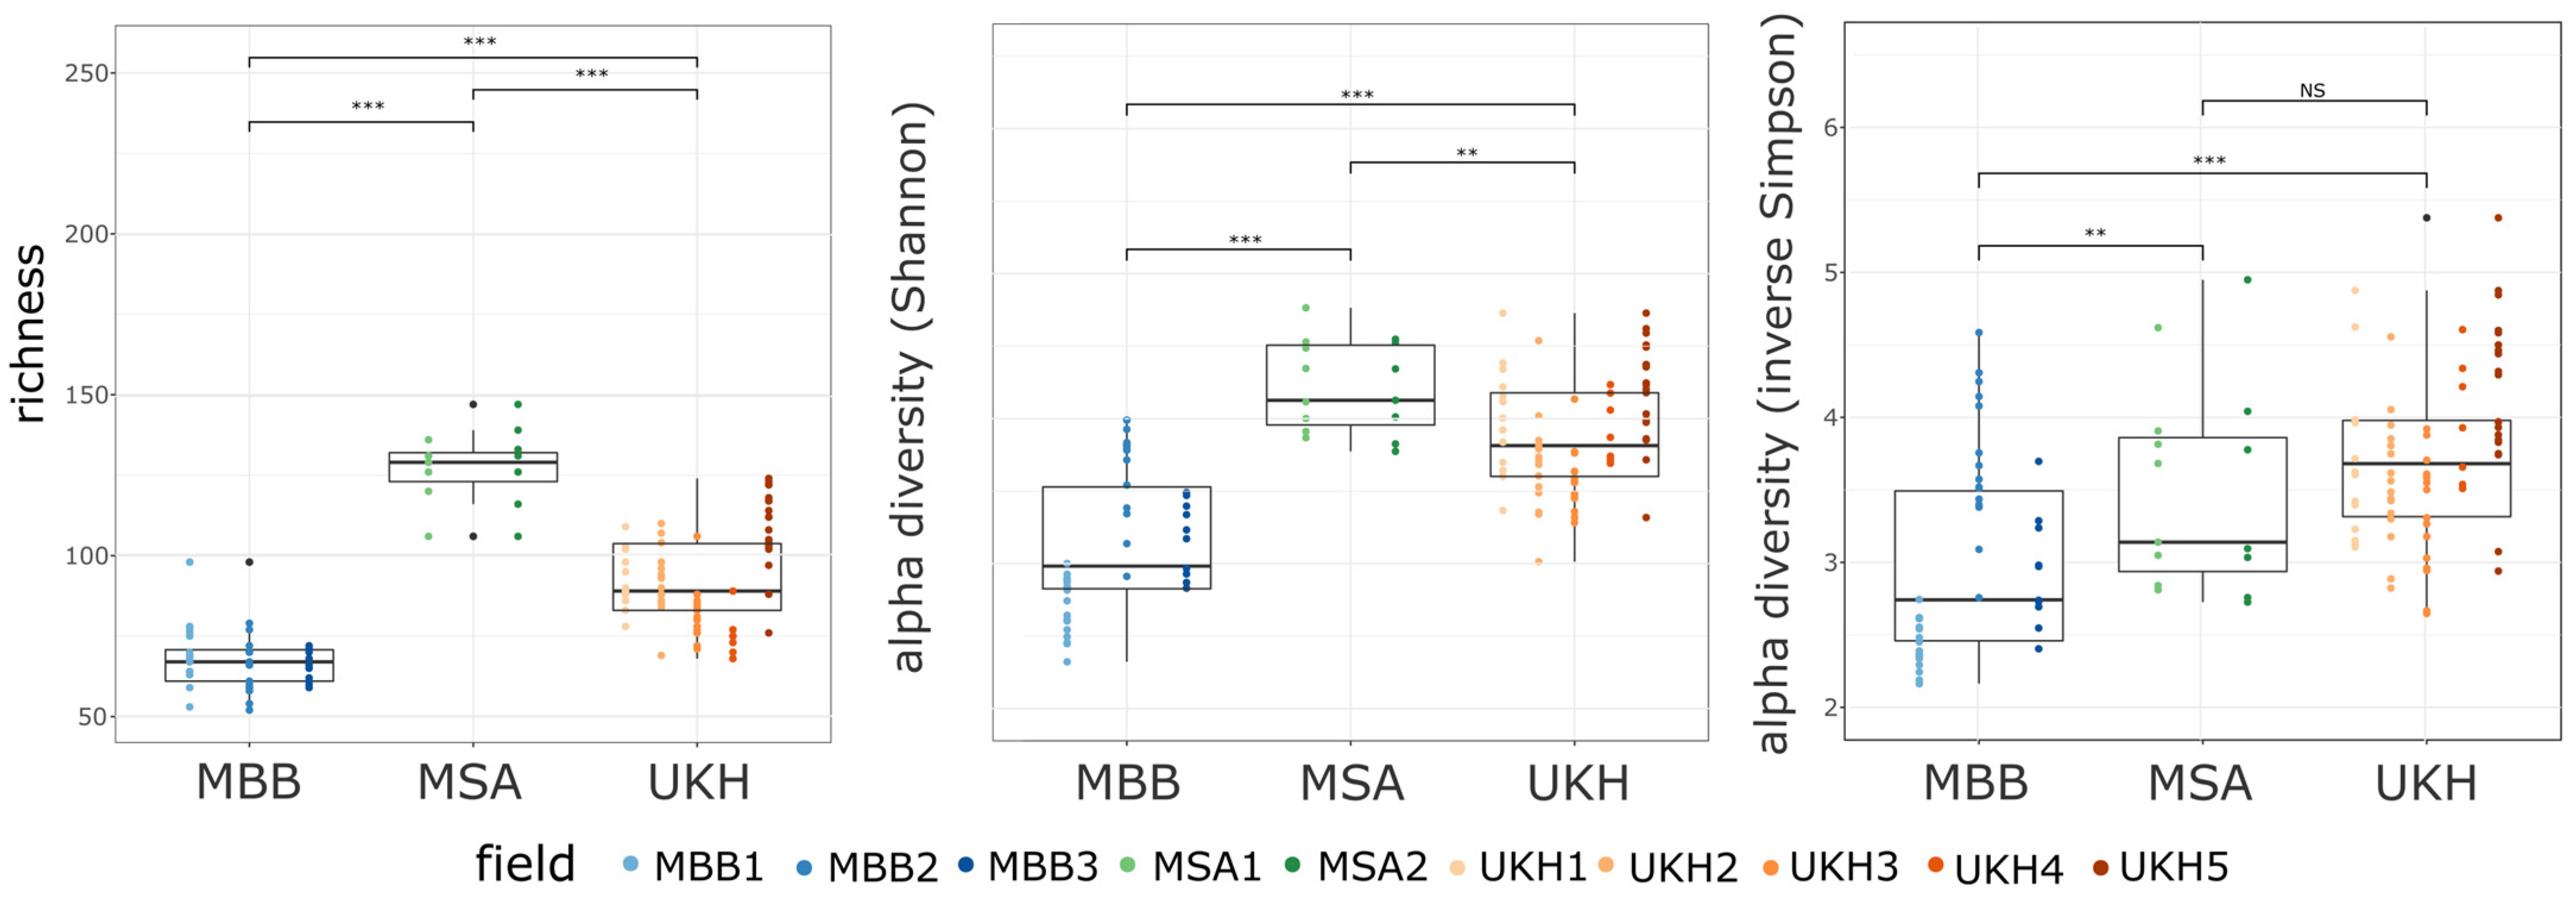
2.4.1. Alpha Diversity

For alpha diversity analyses, the unfiltered fungal OTUs were rarefied to a uniform depth of 14,000 reads per sample, resulting in the removal of 119 samples and 142 OTUs. This was the level that removed problematic samples for alpha diversity but still left enough replicates for each landscape/field.
Between the three sites, a significant difference existed in their alpha diversity. The Magdeburger Börde showed the lowest diversity and thus the lowest species diversity that could be recorded with the ITS primers (Figure 6). On the other hand, the fields in the Müncheberger Sander were doubled in richness compared to the Magdeburger Börde (Figure 6, left panel). The richness in the Uckermärkisches Hügelland also differed significantly from the other two sites and was in the middle range with its values. The same pattern was depicted by the Shannon alpha diversity index (Figure 6, middle panel).
In contrast, the UKH had the highest alpha diversity for the inverse Simpson index, giving less weight to the rare species (Figure 6, right panel) among landscapes, which was not significantly different from the MSA landscape. In terms of species richness, the MBB landscape had the lowest alpha diversity and was significantly different from the other landscapes studied. The field site MBB2 tended to have higher alpha diversity than 50% of this landscape data points (outliers box).

2.4.2. Beta Diversity

The field site explained 44% of the variance in community composition based on PERMANOVA analyses (Table A2). Principal coordinate analysis (PCoA) on relative fungal community composition revealed clear clusters for the three landscape areas. The Müncheberger Sander was highly separated and hardly overlapped with the other regions (Figure 7). The absolute abundance of Fusarium or Alternaria (Section 2.2) was driving the separation of fungal communities that belonged to the Uckermärkisches Hügelland or Magdeburger Börde, respectively.
Within the landscape regions, there was a significant difference between the beta diversity of the fields, still explaining up to 16% of the total variance in the data (Table A3). PCoA further investigated the effect of individual fields within the landscapes on the fungal communities. Field MBB1 in the Magdeburger Börde formed its cluster, as did field UKH4 in the Uckermärkisches Hügelland. All other cluster study sites overlapped within the landscape region. Still, field UKH3 shared two of its sample points with UKH4. In addition, UKH3 and UKH5 exhibited a gradient characterized by the absolute abundance of Alternaria copies (Figure 8). The overlapping clusters also reflected the spatial situation of the fields very well. The fields MBB2 and MBB3 in the Magdeburger Börde, MSA1 and MSA2 in the Müncheberger Sander, and UKH1 to UKH3 in the Uckermärkisches Hügelland country were directly connected. Field MBB1, on the other hand, was about 2 km away from the other two fields. UKH4 was at least 2.5 to 13 km away from the fields in its region and was also surrounded by many forests (Figure 13).

2.4.3. Taxonomic Composition

The relative abundances of OTUs were taxonomically aggregated at the order level for the examined fields (Figure 9). Data for Fusarium and Alternaria could not be compared beyond the genus level (Appendix A). The wheat ears studied were dominated mainly by species of the orders Capnodiales and Sporidiobolales. The third most abundant species belonged to the order Pleosporales, which includes Alternaria. The order Hypocreales, to which the fusaria belong, was the fifth most represented. Field UKH3 had a comparatively high proportion of Hypocreales, which was also reflected in the quantitative Fusarium abundances (Section 2.2).
The order Hypocreales and its family Nectriaceae were consequently selected as a biomarker of the UKH region (Figure 10). The composition of the fields in MBB were comparable to each other, especially the two fields MBB2 and MBB3. Both had a substantially higher proportion of Sporidiobolales and Tremellales and a substantially lower proportion of Pleosporales, contrasting this region from the MSA and UKH region (Figure 9). Accordingly, Sporidiobolales was identified as a biomarker of the MBB region by the linear discriminant analysis effect size (LEfSe) method. The composition of field MBB1 was shifted by a relative increase in Capnodiales and Pleosporales, like the proportions of the fields from Müncheberg. Thereby, Capnodiales and Pleosporales were confirmed as a biomarker of the MSA region by the LEfSe analyses (Figure 10). In the Uckermark, UKH4 again differed from the fungal composition of the other and stood out, having a higher proportion of Sporidiobolales and Cystofilobasidiales within its region (Figure 9).

2.4.4. Correlation of Fungal Community Composition with the Quantitative Abundance of Fusarium and Alternaria across and within Regions

The relationships between fungal community and Fusarium and Alternaria abundances, as well as between plant height and soil moisture (represented by topographic wetness index; TWI), were visualized using a distance-based redundancy analysis (dbRDA; Figure 11. Across regions, the fungal community in UKH was significantly driven by the abundance of Fusarium quantified by qPCR, which was already suggested by exploratory analyses (Section 2.2). In contrast, the abundance of Alternaria in MSA had a stronger influence on the fungal community (Figure A2). No such correlation was evident in MBB. Plant height and TWI were weakly correlated with the fungal community (Table A5).
When comparing the fields of the MBB region, the fungal community in MBB1 correlated positively with Alternaria abundance and in MBB2 and MBB3 with TWI and only slightly with plant height (Figure 11, left panel). Fusarium abundance was positively correlated with the fungal community in all MBB fields. A strong negative correlation between plant height and Alternaria abundance was evident in MBB and MSA. Overall, the fungal community in MSA was similarly influenced by the height, TWI, and Alternaria abundance parameters presented in dbRDA (Figure 11, middle panel). Fusarium abundance had a minimal effect on the fungal community in MSA. In UKH, Fusarium abundances were correlated positively with plant height. The fungal community in UKH1–UKH3 and UKH5 was equally influenced by all parameters, with TWI exerting a weak influence. In contrast, field UKH4 remained unaffected by any parameter (Figure 11, right panel).

3. Discussion

3.1. Differences between and within Regions

All three regions not only differed in their abiotic characteristics but also appeared different in their microbial composition (Table 1). Different biomarkers (MBB: Sporidiobolales, MSA: Capnodiales, Pleosporales, UKH: Hypocreales) and the predominant Fusarium species (MBB and MSA: F. poae, UKH: F. graminearum, F. tricinctum) determined for every region made the variations visible. Furthermore, it was shown by MBB and UKH that a region could not inevitably be seen as a uniform entity. Thus, our results showed differences between regions and, in some cases, within the individual region. We could see that fields within a region often had the same characteristics the closer they were to each other. This context was reflected particularly clearly in the PCoA (Figure 8), where the adjacent fields MSA1 and MSA2, UKH1 and UKH2, and MBB2 and MBB3 overlapped considerably, if not entirely.
Table 1. Overview of all landscape features recorded for the regions Magdeburger Börde (MBB), Müncheberger Sander (MSA), and Uckermärkisches Hügelland (UKH) and the results obtained through this study.
Average CharacteristicsMBBMSAUKH1–UKH3UKH4–UKH5
Soil regionOld moraine
landscapes
Young moraine
landscapes
Young moraine
landscapes
Young moraine
landscapes
Soil typeChernozemAlbeluvisolBrown soils–
para brown soils
Brown soils–para brown soils
SQR≥85<35–<5050–<7050–<70
Arable yield potentialvery highvery lowmediummedium
TWI8.37.87.87.0
Precipitation sum (mm)
(Jan–July 2020)
277291233262
Mean temperature (°C)
(Jan–July 2020)
10.810.510.09.9
Height of wheat plants (cm)85738891
qPCR fusaria (gcn/g)14,22050,256353,505275,063
qPCR alternaria (gcn/g)19,997391,773149,09187,041
Dominant FusariumF. poaeF. poaeF. graminearumF. graminearum,
F. tricinctum
Taxonomic biomarkerSporidiobolalesCapnodiales,
Pleosporales
HypocrealesHypocreales

3.1.1. Magdeburger Börde (MBB)

MBB laying in old moraine landscapes is rated as a potentially high-yielding and reliable region and was able to stand out in our study with the lowest abundances for Fusarium and Alternaria (Table 1). In addition, the region is characterized by the lowest long-term average precipitation of the three regions. This parameter is hypothesized to be related to mycotoxin production by Fusarium and is thought to positively influence the active soil community, thus promoting Fusarium persistence [24].
According to the study by Müller et al. [24], a long-term mean precipitation value above 550 mm is associated with a 3.7-fold increase in mycotoxin levels in deoxynivalenol (DON) produced by Fusarium. Besides MBB (with 534 mm), the long-term precipitation mean was above the mentioned value of 550 mm (Table 1). F. graminearum and F. culmorum are the leading producers of DON [29,30] and occurred only once in MBB and MSA.
MBB1 was an exception in this region. While MBB2 and MBB3 were neighboring and had similar characteristics, MBB1 differed significantly in its taxonomic composition. MBB1 had more than twice as many Capnodiales and Pleosporales and was characterized by a 31-fold higher Alternaria abundance in the region.
All three fields differed in the isolated Fusarium species. From MBB1, only two species, F. poae and F. equiseti, could be isolated. MBB2 and MBB3 were similar in the F. poae proportion, but only in MBB2 could F. cerealis, F. sambucinum, and F. culmorum be isolated. In contrast, in MBB3, F. langsethiae and a significantly higher proportion of F. sporotrichioides than in MBB2 could be isolated. This result gives an idea of the variety of influences that ultimately affect community assembly and reflects the diversity within a region.

3.1.2. Müncheberger Sander (MSA)

MSA is a region with meager yield potential and had the lowest wheat heights on average in our study. Furthermore, the region showed the highest Alternaria abundance, concluding in a high infection rate (Table 1). This is also reflected in the comparatively high representation of the order Pleosporales (includes Alternaria), which was statistically shown to be a biomarker for MSA. Low plant height may also indicate lower biomass and further a stressed plant. Due to the saprophytic nature of Alternaria, this phytopathogenic group increases when the plant and its defense mechanisms are weakened [18].
Furthermore, MSA showed the highest species richness compared to the three regions studied. Yet, the alpha diversity was only in the middle rank after excluding the rare species. An explanation may be found in the composition of the surrounding landscape. The landscape consisted of small patches of different arable crops, which formed a highly heterogeneous landscape. Some studies show the effects of smaller fields on the biodiversity of macroorganisms such as birds, plants, butterflies, bees, syrphids, carabids, and spiders [31,32]. These studies confirm that agricultural landscapes with smaller patches can improve biodiversity. Unfortunately, studies investigating this relationship at the microorganism level are still needed. Although there are studies on microbial biogeography [33,34], no conclusions can be drawn about microbial biodiversity in small-scale heterogeneous environments.

3.1.3. Uckermärkisches Hügelland (UKH)

UKH was most affected by the mycotoxin-producing Alternaria species A. alternata/A. arborescens and A. tenuissima. In addition, there was a gradient in the abundance of Alternaria within the fields, particularly evident in UKH3 and UKH5. This could have been due to differences in microclimate or soil morphological changes on a small scale that we could not capture with our measure of abiotic values. On a smaller scale, for example, changes in microclimate could favor Alternaria at specific spots. For example, Schiro et al. [35] showed that alternaria were more abundant at warmer and drier sites within the field. UKH ranks in the midrange for many of our measurements for the three regions. UKH was most affected by Fusarium abundances and obtained the biomarker for the order Hypocreales, to which Fusarium also belongs. Two fields stood out in the region: UKH3 and UKH4.
UKH3 had with 6.3 × 10⁵ gcn/g the highest Fusarium abundances and was among the few fields from which more than 20 Fusarium isolates were retrieved. These results are also supported by the fact that the highest proportion of Hypocreales was found in UKH3 with respect to all field sites.
UKH4 contrasted with the lowest proportion of Hypocreales in the fungal composition and held a higher percentage of Sporidiobolales and Cystofilobasidiales. This pattern was also confirmed in Fusarium and Alternaria abundances, which appeared to be the lowest at all study sites. Four isolates composed of three species (F. sporotrichioides, F. tricinctum, and F. avenaceum) were obtained via the culture-dependent variant. There were three species, of which only F. sporotrichioides produces toxic trichothecenes, beauvericin, and fusarin C [36], while the other two species were insignificant in terms of mycotoxins. F. graminearum, the species predominant in all the other UKH fields, was not found in UKH4.
One explanation for the opposite results could be the landscape structure. In the eastern area of the UKH, the landscape is more homogeneous and becomes more heterogeneous in the western area. A particular attribute of UKH4 was the enclosure of the field by forests surrounded by three sides (Figure 13a). Forests can disrupt the exchange of organisms across the landscape and create a physical discontinuity between fields. Once again, there is a gap in studies examining the dispersal barriers of microorganisms, as the studies that have been conducted chiefly focus on animals and theoretical models [37,38].
However, the differences must always consider the fact that these were conventionally farmed fields, not always managed by the same farmer. This was an important factor that we could not consider in our analyses. The history of the fields, i.e., the long-term crop rotation of the field, also plays a crucial role in the microbial assemblage, as shown by Sommermann et al. [38] and Orrù et al. [39]. Studies also indicate that the combination of crop rotation, variety selection, and fungicide impact yield and the incidence of Fusarium [39,40,41]. In this regard, different practices can have different effects on different species. Drakopoulos et al. [41] have shown, for example, that reduced tillage practices can increase DON levels and the incidence of F. graminearum. On the other hand, F. poae responded to conventional tillage with an increased incidence.

3.2. Region-Specific Biomarkers and Their Microbiomes

Furthermore, it was noticeable that two dominant groups of Fusarium were found between the regions. In UKH, mainly F. graminearum was found, whereas F. poae predominated in the other two regions. Unfortunately, our study could not determine to what extent this was due to the type of soil tillage. F. poae, compared to F. graminearum and F. culmorum, is a rather mild pathogen capable of producing a wide variety of mycotoxins, including type A and B trichothecenes, beauvericin, and enniatin [42,43]. There has been a recent shift in the past 20 years in F. graminearum becoming the main Fusarium species in Europe, mainly due to the immense expansion of maize production on the continent [44]. Since F. graminearum also occurs on maize, crop rotations of wheat and maize create highly favorable conditions for this species. Nevertheless, Fusarium populations can shift considerably within and between cropping seasons [42,43]. Accordingly, the occurrence of a Fusarium species can fluctuate between regions and from one year to the following [42]. Therefore, multi-year studies would be required to confidently characterize MBB and MSA as a region dominated by F. poae.
Nevertheless, our study determined a specific phyllosphere ITS biomarker for each region. In other words, a fungal order is significant for this region and represents the main trait. The order Sporidiobolales, which predominates in MBB, originate from a wide range of habitats ranging from freshwater and marine ecosystems, soils, and plant tissues to Antarctic permafrost [45]. However, they have not yet been shown to have a positive effect on combating pathogens. Additionally represented prominently in MBB was the order Tremellales, with the genus Cryptococcus. This genus contains several strains of biological control agents, such as C. flavescens, C. aureus, and C. carnescens, which are extensively studied as biocontrol agents against Fusarium [46,47,48]. The extent to which the increased proportion of Cryptococcus in MBB decreased Fusarium abundance remains to be investigated.
In MSA, the two orders Capnodiales and Pleosporales were determined as biomarkers inhabiting several strains reducing disease severity. Several studies tested the order Capnodiales with the genus Cladosporium as a biocontrol agent [49]. In a field trial, Rojas et al. [49] detected a strong negative correlation between Cladosporium herbarum and three F. graminearum OTUs. Alternaria and Phoma are found in the order Pleosporales. Several species of both genera are known to act as antagonists against Fusarium [50,51,52]. For example, in a dual-culture plate test, A. alternata showed inhibitory activity against various Fusarium species, including F. oxysporum, F. sporotrichioides, F. equiseti, and F. solani [51]. In a climate chamber experiment, co-inoculation with A. tenuissima could limit the growth and mycotoxin production of F. graminearum [52]. Karlsson et al. (2021) also described that various Alternaria sp. and Phoma sp., with specific examples of A. tenuissima and Phoma glomerata, reduced disease severity caused by F. graminearum. Thus, the increased Alternaria abundances in MSA could contribute to the low Fusarium abundances.
The increased occurrence of Fusarium in UKH can also be found in the regional biomarker order Hypocreales. Even though the order also includes Trichoderma, which is used as a biocontrol agent [51,53,54], Fusarium did not seem to have been strongly affected by it during our sampling period.

3.3. Multifactorial Processes in Community Assembly

We could not establish significant correlations between regional abiotic factors and the established microbiomes. The results demonstrate that microbial assembly is a multifactorial process that is not yet fully understood. Regional conditions are only one factor contributing to this process. To understand the overall situation, other levels have to be taken into account, as differences between the regions were indeed found. As Kraft et al. [55] and Schlägel et al. [56] discussed, environmental filtering is only one piece of the community assembly puzzle; dispersal filtering and biotic filtering are also essential.
First, the dispersal capabilities of an organism must be sufficient to reach the site it intends to colonize [56]. There is limited information in the literature on the wind dispersal of different Fusarium species. In a wind tunnel experiment, Fusarium spores of different species exhibited different wind dispersal tendencies and indicated probable wind dispersal with carrier media or mobile linkers [57]. Kivlin et al. [20] showed that dispersal was not the limiting filter for regional fungal composition in soil. Instead, it suggested that site-specific abiotic factors, i.e., environmental filters, in combination with stochastic or neutral processes, were responsible for regional composition.
Secondly, for survival and successful reproduction, the abiotic environmental conditions in the new site must be suitable [56]. For example, Kivlin et al. [20] found that soil fungal community composition correlated with soil nitrate, ammonium, soil C:N, and soil moisture. Thapa and Prasanna [58] described microbial diversity in the phyllosphere as a reflection of environmental conditions. Abiotic factors, such as season, water content, relative humidity, soil composition [58], geographic location, solar radiation, pollution, and nutrients [59], can affect the structure and abundance of the phyllosphere community.
Third, some biotic drivers challenge persistence in the presence of other species [56]. On the one hand, the genetic network of the plant can influence the microbiome, as Shakir et al. [25] summarized. On the other hand, local competition takes place on the plant surface. There are two broad groups, pathogens and beneficials, which can act either directly against the pathogens or indirectly through the plant [26,50].
The complexity behind the filter processes in the composition of a community is high and far from being well understood. Future studies should try to choose a multifactorial approach and serve as many filter scales as possible. In addition, a multi-year experimental design is advisable to capture fluctuations in the occurrence of some species.

3.4. Closing Remarks

With regional differences in mind, we created the first detailed study in Germany that examines the fungal phyllosphere of wheat. Our results show apparent differences, although their final explanation occasionally remains open. The importance of the phyllosphere gradually gains interest. However, the importance is not less valuable than the rhizosphere and soil community, especially with increasing diseases of the above-ground plant parts such as the re-emerging rust fungi Puccinia graminis [60].
The results can serve as a guide for the shifting of cultivation regions, which should also be chosen on the basis of their phytopathogenic infection potential in the future. In this regard, special consideration should be given to the region-specific potential as an environmental filter. We also hope that the study will inspire the inclusion of microbial metacommunity analyses in the selection of future growing regions. As a result, region-specific characteristics will be better understood and can be applied in evaluating the agricultural suitability of new regions.

4. Materials and Methods

4.1. Study Sites and Sample Collection

The study sites were in North-East Germany (Figure 12) and sampled in 2020. Only wheat fields with maize as a previous crop were selected to increase the incidence of pathogens. The cultivation and treatment of the crops took place according to the practices of conventional agriculture. All farmers practiced reduced tillage. The selection included fields that were close to each other as well as fields that were at different distances from each other (from 20 m to 196 km) (Table 2).
The study area was selected primarily because of its different wheat yield potential, including fields from the regions Magdeburger Börde (MBB), Müncheberger Sander (MSA), and Uckermärkisches Hügelland (UKH) (Figure 12). Ten field sites were numbered according to the region in which they lay (Figure 13).
Figure 13. Field site position in the region (a) Uckermärkisches Hügelland (UKH), (b) Magdeburger Börde (MBB), and (c) Müncheberger Sander (MSA).
Plants 12 00507 g013

4.2. Landscape Characteristics

4.2.1. Soil and Yield Potential

Characteristic properties of soil composition and site-specific yield potential were determined from the soil atlas of the Federal Institute for Geosciences and Natural Resources using the Müncheberg Soil Quality Index (SQR) (https://geoviewer.bgr.de/mapapps4/resources/apps/bodenalas/idex.html?lang=de&tab=boedenDeutschlands (accessed on 23 August 2022)). We used the ArcMap software (v 10.7.0.10450, Esri, Redlands, CA, USA) for the landscape mapping and the calculation of the topographic wetness index (TWI). The TWI describes the tendency of an area to accumulate water and is, therefore, often used as an indicator for soil moisture [61]. The function for TWI was developed by Beven et al. [62], with TWI being defined as ln(α/tan β), where α (α = A/L) is the local upslope area (A) draining through a certain point per contour length (L) and tan β is the local slope. A grid width of 20 m was used to calculate the TWI with the ArcMap Toolbox “Spatial Analyst”.
The landscape Magdeburger Börde is located in the soil region old moraine landscape and consists of soils of the Loess Uplands with the predominant soil type Chernozem. In the SQR, all three fields receive a value of ≥85, indicating a very high arable yield potential. The TWI ranges from 7.5 to 9.2, showing a slight increase in water accumulation compared to the other regions.
The landscape Müncheberger Sander ”elon’s to the soil region young moraine landscape. It is mainly characterized by soils of the outwash plain and dry valley sands as well as the sandy plates and sandy terminal moraine. The main component of the soil type is Albeluvisol. MS1 and MS2 fields received an extremely low to very low SQR (value: from <35 to <50) and therefore represent a region with very low arable yield potential. The two fields in Müncheberg showed a TWI of 8.3 (MSA1) and 7.3 (MSA2) and thus an average TWI for this region of 7.8.
The soil in the landscape region Uckermärkisches Hügelland belongs to the soil region young moraine landscape and is characterized by soils of the ground moraine plates and loamy end moraines. Soil types such as brown and para brown soils mainly characterize this landscape. Our experimental design classified it as low to middle in the SQR (50 to <70) and represents a region with medium yield potential. The TWI ranges from 6.9 to 8.1 depending on the field position; with an average value of 7.5, the TWI in this region is the lowest compared to the other two. Thus, in this region is relatively less water accumulation.

4.2.2. Climate

The Climate data in 2020 were obtained from the website of the German Meteorological Service (https://www.dwd.de/DE/leistungen/cdc /cdc_ueberblick-klimadaten.html (accessed on 23 August 2022)). The meteorological data from January to July 2020 were summarized in Table 3. The long-term average temperature and precipitation of each region are presented in Table 4. Given the spatial distance of the fields in UKH, data from two weather stations, near UKH1–UKH3 and UKH4–UKH5, were listed as references.

4.3. Sample Collection

The field samples were collected in 2020, approximately two weeks after flowering and three weeks before harvest. Every field had 27 sample points (except fields MSA1 and MSA2 with 15 and 16 sample points, respectively) and three to six transects at approximately 25 m distance between each other to cover a broader range in the field and to balance heterogeneous characteristics within a field. Within a transect, there were up to nine sampling points at 50 m apart. The total number of collected field samples was 247. At each sampling point, the height of 10 wheat plants in a one-square-meter segment was measured to provide an indirect value for site productivity. Fifteen wheat ears were cut at each sampling point.

4.4. Fungi Isolation and Determination

For each sampling point, ten kernels of the freshly harvested wheat ears were placed on Petri dishes with potato dextrose agar (PDA; Merck, Heidelberg, Germany) supplemented with chloramphenicol (CA); i.e., with five kernels per dish. The Petri dishes were incubated at 24 °C for two days in darkness and afterward placed in a box with a UV-A lamp (wavelength 320–400 nm) under a UV-A light/darkness automatic cycle (12 h UV light, 12 h darkness) in room temperature for at least four days to support sporulation and typical development of the mycelium color. From the PDA + CA Petri dishes, we attempted to collect 20 Fusarium and 20 Alternaria fungi of as many species groups for each field to overview the fungal diversity available on the selected wheat fields. The selected colonies were transferred to fresh PDA and synthetic nutrient agar (SNA, [63]) plates for further species determination on the basis of microscopic and macroscopic characteristics described by Leslie and Summerell [64].
Single-spore isolates of Fusarium were generated in preparation for the subsequent sequencing following the protocol of Noman et al. [65]. The mycelium on the new PDA plates was again left to grow for three days in the incubator and afterward for seven days in the UV box and stored at 7 °C to be used for further procedures.
A representative isolate selection of all Fusarium species was sent for sequencing to confirm the accuracy of the Fusarium species determined by the culture-dependent method. Therefore, DNA was extracted from half of the mycelium of an overgrown plate according to a customized standard protocol of the NucleoSpin® Soil Kit (Macherey-Nagel GmbH and Co. KG, Düren, Germany). The lysis step from the standard protocol was modified in that the lysate was left at room temperature for 1 h before spinning down. In addition, the samples were centrifuged at 13,000 rpm instead of 11,000 rpm in all steps. PCR amplification and amplicon sequencing were performed by LGC Genomics (Berlin, Germany). For a species-specific Fusarium determination, the region of the translation elongation factor 1-alpha (TEF) was selected according to the protocol of the Fusarium-ID project [66]. The following primer pair was used for sequencing the TEF region: ef1 forward primer 5′-ATGGGTAAGGA(A/G)GACAAGAC-3′, ef2 reverse primer 5′-GGA(G/A)GTACCAGT(G/C)AT CATGTT-3′. To confirm the preliminarily identified isolates of Fusarium species, we selected the FUSARIUM-ID database accessible via the Internet (http://isolate.fusariumdb.org (accessed on 27 January 2022)), whose protocol we also followed for PCR amplification. On the platform, we used the integrated nucleotide BLAST query to identify Fusarium species, accessing over 5558 reference sequences from 1844 isolates representing more than 200 phylogenetically distinct species. The BLAST program provided results in terms of best matches with the sequences available in the database. The results were compared with the previously determined microbiological data and revised. Thereby, we gave higher importance to the data from sequencing.

4.5. Fungal Quantification with qPCR

Fifteen wheat ears were collected from each sampling point, then dried at 60 °C for 48 h and ground with a disk mill RS200 (Retsch, Haan, Germany) at 1000 rpm for 1.15 min. From the ground material, 50 mg were taken for genomic DNA extraction using the DNeasy Plant Mini Kit (QIAGEN GmbH, Hilden, Germany). For a detailed description of the method, see Müller et al. [67]. Quantifying Fusarium (efficiency > 0.89 and R2 > 0.96) and Alternaria (efficiency > 0.91 and R2 > 0.998) by qPCR was based on the probes and primers listed in Table 5 and was previously described in detail by Gerling et al. [68]. All qPCR assays included negative controls and were run in duplicate. The fungal strains used to generate the standard curves were obtained from a culture collection of fungi at the Leibniz Centre for Agricultural Landscape Research Müncheberg.

4.6. NGS

The extracted DNA from the qPCR analysis was used for next-generation sequencing (NGS) to examine the entire fungal composition. Therefore, the first nuclear ribosomal internal transcribed spacer region (ITS1) used the ITS1F (5′-CTTGGTCATTTAGAGGAAGTAA-3′) and ITS2 (5′-GCTGCG TTCTTCATCGATGC-3′) fungal specific primer pair [69]. PCR amplification and amplicon sequencing using an Illumina MiSeq platform were performed by LGC Genomics (Berlin, Germany).

4.7. Data Management

Research data are available at the ZALF data storage: https://doi.org/10.4228/zalf-m1vb-v194 (accessed on 13 December 2022), and raw sequencing data at the Sequence Read Archive (SRA) of NCBI: https://www.ncbi.nlm.nih.gov/sra/PRJNA876280 (accessed on 1 October 2022). The sequence data that support the identification of Fusarium species of this study are available from the corresponding author (A.H.), upon reasonable request.

4.8. Statistical Analysis

Plant height, fungal isolation, and qPCR data were statistically analyzed and presented using OriginPro (version 2019b; OriginLab Corporation, Northampton, MA, USA). Data were tested for normal distribution (Kolmogorov–Smirnov test) and homogeneity of variances (Levene test). Differences between the different fields and the three regions were analyzed with the one-way ANOVA and the Bonferroni post hoc test (α = 0.001).
The basic bioinformatics pipeline for the NGS data were performed by LGC Genomics (Berlin, Germany). According to the company data description, the procedure was as follows: The raw read quality was assessed with FastQC v0.11.9, and demultiplexing was performed using bcl2fastq, followed by merging forward and reversed reads using BBMerge v34.48. Pre-processing and OTU picking from amplicons was performed with Mothur v1.35.1: filtering of short products elimination of chimera with the uchime algorithm. CD-HIT-EST v4.6.1 clustering was performed at the 97% identity level, with cluster representative sequence re-selection to the most abundant sequence instead of the default representative sequence (default: longest sequence). Taxonomic classification of OTUs was performed using the UNITE version 6 reference database and RDP tool (11.4). Species-level resolution of Fusarium and Alternaria was insufficient for most of the hits we obtained, and thus the evaluation was made at the genus level.
Data obtained from the sequencing company were imported into the R statistical environment, and non-fungal OTUs were discarded. For alpha diversity analyses, the unfiltered fungal OTUs were rarefied to a uniform depth of 14,000 reads per sample, resulting in the removal of 119 samples and 142 OTUs. This was the level that removed problematic samples for alpha diversity but still left enough replicates for each landscape/field. Moreover, for the beta diversity analyses, only OTUs occurring at least two times per sample were recovered. For beta diversity, we used Hellinger transformation, relative abundances, and normalization/transformation included in the LEfSe tool.
Diversity analyses were based on phyloseq [70] and utilized robust Aitchison distance implemented by vegan::vegdist [71] and further made use of ape::pcoa [72] for unconstrained or capscale function for constrained or unconstrained ordination and vegan::adonis2 [73] for permutational analyses of variance (PERMANOVA). Assumptions of PERMANOVA were checked using betadisper and permutest. Moreover, ggplots2 [73] and microeco [74] were used to produce visualizations. Biomarker taxa that were differential abundant across analyzed regions and can reflect their biological conditions were identified using LEfSe [75], defining an LDA score of 4 as a cutoff.

Author Contributions

Conceptualization, A.H. and M.E.H.M.; methodology, A.H. and M.E.H.M.; software, A.H. and S.L.; validation, A.H. and S.L.; formal analysis, A.H. and S.L.; investigation, A.H., A.-R.P. and G.V.; resources, M.E.H.M.; data curation, A.H., A.-R.P. and G.V.; writing—original draft preparation, A.H., M.E.H.M. and S.L.; writing—review and editing, A.H., C.B. and M.E.H.M.; visualization, A.H. and S.L.; supervision, M.E.H.M. and C.B.; project administration, M.E.H.M.; funding acquisition, M.E.H.M. All authors have read and agreed to the published version of the manuscript.

Funding

This work was funded by Deutsche Forschungsgemeinschaft, in the framework of the BioMove Research Training Group (DFG-GRK 2118/1-2).

Institutional Review Board Statement

Not applicable.

Informed Consent Statement

Not applicable.

Acknowledgments

We thank Petra Lange, Martina Peters, and Grit von der Waydbrink for excellent technical assistance. Special thanks to Marco Herrmann and to the Zentralstelle der Länder für EDV-gestützte Entscheidungshilfen und Programme im Pflanzenschutz (ZEPP) who helped to mediate the testing sites in Magdeburger Börde.

Conflicts of Interest

The authors declare no conflict of interest. The funders had no role in the design of the study; in the collection, analyses, or interpretation of data; in the writing of the manuscript; or in the decision to publish the results.

Appendix A

Figure A1. Boxplot showing the taxonomic composition of fungal species for Fusarium and Alternaria per field and region. MBB = Magdeburger Börde, MSA = Müncheberger Sander, UKH = Uckermärkisches Hügelland.
Plants 12 00507 g0a1
Figure A2. dbRDA plot showing the relations between fungal community and TWI, Alternaria and Fusarium abundances, and plant height that best explain the variation in the fungal community in the three landscape regions. MBB = Magdeburger Börde, MSA = Müncheberger Sander, UKH = Uckermärkisches Hügelland.
Plants 12 00507 g0a2
Table A1. Summary of the isolated fusaria and alternaria from wheat ears at the different sample sites. The target was to obtain 20 isolates per field and genus. MBB = Magdeburger Börde, MSA = Müncheberger Sander, UKH = Uckermärkisches Hügelland.
FieldIsolated ColoniesTotal
AlternariaFusarium
MBB1191837
MBB2141832
MBB3331245
MSA1181634
MSA2171330
UKH1221537
UKH2151328
UKH3182240
UKH422426
UKH5211536
total360260620
Table A2. The effect of landscape on fungal community composition determined by PERMANOVA on Aitchison distances.
DfSumOfSqsR2FPr (>F)
Soil landscape29.29990.43751203.640.001***
Field76.56760.3089741.090.001***
Residual2365.38870.25351
Total24521.25621
Signif. code: ‘***’ 0.001. Formula: fungal distance matrix ~ soil. landscape + field. *** Terms added sequentially (first to last); permutation: free; number of permutations: 999.
Table A3. The effect of field site on fungal community composition determined by PERMANOVA on Aitchison distances.
DfSumOfSqsR2FPr (>F)
MSA
Field213840.145926.57760.001***
Residual778100.80.85408
Total799484.81
MBB
Field1206.70.043661.32380.01**
Residual294528.30.95634
Total3047351
UKH
Field43437.30.163166.33680.001***
Residual13017,629.30.83684
Total13421,066.61
Signif. codes: ‘***’ 0.001 ‘**’ 0.01. ** Formula: fungal distance matrix ~ field. *** Terms added sequentially (first to last); permutation: free; number of permutations: 999.
Table A4. The effect of TWI, Alternaria and Fusarium abundances, plant height, and SQR on fungal community composition determined by permutation test for capscale under reduced model on Aitchison distances. Related parameters to dbRDA plot (Figure 11).
DfVarianceFPr (>F)
Model837.08383.4910.001***
Residual236131.025
Terms
TWI12.90352.2810.001***
qPCR Allternaria110.266184.9120.001***
qPCR Fusarium13.28759.1970.001***
Plant height12.4744.4570.001***
SQR.rating418.15381.7430.001***
Residual236131.025
Correlation with axis
CAP1CAP2
TWI0.25268324−0.2731339
copiesALT−0.67589029−0.2029782
copiesFUS−0.054747770.3695871
Height0.313132610.5519229
Signif. codes: ‘***’ 0.001.Formula: Aitchison distance ~ TWI + copiesALT + copiesFUS + height + SQR.rating. *** Terms added sequentially (first to last); permutation: free; number of permutations: 999.
Table A5. Correlation between fungal community and TWI, Alternaria and Fusarium abundances, and plant height. Related parameters to dbRDA plot (Figure 11).
VariablesCorrelation MethodCorrelation Coefficientp-Valuep-Adjusted
HeightPearson0.062629160.0230.023*
TWIPearson0.137935070.0010.001333**
copiesALTPearson0.138933710.0010.001333**
copiesFUSPearson0.187674430.0010.001333**
Signif. codes: ‘**’ 0.01, ‘*’ 0.5.

References

  1. Kremen, C.; Iles, A.; Bacon, C. Diversified Farming Systems: An Agroecological, Systems-based Alternative to Modern Industrial Agriculture. Ecol. Soc. 2012, 17, 44. [Google Scholar] [CrossRef]
  2. Beillouin, D.; Ben-Ari, T.; Makowski, D. Evidence map of crop diversification strategies at the global scale. Environ. Res. Lett. 2019, 14, 123001. [Google Scholar] [CrossRef]
  3. Tamburini, G.; Bommarco, R.; Wanger, T.C.; Kremen, C.; van der Heijden, M.G.A.; Liebman, M.; Hallin, S. Agricultural diversification promotes multiple ecosystem services without compromising yield. Sci. Adv. 2020, 6, eaba1715. [Google Scholar] [CrossRef]
  4. Hernández-Ochoa, I.M.; Gaiser, T.; Kersebaum, K.C.; Webber, H.; Seidel, S.J.; Grahmann, K.; Ewert, F. Model-based design of crop diversification through new field arrangements in spatially heterogeneous landscapes. A review. Agron. Sustain. Dev. 2022, 42, 74. [Google Scholar] [CrossRef]
  5. Schaller, J.; Frei, S.; Rohn, L.; Gilfedder, B.S. Amorphous Silica Controls Water Storage Capacity and Phosphorus Mobility in Soils. Front. Environ. Sci. 2020, 8, 94. [Google Scholar] [CrossRef]
  6. Pan, R.; Da Silva Martinez, A.; Santos Brito, T.; Pereira Seidel, E. Processes of Soil Infiltration and Water Retention and Strategies to Increase Their Capacity. J. Exp. Agric. Int. 2019, 9, 84–87. [Google Scholar] [CrossRef]
  7. Saruchi; Kumar, V.; Mittal, H.; Alhassan, S.M. Biodegradable hydrogels of tragacanth gum polysaccharide to improve water retention capacity of soil and environment-friendly controlled release of agrochemicals. Int. J. Biol. Macromol. 2019, 132, 1252–1261. [Google Scholar] [CrossRef] [PubMed]
  8. Olesen, J.E.; Trnka, M.; Kersebaum, K.C.; Skjelvåg, A.O.; Seguin, B.; Peltonen-Sainio, P.; Rossi, F.; Kozyra, J.; Micale, F. Impacts and adaptation of European crop production systems to climate change. Eur. J. Agron. 2011, 34, 96–112. [Google Scholar] [CrossRef]
  9. Gambella, F.; Bianchini, L.; Cecchini, M.; Egidi, G.; Ferrara, A.; Salvati, L.; Colantoni, A.; Morea, D. Moving toward the north? The spatial shift of olive groves in Italy. Agric. Econ. 2021, 67, 129–135. [Google Scholar] [CrossRef]
  10. King, M.; Altdorff, D.; Li, P.; Galagedara, L.; Holden, J.; Unc, A. Northward shift of the agricultural climate zone under 21st-century global climate change. Sci. Rep. 2018, 8, 7904. [Google Scholar] [CrossRef] [PubMed]
  11. Webber, H.; Ewert, F.; Olesen, J.E.; Müller, C.; Fronzek, S.; Ruane, A.C.; Bourgault, M.; Martre, P.; Ababaei, B.; Bindi, M.; et al. Diverging importance of drought stress for maize and winter wheat in Europe. Nat. Commun. 2018, 9, 4249. [Google Scholar] [CrossRef] [Green Version]
  12. Le Gouis, J.; Oury, F.X.; Charmet, G. How changes in climate and agricultural practices influenced wheat production in Western Europe. J. Cereal Sci. 2020, 93, 102960. [Google Scholar] [CrossRef]
  13. Parikka, P.; Hakala, K.; Tiilikkala, K. Expected shifts in Fusarium species’ composition on cereal grain in Northern Europe due to climatic change. Food Addit. Contam.—Part A 2012, 29, 1543–1555. [Google Scholar] [CrossRef]
  14. Desai, S.; Dubey, S.C.; Prasad, R.D. Impacts of climate change on Fusarium species vis-à-vis adaptation strategies. Indian Phytopathol. 2020, 73, 593–603. [Google Scholar] [CrossRef]
  15. Lawrence, C.B.; Mitchell, T.K.; Craven, K.D.; Cho, Y.; Cramer, R.A.; Kim, K.H. At death’s door: Alternaria pathogenicity mechanisms. Plant Pathol. J. 2008, 24, 101–111. [Google Scholar] [CrossRef]
  16. Zwickel, T.; Kahl, S.; Klaffke, H.; Rychlik, M.; Müller, M. Spotlight on the Underdogs—An Analysis of Underrepresented Alternaria Mycotoxins Formed Depending on Varying Substrate, Time and Temperature Conditions. Toxins 2016, 8, 344. [Google Scholar] [CrossRef] [PubMed] [Green Version]
  17. Thomma, B.P.H.J. Alternaria spp.: From general saprophyte to specific parasite. Mol. Plant Pathol. 2003, 4, 225–236. [Google Scholar] [CrossRef] [PubMed]
  18. Schiro, G.; Verch, G.; Grimm, V.; Müller, M. Alternaria and Fusarium Fungi: Differences in Distribution and Spore Deposition in a Topographically Heterogeneous Wheat Field. J. Fungi 2018, 4, 63. [Google Scholar] [CrossRef] [PubMed] [Green Version]
  19. Romero, F.; Cazzato, S.; Walder, F.; Vogelgsang, S.; Bender, S.F.; van der Heijden, M.G.A. Humidity and high temperature are important for predicting fungal disease outbreaks worldwide. New Phytol. 2022, 234, 1553–1556. [Google Scholar] [CrossRef] [PubMed]
  20. Kivlin, S.N.; Winston, G.C.; Goulden, M.L.; Treseder, K.K. Environmental filtering affects soil fungal community composition more than dispersal limitation at regional scales. Fungal Ecol. 2014, 12, 14–25. [Google Scholar] [CrossRef]
  21. Kelly, A.C.; Clear, R.M.; O’Donnell, K.; McCormick, S.; Turkington, T.K.; Tekauz, A.; Gilbert, J.; Kistler, H.C.; Busman, M.; Ward, T.J. Diversity of Fusarium head blight populations and trichothecene toxin types reveals regional differences in pathogen composition and temporal dynamics. Fungal Genet. Biol. 2015, 82, 22–31. [Google Scholar] [CrossRef] [PubMed]
  22. Pasquali, M.; Beyer, M.; Logrieco, A.; Audenaert, K.; Balmas, V.; Basler, R.; Boutigny, A.L.; Chrpová, J.; Czembor, E.; Gagkaeva, T.; et al. A European Database of Fusarium graminearum and F. culmorum Trichothecene Genotypes. Front. Microbiol. 2016, 7, 406. [Google Scholar] [CrossRef] [PubMed] [Green Version]
  23. Goertz, A.; Zuehlke, S.; Spiteller, M.; Steiner, U.; Dehne, H.W.; Waalwijk, C.; de Vries, I.; Oerke, E.C. Fusarium species and mycotoxin profiles on commercial maize hybrids in Germany. Eur. J. Plant Pathol. 2010, 128, 101–111. [Google Scholar] [CrossRef]
  24. Müller, M.E.H.; Brenning, A.; Verch, G.; Koszinski, S.; Sommer, M. Multifactorial spatial analysis of mycotoxin contamination of winter wheat at the field and landscape scale. Agric. Ecosyst. Environ. 2010, 139, 245–254. [Google Scholar] [CrossRef]
  25. Shakir, S.; Zaidi, S.S.e.A.; de Vries, F.T.; Mansoor, S. Plant Genetic Networks Shaping Phyllosphere Microbial Community. Trends Genet. 2021, 37, 306–316. [Google Scholar] [CrossRef]
  26. Bashir, I.; War, A.F.; Rafiq, I.; Reshi, Z.A.; Rashid, I.; Shouche, Y.S. Phyllosphere microbiome: Diversity and functions. Microbiol. Res. 2022, 254, 126888. [Google Scholar] [CrossRef]
  27. Schiro, G.; Colangeli, P.; Müller, M.E.H. A Metabarcoding Analysis of the Mycobiome of Wheat Ears Across a Topographically Heterogeneous Field. Front. Microbiol. 2019, 10, 2095. [Google Scholar] [CrossRef] [Green Version]
  28. Sapkota, R.; Jørgensen, L.N.; Nicolaisen, M. Spatiotemporal variation and networks in the mycobiome of the wheat canopy. Front. Plant Sci. 2017, 8, 1357. [Google Scholar] [CrossRef] [Green Version]
  29. Munkvold, G.P. Fusarium Species and Their Associated Mycotoxins. Methods Mol. Biol. 2017, 1542, 51–106. [Google Scholar] [CrossRef]
  30. Mirocha, C.J.; Xie, W.; Xu, Y.; Wilcoxson, R.D.; Woodward, R.P.; Etebarian, R.H.; Behele, G. Production of trichothecene mycotoxins by Fusarium graminearum and Fusarium culmorum on barley and wheat. Mycopathologia 1994, 128, 19–23. [Google Scholar] [CrossRef]
  31. Fahrig, L.; Girard, J.; Duro, D.; Pasher, J.; Smith, A.; Javorek, S.; King, D.; Lindsay, K.F.; Mitchell, S.; Tischendorf, L. Farmlands with smaller crop fields have higher within-field biodiversity. Agric. Ecosyst. Environ. 2015, 200, 219–234. [Google Scholar] [CrossRef]
  32. Šálek, M.; Hula, V.; Kipson, M.; Daňková, R.; Niedobová, J.; Gamero, A. Bringing diversity back to agriculture: Smaller fields and non-crop elements enhance biodiversity in intensively managed arable farmlands. Ecol. Indic. 2018, 90, 65–73. [Google Scholar] [CrossRef]
  33. Martiny, J.B.H.; Bohannan, B.J.M.; Brown, J.H.; Colwell, R.K.; Fuhrman, J.A.; Green, J.L.; Horner-Devine, M.C.; Kane, M.; Krumins, J.A.; Kuske, C.R.; et al. Microbial biogeography: Putting microorganisms on the map. Nat. Rev. Microbiol. 2006, 4, 102–112. [Google Scholar] [CrossRef]
  34. Hanson, C.A.; Fuhrman, J.A.; Horner-Devine, M.C.; Martiny, J.B.H. Beyond biogeographic patterns: Processes shaping the microbial landscape. Nat. Rev. Microbiol. 2012, 10, 497–506. [Google Scholar] [CrossRef] [PubMed]
  35. Schiro, G.; Müller, T.; Verch, G.; Sommerfeld, T.; Mauch, T.; Koch, M.; Grimm, V.; Müller, M.E.H. The distribution of mycotoxins in a heterogeneous wheat field in relation to microclimate, fungal and bacterial abundance. J. Appl. Microbiol. 2019, 126, 177–190. [Google Scholar] [CrossRef]
  36. Kokkonen, M.; Jestoi, M.; Laitila, A. Mycotoxin production of Fusarium langsethiae and Fusarium sporotrichioides on cereal-based substrates. Mycotoxin Res. 2012, 28, 25–35. [Google Scholar] [CrossRef]
  37. Strayer, D.L.; Power, M.E.; Fagan, W.F.; Pickett, S.T.A.; Belnap, J. A classification of ecological boundaries. Bioscience 2003, 53, 723–729. [Google Scholar] [CrossRef] [Green Version]
  38. Cadenasso, M.L.; Pickett, S.T.A.; Weathers, K.C.; Jones, C.G. A framework for a theory of ecological boundaries. Bioscience 2003, 53, 750–758. [Google Scholar] [CrossRef] [Green Version]
  39. Marburger, D.A.; Venkateshwaran, M.; Conley, S.P.; Esker, P.D.; Lauer, J.G.; Ané, J.M. Crop Rotation and Management Effect on Fusarium spp. Populations. Crop Sci. 2015, 55, 365–376. [Google Scholar] [CrossRef] [Green Version]
  40. Marburger, D.A.; Conley, S.P.; Esker, P.D.; Lauer, J.G.; Ané, J.-M.; Marburger, D.A.; Conley, S.P.; Lauer, J.G.; Ané, J.-M. Yield Response to Crop/Genotype Rotations and Fungicide Use to Manage Fusarium-related Diseases. Crop Sci. 2015, 55, 889–898. [Google Scholar] [CrossRef]
  41. Drakopoulos, D.; Sulyok, M.; Jenny, E.; Kägi, A.; Bänziger, I.; Logrieco, A.F.; Krska, R.; Vogelgsang, S.; Jedryczka, M. Fusarium Head Blight and Associated Mycotoxins in Grains and Straw of Barley: Influence of Agricultural Practices. Agronomy 2021, 11, 801. [Google Scholar] [CrossRef]
  42. Stenglein, S.A. Fusarium poae: A pathogen that needs more attention. J. Plant Pathol. 2009, 91, 25–36. [Google Scholar]
  43. Vogelgsang, S.; Sulyok, M.; Hecker, A.; Jenny, E.; Krska, R.; Schuhmacher, R.; Forrer, H.R. Toxigenicity and pathogenicity of Fusarium poae and Fusarium avenaceum on wheat. Eur. J. Plant Pathol. 2008, 122, 265–276. [Google Scholar] [CrossRef]
  44. Tillmann, M.; von Tiedemann, A.; Winter, M. Crop rotation effects on incidence and diversity of Fusarium species colonizing stem bases and grains of winter wheat. J. Plant Dis. Prot. 2017, 124, 121–130. [Google Scholar] [CrossRef]
  45. Urbina, H.; Aime, M.C. A closer look at Sporidiobolales: Ubiquitous microbial community members of plant and food biospheres View supplementary material A closer look at Sporidiobolales: Ubiquitous microbial community members of plant and food biospheres. Mycologia 2018, 110, 79–92. [Google Scholar] [CrossRef]
  46. Schisler, D.A.; Slininger, P.J.; Boehm, M.J.; Paul, P.A. Co-culture of Yeast Antagonists of Fusarium Head Blight and their Effect on Disease Development in Wheat. Plant Pathol. J. 2011, 10, 128–137. [Google Scholar] [CrossRef] [Green Version]
  47. Schisler, D.A.; Core, A.B.; Boehm, M.J.; Horst, L.; Krause, C.; Dunlap, C.A.; Rooney, A.P. Population dynamics of the Fusarium head blight biocontrol agent Cryptococcus flavescens OH 182.9 on wheat anthers and heads. Biol. Control 2014, 70, 17–27. [Google Scholar] [CrossRef]
  48. Podgórska-Kryszczuk, I.; Solarska, E.; Kordowska-Wiater, M. Biological Control of Fusarium culmorum, Fusarium graminearum and Fusarium poae by Antagonistic Yeasts. Pathogens 2022, 11, 86. [Google Scholar] [CrossRef]
  49. Rojas, E.C.; Sapkota, R.; Jensen, B.; Jørgensen, H.J.L.; Henriksson, T.; Jørgensen, L.N.; Nicolaisen, M.; Collinge, D.B. Fusarium Head Blight Modifies Fungal Endophytic Communities During Infection of Wheat Spikes. Microb. Ecol. 2020, 79, 397–408. [Google Scholar] [CrossRef] [Green Version]
  50. Karlsson, I.; Persson, P.; Friberg, H. Fusarium Head Blight From a Microbiome Perspective. Front. Microbiol. 2021, 12, 371. [Google Scholar] [CrossRef]
  51. Fakhrunnisa; Hashmi, M.H.; Ghaffar, A. In vitro interaction of Fusarium spp., with other fungi. Pak. J. Bot. 2006, 38, 1317–1322. [Google Scholar]
  52. Hoffmann, A.; Lischeid, G.; Koch, M.; Lentzsch, P.; Sommerfeld, T.; Müller, M.E.H. Co-cultivation of Fusarium, Alternaria, and Pseudomonas on wheat-ears affects microbial growth and mycotoxin production. Microorganisms 2021, 9, 443. [Google Scholar] [CrossRef] [PubMed]
  53. Matarese, F.; Sarrocco, S.; Gruber, S.; Seidl-Seiboth, V.; Vannacci, G. Biocontrol of Fusarium head blight: Interactions between Trichoderma and mycotoxigenic Fusarium. Microbiology 2012, 158, 98–106. [Google Scholar] [CrossRef] [PubMed]
  54. Poveda, J. Trichoderma as biocontrol agent against pests: New uses for a mycoparasite. Biol. Control 2021, 159, 104634. [Google Scholar] [CrossRef]
  55. Kraft, N.J.B.; Adler, P.B.; Godoy, O.; James, E.C.; Fuller, S.; Levine, J.M. Community assembly, coexistence and the environmental filtering metaphor. Funct. Ecol. 2015, 29, 592–599. [Google Scholar] [CrossRef]
  56. Schlägel, U.E.; Grimm, V.; Blaum, N.; Colangeli, P.; Dammhahn, M.; Eccard, J.A.; Hausmann, S.L.; Herde, A.; Hofer, H.; Joshi, J.; et al. Movement-mediated community assembly and coexistence. Biol. Rev. 2020, 95, 1073–1096. [Google Scholar] [CrossRef] [Green Version]
  57. Hoffmann, A.; Funk, R.; Müller, M.E.H. Blowin’ in the Wind: Wind Dispersal Ability of Phytopathogenic Fusarium in a Wind Tunnel Experiment. Atmosphere 2021, 12, 1653. [Google Scholar] [CrossRef]
  58. Thapa, S.; Prasanna, R. Prospecting the characteristics and significance of the phyllosphere microbiome. Ann. Microbiol. 2018, 68, 229–245. [Google Scholar] [CrossRef]
  59. Xu, N.; Zhao, Q.; Zhang, Z.; Zhang, Q.; Wang, Y.; Qin, G.; Ke, M.; Qiu, D.; Peijnenburg, W.J.G.M.; Lu, T.; et al. Phyllosphere Microorganisms: Sources, Drivers, and Their Interactions with Plant Hosts. J. Agric. Food Chem. 2022, 70, 4860–4870. [Google Scholar] [CrossRef]
  60. Trivellone, V.; Hoberg, E.P.; Boeger, W.A.; Brooks, D.R. Food security and emerging infectious disease: Risk assessment and risk management. R. Soc. Open Sci. 2022, 9, 211687. [Google Scholar] [CrossRef]
  61. Kopecký, M.; Macek, M.; Wild, J. Topographic Wetness Index calculation guidelines based on measured soil moisture and plant species composition. Sci. Total Environ. 2021, 757, 143785. [Google Scholar] [CrossRef]
  62. Beven, K.J.; Kirkby, M.J.; Kirkby, A.J. A physically based, variable contributing area model of basin hydrology. Hydrol. Sci. J. 1979, 24, 43–69. [Google Scholar] [CrossRef]
  63. Nierenberg, H. Untersuchungen über die morphologische und biologische Differenzierung in der Fusarium-Sektion Liseola. In Mitteilungen aus der Biologischen Bundesanstalt für Land- und Forstwirtschaft Berlin-Dahlem—169; Kommissionsverlag Paul Parey: Berlin, Germany, 1976; ISBN 3-489-16900-X. [Google Scholar]
  64. Leslie, J.F.; Summerell, B.A. The Fusarium Laboratory Manual; Blackwell Publishing: Hoboken, NJ, USA, 2007; pp. 1–388. [Google Scholar] [CrossRef]
  65. Noman, E.; Al-Gheethi, A.; Rahman, N.K.; Talip, B.; Mohamed, R.; Kadir, O.A. Single Spore Isolation as a Simple and Efficient Technique to obtain fungal pure culture. IOP Conf. Ser. Earth Environ. Sci. 2018, 140, 012055. [Google Scholar] [CrossRef]
  66. Geiser, D.M.; del Mar Jiménez-Gasco, M.; Kang, S.; Makalowska, I.; Veeraraghavan, N.; Ward, T.J.; Zhang, N.; Kuldau, G.A.; O’donnell, K. FUSARIUM-ID v. 1.0: A DNA Sequence Database for Identifying Fusarium. Eur. J. Plant Pathol. 2004, 110, 473–479. [Google Scholar] [CrossRef]
  67. Müller, T.; Ruppel, S.; Behrendt, U.; Lentzsch, P.; Müller, M.E.H. Antagonistic potential of fluorescent pseudomonads colonizing wheat heads against mycotoxin producing alternaria and fusaria. Front. Microbiol. 2018, 9, 2124. [Google Scholar] [CrossRef]
  68. Gerling, M.; Pätzig, M.; Hempel, L.; Büttner, C.; Müller, M.E.H. Arable Weeds at the Edges of Kettle Holes as Overwintering Habitat for Phytopathogenic Fungi. Agronomy 2022, 12, 823. [Google Scholar] [CrossRef]
  69. Li, S.; Deng, Y.; Wang, Z.; Zhang, Z.; Kong, X.; Zhou, W.; Yi, Y.; Qu, Y. Exploring the accuracy of amplicon-based internal transcribed spacer markers for a fungal community. Mol. Ecol. Resour. 2020, 20, 170–184. [Google Scholar] [CrossRef]
  70. McMurdie, P.J.; Holmes, S. phyloseq: An R Package for Reproducible Interactive Analysis and Graphics of Microbiome Census Data. PLoS ONE 2013, 8, e61217. [Google Scholar] [CrossRef] [Green Version]
  71. Oksanen, J.; Simpson, G.L.; Blanchet, F.G.; Kindt, R.; Legendre, P.; Minchin, P.R.; O’Hara, R.B.; Solymos, P.; Stevens, M.H.H.; Szoecs, E.; et al. vegan: Community Ecology Package 2022.
  72. Paradis, E.; Schliep, K. ape 5.0: An environment for modern phylogenetics and evolutionary analyses in R. Bioinformatics 2019, 35, 526–528. [Google Scholar] [CrossRef]
  73. Wickham, H. ggplot2: Elegant Graphics for Data Analysis; Springer: New York, NY, USA, 2016; ISBN 978-3-319-24277-4. [Google Scholar]
  74. Liu, C.; Cui, Y.; Li, X.; Yao, M. microeco: An R package for data mining in microbial community ecology. FEMS Microbiol. Ecol. 2021, 97, 255. [Google Scholar] [CrossRef] [PubMed]
  75. Segata, N.; Izard, J.; Waldron, L.; Gevers, D.; Miropolsky, L.; Garrett, W.S.; Huttenhower, C. Metagenomic biomarker discovery and explanation. Genome Biol. 2011, 12, R60. [Google Scholar] [CrossRef] [PubMed]
Figure 1. Boxplot of the plant heights of all experimental field sites. The corresponding individual data points are shown to the right. The box frames the 25% and 75% quantiles and represents both the median as a line and the mean as a square. The whiskers show a single standard deviation. MBB = Magdeburger Börde, MSA = Müncheberger Sander, UKH = Uckermärkisches Hügelland. All three regions are significantly different from each other at p < 0.001. Significance differences are represented by the letters a, b, and c.
Plants 12 00507 g001
Figure 2. Logarithmized Fusarium and Alternaria abundances in wheat ears of the ten field sites analyzed by qPCR; gene copy number per gram dry mass (gcn/g). The whiskers show a single standard deviation. MBB = Magdeburger Börde, MSA = Müncheberger Sander, UKH = Uckermärkisches Hügelland. Significance differences are represented by the letters a, b, and c. Alternaria abundances differed significantly between all regions at p < 0.001. In terms of Fusarium abundances, UKH differed significantly from MSA at p < 0.01 and MBB at p < 0.001. Fusarium abundances between MBB and MSA were not significant. MBB had the lowest Alternaria and Fusarium levels of all three regions.
Plants 12 00507 g002
Figure 3. The total number of Alternaria and Fusarium isolated from wheat ears partitioned by species and region. MBB = Magdeburger Börde, MSA = Müncheberger Sander, UKH = Uckermärkisches Hügelland. MBB stood out with increased proportions of A. infectoria and F. poae. UKH was characterized mainly by A. alternata/A. arborescens, A. tenuissima, and F. graminearum. MSA had the lowest Fusarium species and exceeded UKH only with F. poae.
Plants 12 00507 g003
Figure 4. Bar chart showing the relative isolated fusaria species from wheat ears per field. MBB = Magdeburger Börde, MSA = Müncheberger Sander, UKH = Uckermärkisches Hügelland. Percentages of Fusarium isolates are grouped by testing sites. The total N per field can be found in Table A1. MSA and MBB were associated mainly with F. poae, while UKH was linked to F. graminearum.
Plants 12 00507 g004
Figure 5. Bar chart showing the relative isolated alternaria species from wheat ears per field. MBB = Magdeburger Börde, MSA = Müncheberger Sander, UKH = Uckermärkisches Hügelland. Percentages of Alternaria isolates are grouped by testing sites. The total N per field can be found in Table A1. MSA and MBB were associated mainly with A. infectoria, while UKH was linked to A. tenuissima and a high percentage of A. alternata/A. arborescens.
Plants 12 00507 g005
Figure 6. The differences in richness of OTUs (left) and alpha diversity (Shannon index: middle; inverse Simpson index: right) changes across landscapes and fields. Significance tested by pairwise Wilcoxon test and p-value adjusted by holm method. Significant at *** p < 0.001, ** p < 0.01, and NS = not significant. MBB = Magdeburger Börde, MSA = Müncheberger Sander, UKH = Uckermärkisches Hügelland. Significant differences in species richness and Shannon diversity prevailed between all regions. Inverted Simpson, giving less weight to rare species, affected mainly MSA and aligned the results with UKH without significance. Replicates per field: MBB1 = 17, MBB2 = 15, MBB = 10, MSA1 = 8, MSA2 = 7, UKH1 = 13, UKH2 = 16, UKH3 = 15, UKH4 = 7, UKH5 = 19.
Plants 12 00507 g006
Figure 7. Principal coordinate analysis (PCoA) based on Aitchison distance of the relative fungal community composition affected by the landscape and quantitative abundance of Fusarium (left) or Alternaria species (right). Ellipses indicate 95% confidence intervals of a multivariate t-distribution. All three regions formed different clusters, with MSA entirely delineated from the others.
Plants 12 00507 g007
Figure 8. Principal coordinate analysis (PCoA) based on Aitchison distance of the relative fungal community composition interactively affected by landscape, field site, and quantitative abundance of Fusarium or Alternaria species (Section 2.2). Ellipses indicate 95% confidence intervals of a multivariate t-distribution. MBB = Magdeburger Börde, MSA = Müncheberger Sander, UKH = Uckermärkisches Hügelland. Within MBB and UKH, some fields were entirely distinct from their cluster (MBB1 and UKH4) and less overlapping (UKH3 and UKH5).
Plants 12 00507 g008
Figure 9. Bar chart showing the relative taxonomic composition of fungal order level in wheat ears averaged per field and region. MBB = Magdeburger Börde, MSA = Müncheberger Sander, UKH = Uckermärkisches Hügelland.
Plants 12 00507 g009
Figure 10. Linear discriminant analysis effect size (LEfSe) depicting differential abundant fungal taxa classified as biomarkers to the three regions analyzed (MBB = Magdeburger Börde, MSA = Müncheberger Sander, UKH = Uckermärkisches Hügelland), with node size scaled to relative abundance. Each region could be significantly assigned to a taxonomic order, which was used as the respective biomarker (MBB with Sporidiobolales, MSA with Capnodiales and Pleosporales, UKH with Hypocreales).
Plants 12 00507 g010
Figure 11. dbRDA plot indicating the effect of Alternaria and Fusarium abundances on the basis of qPCR, TWI, and plant height on the variation in the fungal community composition in the fields of the landscape regions. MBB = Magdeburger Börde, MSA = Müncheberger Sander, UKH = Uckermärkisches Hügelland.
Plants 12 00507 g011
Figure 12. Map of study sites in North-East Germany in the region Uckermärkisches Hügelland (UKH) with five fields, Müncheberger Sander (MSA) with two fields, and Magdeburger Börde (MBB) with three fields.
Plants 12 00507 g012
Table 2. Distance matrix measured from field border to field border in kilometers for the sampled fields. MBB = Magdeburger Börde, MSA = Müncheberger Sander, UKH = Uckermärkisches Hügelland.
FieldMBB1MBB2MBB3MSA1MSA2UKH1UKH2UKH3UKH4UKH5
MBB10
MBB21.40
MBB32.60.20
MSA1179.7182.2183.20
MSA2179.7182.2183.30.020
UKH1196.3198.4199.891.391.30
UKH2196.3198.4199.992.092.000
UKH3193.6195.7197.192.192.12.421.80
UKH4187.0189.0190.595.295.211.010.77.80
UKH5188.4190.4191.898.798.712.812.49.72.50
Table 3. Meteorological data from January to July of 2020 for the regions Magdeburger Börde (MBB), Müncheberger Sander (MSA), and Uckermärkisches Hügelland (UKH). Air temperature at 2 m high, relative humidity, and precipitation sum were collected. Data were obtained from Deutscher Wetterdienst raster maps (https://www.dwd.de/DE/leistungen/cdc/cdc_ueberblick-klimadaten.html (accessed on 23 August 2022)).
MBBJanuaryFebruaryMarchAprilMayJuneJuly
Ø air temperature (°C)4.56.25.810.71218.418.1
Ø rel. humidity (%)83.176.266.553.461.765.264.9
precipitation sum (mm)2381277277240
MSA
Ø air temperature (°C)4.05.74.99.912.618.518.1
Ø rel. humidity (%)84.078.169.355.9-67.968.2
precipitation sum (mm)42772417295943
UKH1–UKH3
Ø air temperature (°C)4.15.34.58.912.617.417.4
Ø rel. humidity (%)89.281.274.863.370.572.068.7
precipitation sum (mm)36533614273730
UKH4–UKH5
Ø air temperature (°C)4.05.24.48.912.417.317.0
Ø rel. humidity (%)89.281.274.863.370.572.068.7
precipitation sum (mm)40563813265237
Table 4. Long-term average temperature and precipitation data from 1991 for the regions Magdeburger Börde (MBB), Müncheberger Sander (MSA), and Uckermärkisches Hügelland (UKH) were summarized. Data obtained from Deutscher Wetterdienst raster maps (https://www.dwd.de/DE/leistungen/cdc/cdc_ueberblick-klimadaten.html (accessed on 23 August 2022)).
RegionLong-Term Average Temperature (°C)Long-Term Average Precipitation (mm)
MBB9.9534
MSA9.5553
UKH1–UKH39.1553
UKH4–UKH59.0580
Table 5. Primers for quantitative identification of Fusarium and Alternaria via qPCR.
S SUF pl3Probe5′-ACCCTTACCGAGCTCAGCGGCTTCCTATT-3′
Fa PL3 fforward5′-TACCCCGCCACTCGAGCG-3′
Fus pl revreverse5′-TTGAGCTTGTCAAGAACCCAGGCG-3′
Alt-Prtprobe5′-TGGGTTCGCCCACCACTAGGACA-3′
Alt-Fforward5′-TCTTTTGCGTACTTCTTGTTTCCTT-3′
Alt-Rreverse5′-TTACTGACGCTGATTGCAATTACA-3′
Disclaimer/Publisher’s Note: The statements, opinions and data contained in all publications are solely those of the individual author(s) and contributor(s) and not of MDPI and/or the editor(s). MDPI and/or the editor(s) disclaim responsibility for any injury to people or property resulting from any ideas, methods, instructions or products referred to in the content.

