Article

Morphological Characterization and Genetic Diversity of Rice Blast Fungus, Pyricularia oryzae, from Thailand Using ISSR and SRAP Markers

by
Apinya Longya
1,
Sucheela Talumphai
2 and
Chatchawan Jantasuriyarat
1,3,*
1
Department of Genetics, Faculty of Science, Kasetsart University, Bangkok 10900, Thailand
2
Major Biology, Department of Science and Technology, Faculty of Liberal Arts and Science Roi Et Rajabhat University, Roi Et 45120, Thailand
3
Center for Advanced Studies in Tropical Natural Resources, National Research University-Kasetsart University (CASTNAR, NRU-KU), Kasetsart University, Bangkok 10900, Thailand
*
Author to whom correspondence should be addressed.
J. Fungi 2020, 6(1), 38; https://doi.org/10.3390/jof6010038
Submission received: 6 March 2020 / Revised: 11 March 2020 / Accepted: 18 March 2020 / Published: 19 March 2020

Abstract

:
Rice blast disease is caused by the ascomycete fungus Pyricularia oryzae and is one of the most destructive rice diseases in the world. The objectives of this study were investigating various fungal morphological characteristics and performing a phylogenetic analysis. Inter-simple sequence repeat (ISSR) and sequence-related amplified polymorphism (SRAP) markers were used to examine the genetic variation of 59 rice blast fungus strains, including 57 strains collected from different fields in Thailand and two reference strains, 70-15 and Guy11. All isolates used in this study were determined to be P. oryzae by internal transcribed spacer (ITS) sequence confirmation. A total of 14 ISSR primers and 17 pairs of SRAP primers, which produced clear and polymorphic bands, were selected for assessing genetic diversity. A total of 123 polymorphic bands were generated. The similarity index value for the strains ranged from 0.25 to 0.95. The results showed that the blast fungus population in Thailand has both morphological and genetic variations. A high level of genetic variation, or genome adaptation, is one of the fungal mechanisms that could overcome host resistance to avoid host recognition. Results from this research study could bring substantial benefits and ultimately help to understand the blast fungal pathogen genome and the population structure in Thai blast fungus.

1. Introduction

The ascomycete fungus Pyricularia oryzae (teleomorph: Magnaporthe oryzae), is one of the most damaging rice diseases in the world and is able to cause a yield loss of up to 30% and infect more than 50 species of grasses, including wheat, barley, oat, and millet [1]. Resistant rice cultivars have been used to control blast disease, but they usually lose resistance within a few years of release because of fungal genome adaptation that escape plant immunity [2]. The genetic diversity of the pathogen has limited the effectiveness of this approach. Understanding the structure of the blast population and genetic diversity are important for managing the disease.
DNA profiling techniques that have been successfully used to assess genetic diversity include inter-simple sequence repeat (ISSR), random-amplified polymorphic DNA (RAPD), and amplified fragment length polymorphism (AFLP) [3]. They are dominant markers, which use universal primers for anonymous regions to extensively analyze the genetic diversity [4]. More recently, sequence-related amplified polymorphism (SRAP) markers have been developed, which are used to amplify coding regions with primers targeting open reading frames (ORFs) [5]. The molecular markers differ in cost, speed, complication, labor, degree of polymorphism, and repeatability. ISSR and SRAP marker techniques are fast and low cost, they do not require sequence information, have high repeatability, and use only one-step PCR. They provide highly discriminating information with good reproducibility and are relatively abundant, while AFLP and RAPD are more labor intensive and time consuming [4,6]. We characterized blast fungal morphology, performed DNA sequence analyses of the internal transcribed spacer (ITS), and used 20 ISSR and 30 SRAP markers to assess the genetic diversity of 59 rice blast strains, including 57 strains collected from Thai rice-growing areas and two reference strains, 70-15 and Guy11. The information obtained from this study will help to understand the population structure and evolution of rice blast fungus in Thailand.

2. Materials and Methods

2.1. Rice Blast Materials

A total of 59 rice blast strains were used, including 57 strains collected from Thai rice-growing areas representing central, northern, and north-eastern parts of Thailand. Two rice blast strains, 70-15 and Guy11, were used as reference strains (Table 1). The stock of each blast strain as in filter paper was cultured and DNA was extracted using the cetyl-trimethyl-ammonium-bromide (CTAB) method described by Longya et al. [7].

2.2. Fungal Morphology Characterization

Each blast fungal strains as in filter paper was cultured on rice flour agar (RFA) at 28 °C for 5 days, then a cork borer was used to cut a hole of the activated mycelium and was transferred to a new RFA plate, followed by incubation at 28 °C. Mycelium radii were measured at 4, 6, 8, and 10 days after incubation and each series was repeated 3 times. Mycelial characteristics on agar plates, including appearance, color, and amount of melanin pigment produced, were recorded. Conidia production was stimulated by scraping the surface of the fungal mycelium with a sterile spreader and incubating under ultraviolet light (black light) for 2 days. Conidia were harvested with sterile water.

2.3. ITS Amplification and Sequencing

ITS regions (18S rDNA, ITS1, 5.8S rDNA, and ITS2) were amplified using the universal primers ITS5 (forward primer; 5′-GGAAGTAAAAGTCGTAACAAGG-3′) and ITS4 (reverse primer; 5′-TCCTCCGCTTATTGATATGC-3′). Polymerase chain reaction (PCR) amplification was conducted in a 25 µL reaction volume containing 100 ng of DNA template, 2.5 µL of 10× PCR buffer (200 mM Tris-HCl, 500 mM KCl), 2 mM of MgCl2, 0.2 mM of each dNTP, 0.5 µM of each primer, and 1 unit of Taq DNA polymerase (Vivantis, Shah Alam, Malaysia). PCR was performed using a Mastercycler nexus (Eppendorf, Hamburg, Germany) under the following conditions: Initial denaturation at 95 °C for 5 min; 35 cycles of denaturation at 95 °C for 30 s, annealing at 55 °C for 30 s, and elongation at 72 °C for 1 min, as well as a final extension at 72 °C for 5 min. The amplification products were resolved in 1% agarose gel using 0.5× TBE buffer at 100 V for 45 min followed by DNA staining with EtBr and analysis using a Gel Doc XR+ with Image Lab software (Bio-Rad, Hercules, CA USA). PCR products were purified using the GF-1 PCR Clean-Up Kit (Vivantis, Shah Alam, Malaysia) based on the manufacturer’s instructions. The purified PCR products were sequenced with the ITS4 primer by a commercial sequencing service provider (U2Bio, Bangkok, Thailand). The resulting sequences of each isolate were refined using a BioEdit sequence alignment editor. To analyze relationships between isolates, all 59 sequences from this study and sequences of 10 reference Pyricularia oryzae isolates from difference hosts (obtained from the GenBank) were aligned using the MEGA X (Version 10.1.7) with Pyricularia pennisetigena (MN947526) used as an outgroup.

2.4. ISSR Analysis

A total of 20 ISSR primers (Table 2) were used for PCR. PCR reactions were performed in a total volume of 25 μL containing 1× PCR buffer, 0.25 mM dNTPs, 5 U Taq polymerase (Vivantis, Shah Alam, Malaysia), 0.8 μmol ISSR primer, and 100 ng DNA template. PCR was performed using a Mastercycler nexus (Eppendorf, Hamburg, Germany) under the following conditions: Initial activation at 94 °C for 5 min; 35 cycles of denaturation at 94 °C for 1 min, annealing at 55 °C for 1 min, and extension at 72 °C for 2 min, as well as final incubation at 72 °C for 10 min. PCR products were visualized by separation in a 1.5% agarose gel followed by DNA staining with EtBr and analysis using a Gel Doc XR+ with Image Lab software (Bio-Rad, Hercules, CA USA). All primers were repeated at least twice.

2.5. SRAP Analysis

A total of 5 forward and 6 reverse primers of SRAP markers (for a total of 30 primer combinations) were used (Table 3). The PCR reaction was in a total volume of 25 μl containing 1× PCR buffer, 0.5 mM dNTPs, 1.5 U Taq polymerase (Vivantis, Shah Alam, Malaysia), 0.2 μmol forward primer and reverse primer, and 50 ng DNA template. PCR was performed using a Mastercycler nexus (Eppendorf, Hamburg, Germany) under the following conditions: Initial activation at 94 °C for 5 min; 6 cycles of denaturation at 94 °C for 1 min, annealing at 35 °C for 40 s, and extension at 72 °C for 2 min; 32 cycles of denaturation at 94 °C for 1 min, annealing at 46 °C for 40 s, and extension at 72 °C for 2 min; and final incubation at 72 °C for 10 min. PCR products were visualized by separation in a 1.5% agarose gel followed by DNA staining with EtBr and analysis using a Gel Doc XR+ with Image Lab software (Bio-Rad, Hercules, CA USA). All primers were repeated at least twice.

2.6. Data Analysis

Amplification products were scored as present (1), absent (0), or missing data (9). The level of polymorphism for each primer was represented by the percentage of polymorphic variable loci relative to all the loci analyzed. Dendrograms were constructed using the unweighted pair-group method with arithmetic means (UPGMA) for clustering. For each of the dendrograms obtained from the ISSR, SRAP, and ISSR+SRAP combination data, a cophenetic matrix was generated using NTSYSpc version 2.01. The polymorphism information content (PIC) of an individual locus for dominant markers (ISSR and SRAP markers) was calculated as:
2ƒi(1–ƒi),
where fi indicates the frequency of bands presence for locus i [8].

3. Results

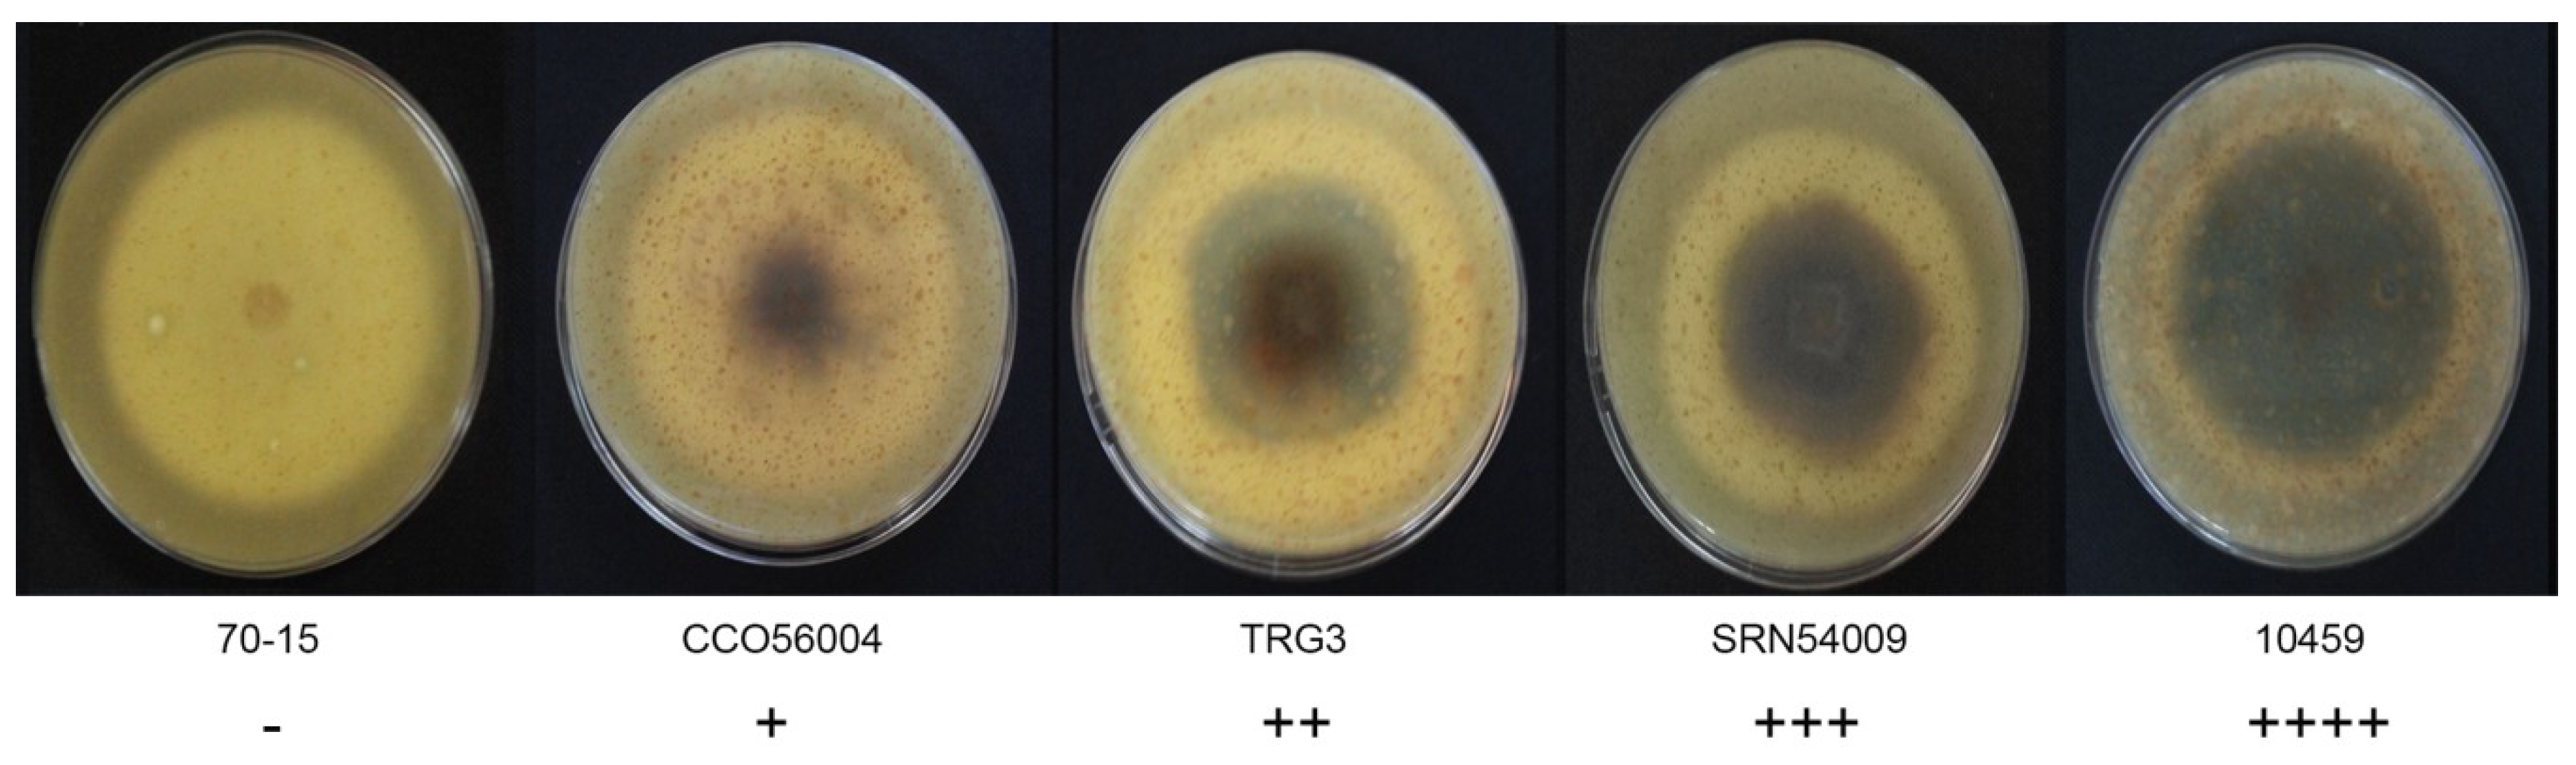
3.1. Fungal Morphology Variation

The morphological characteristics of 59 rice blast strains were examined. Fungal filaments on RFA plates were observed, and each strain showed different characteristics in terms of appearance and color. Three colors were recorded: White, cream, and grey. Flat or fluffy filaments and filament density were observed for filamentous pattern (Table 1 and Figure 1). After 10 days of culture, melanin pigment was observed from a ventral view of the RFA plate and each strain was classified based on their melanin production capability and given one of five scores, - to ++++, depending on the amount of melanin they produced (Table 1 and Figure 2). Fungal growth was measured by the mycelial radius at four, six, eight, and 10 days after incubation (Supplemental Data S1). The average radius of fungal mycelium at four, six, eight, and 10 days were 8.70, 15.36, 21.78, and 26.94 mm with standard deviations of 0.6, 1.13, 1.76, and 2.34 mm, respectively. The conidia shape was observed under a microscope and was classified as one of four patterns: Oval shape (pattern A, Figure 3A), short pyriform shape (pattern B, Figure 3B), pyriform shape (pattern C, Figure 3C), and long pyriform shape (pattern D, Figure 3D). Most conidia were pyriform shape (77.97%, 46/59). Four of 59 (6.78%) of the blast fungal isolates had short pyriform conidia, eight isolates (13.60%) were long pyriform conidia, and one strain (RBR55001) (1.69%) produced oval shape conidia (Table 1).

3.2. ITS Sequence Analysis

The ITS gene regions were successfully amplified and were 567 bp long, of which 497 bp contained an 18S ribosomal RNA partial sequence and complete sequences of internal transcribed spacer 1, the 5.8S ribosomal RNA gene, and internal transcribed spacer 2. BLASTn queries indicated that all isolates used in this study were 100% identical to P. oryzae in GenBank. 57 of 59 isolates had the same nucleotide sequence as the rice blast reference isolate UPM-PO (accession no. KT693184). Two isolates, B1-2 and 70-15, had a 99.80% identity with most isolates with one nucleotide substitution at position 403 (T/G), which is located in the ITS2 region. However, both isolates were 100% identical with another rice blast reference isolate, Gongzhuling01 (accession no. AM180561). All isolates were deposited in GenBank with accession numbers MT126183–MT126241 (Table 1). Interestingly, isolates B1-2 and 70-15 had mating type locus MAT1-1, while the rest of the isolates had mating type locus MAT1-2. A dendrogram depicted by UPGMA analysis was constructed using the Thai rice blast isolates with eight P. oryzae from difference hosts. The dendrogram showed that all Thai rice blast isolates were in the same clade with the reference rice blast isolate UPM-PO (accession no. KT693184) and isolate Gongzhuling01 (accession no. AM180561) and were separated from blast isolates from other host species. The isolate SLSsh051 (host: Stenotaphrum secundatum) and isolate w11-124 (host: Panicum miliaceum) were in the same clade (Figure 4), and another clade comprise blast pathogens from six different hosts: Isolates BrTae (host: Triticum aestivum), CBch004 (host: Bromus catharticus), 19M7 (host: x Triticosecale), 19M5 (host: Hordeum vulgare), MZ5-1-6 (host: Eleusine coracana), and IAsh017 (host: Avena strigosa). The results confirmed that all isolates used in this study belonged to the P. oryzae rice blast pathogen.

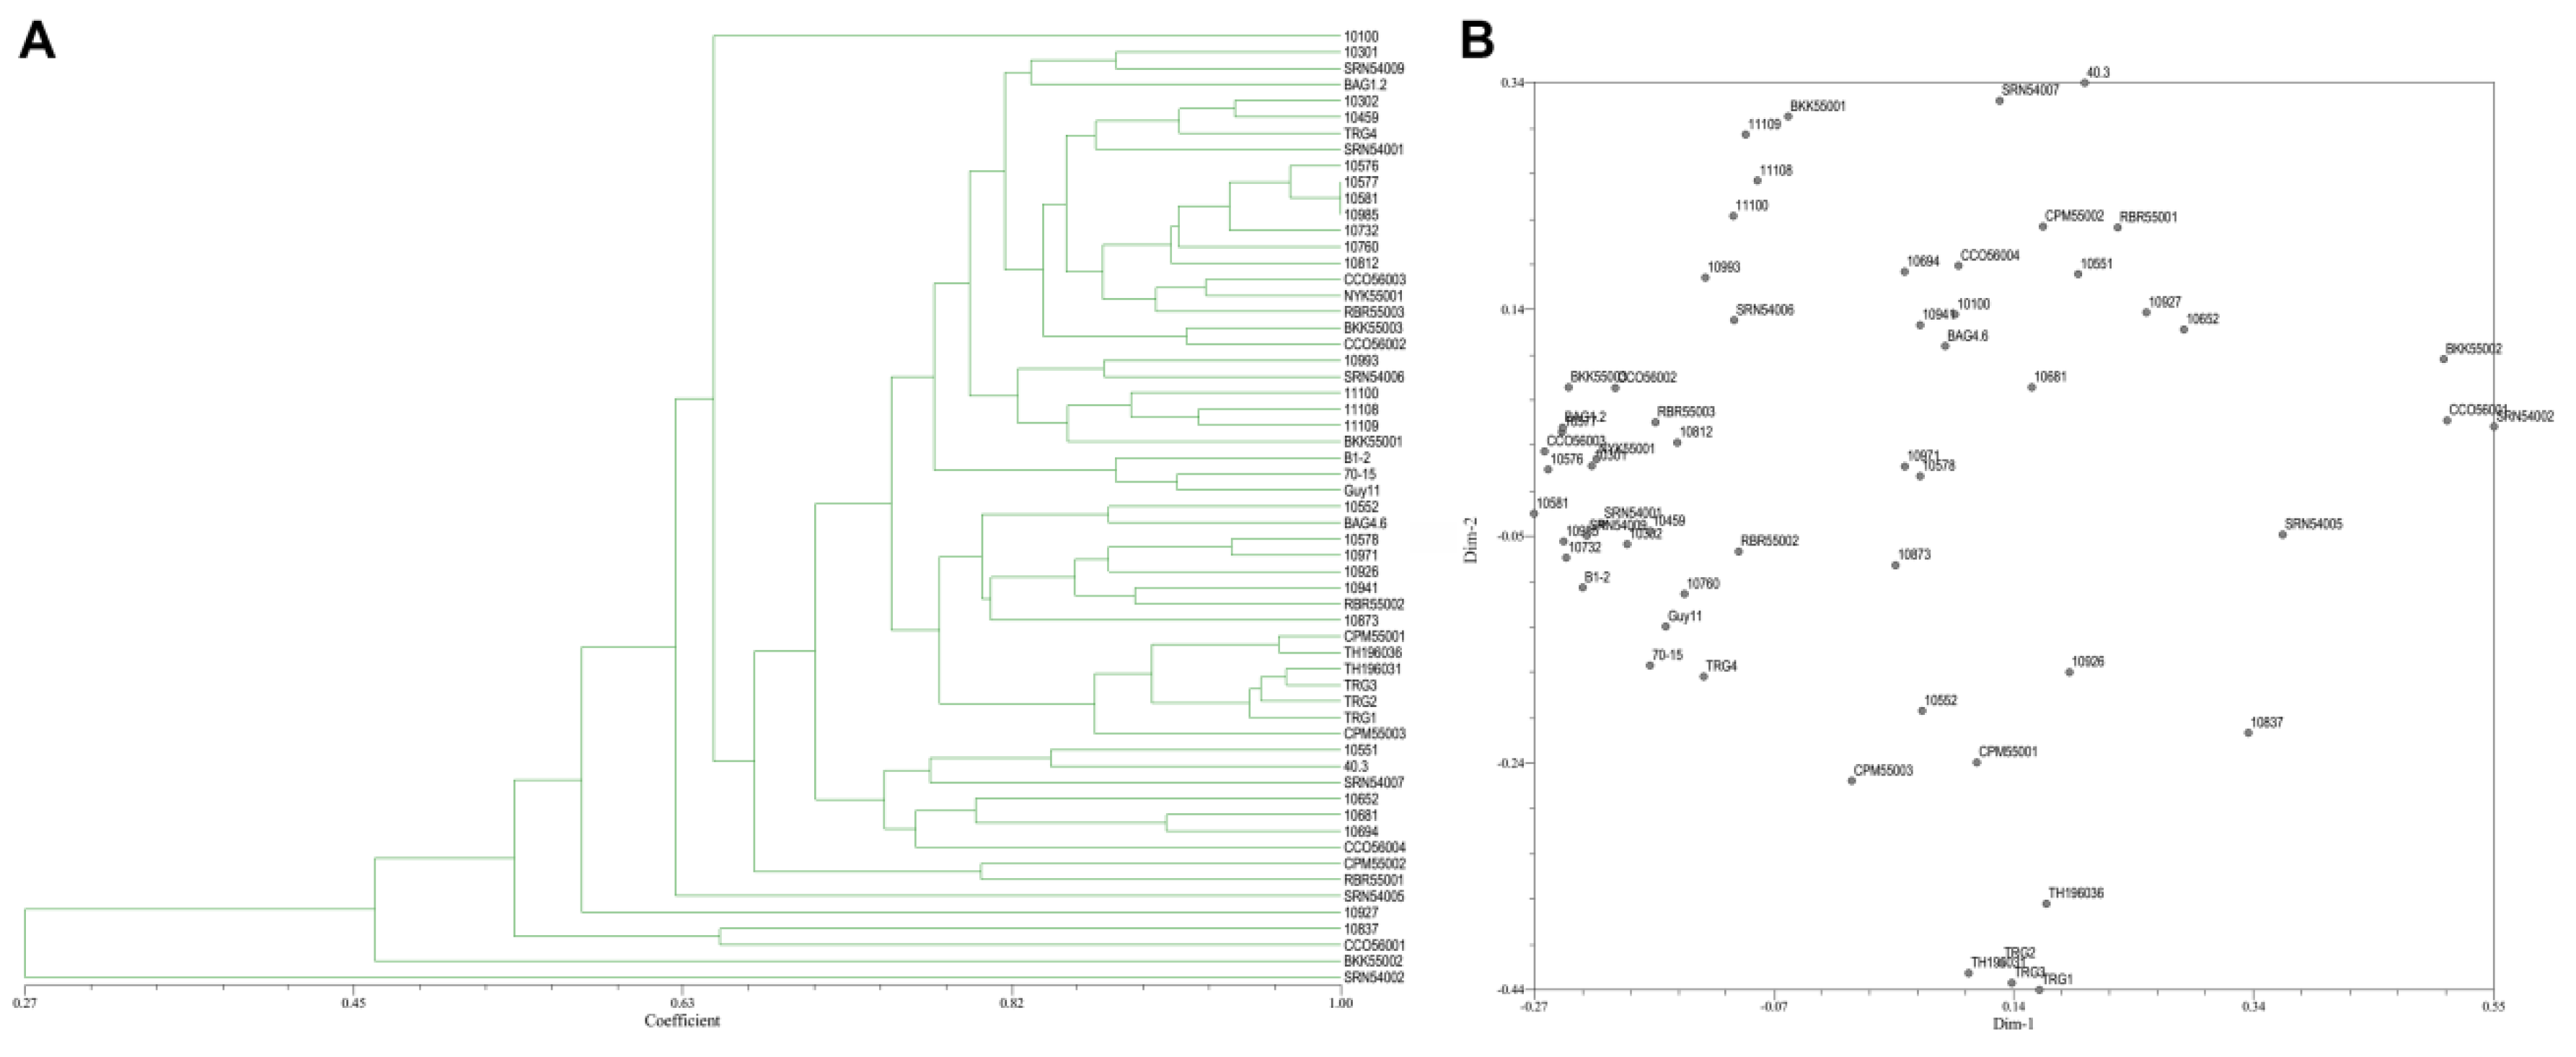
3.3. Genetic Polymorphism from ISSR Marker

From the 20 ISSR primers, 14 primers showed reproducible and polymorphic DNA amplification patterns. 118 DNA bands were obtained with an average of 8.43 DNA bands per primer, and 62 DNA bands (52.90%) were polymorphic bands with an average of 4.43 polymorphic DNA bands per primer (Table 2). The vast majority of ISSR primers showed a moderate level of polymorphism. PIC scores of each primer ranged from 0.07 (ISSR18) to 0.50 (ISSR14, ISSR15, and ISSR17), with an average of 0.36. A genetic similarity ranged from 0.27–1.00. A dendrogram and two-dimensional principal component analysis (PCA) presenting the relationship from ISSR markers based on UPGMA cluster analysis showed that the rice blast population in Thailand is a diverse, sparse arrangement that does not classify into a group (Figure 5A,B).

3.4. Genetic Polymorphism from SRAP Marker

From the 30 SRAP primer combinations, 17 combinations showed clear reproducible band patterns and exhibited polymorphism. The results showed 103 DNA bands with 61 polymorphic bands (68.22%). The average number of generated DNA bands and polymorphic DNA bands per primer were 5.72 and 3.38, respectively (Table 3). The vast majority of SRAP primers showed a moderate level of polymorphism. PIC scores of each primer ranged from 0.03 (SRAP29) to 0.50 (SRAP1, SRAP6, SRAP8, and SRAP24), with an average of 0.39. The coefficients of similarity ranged from 0.29–0.97. A dendrogram and two-dimensional PCA presenting the relationship from SRAP markers based on UPGMA cluster analysis showed that the rice blast population in Thailand is diverse (Figure 6A,B).

3.5. Genetic Polymorphism from ISSR and SRAP Markers Combination

A total of 123 polymorphic DNA bands from the combined data of ISSR and SRAP markers were used to construct a dendrogram. The coefficients of similarity ranged from 0.28–0.95. The dendrogram and two-dimensional PCA presenting the relationship from ISSR and SRAP markers based on UPGMA cluster analysis showed that most rice blast strains were clustered together with only a few strains separated from the main group (Figure 7A,B).

4. Discussion

4.1. Morphological Characteristics of Rice Blast Fungus Strains in Thailand are Diverse

Studies on the morphological characteristics of different rice blast fungus strains in Thailand revealed variations with respect to mycelium color, morphology, and conidia shape. Colony color varied from white to grey. Some strains were unable to produce melanin pigment, while most showed a range of production capabilities. The colony radii of different isolates were recorded, and the standard deviations at day four, six, eight, and 10 were 0.6, 1.13, 1.76, and 2.34 mm, respectively. At the beginning, all strains grew at similar rates, but they eventually began growing at different rates and with unique patterns. This led to the production of different mycelium morphologies. Isolate 10873, due to its highly dense mycelium, showed slower mycelium growth when compared with the others, which is a similar result to a previous report by Sonah et al. [9] in that both color and mycelium grown pattern varied greatly with strains on oat meal agar. The Magnaporthaceae are distinguished from the Pyriculariaceae by their asexual morphs, which are Phialophora- or Harpophora-like. Additionally, Magnaporthaceae have falcate, versicolored conidia on brown, erect conidiophores, while Pyricularia or Pyricularia-like species are characterized by pyriform two-septate conidia, three-celled with difference. The size and shape of spores are an important criteria for the classification and identification of Pyricularia species [9]. Strains significantly varied in spore morphology depending on specific hosts. Some isolates derived from non-rice hosts also showed abnormal spore morphology as spores were longer, cylindrical, and obpyriform [9]. In our results, we found varied conidial shapes, from oval to long pyriform. Most conidia were a pyriform shape (46/59). Only one strain (RBR55001) produced oval conidia and this was different from other strains as well as from previous reports. Many epidemiological studies on the relationship between the formations, dispersal, and infection behavior of spores and environmental factors have been reported [10]. The fungal growth and its morphology are affected by different environmental factors, such as temperature, pH, moisture, degree of aeration, and amount and type of nutrients [11]. Furthermore, mycovirus infection in P. oryzae causes morphological changes, including changes in their growth on agar, melanin biosynthesis, and formation of conidia and appressoria [12].
Due to the overlap of some morphological characteristics and host-specific confirmation, ITS DNA sequencing has been employed to identify fungal pathogens. ITS regions have previously been used for the detection, identification, and classification of Pyricularia isolates [13]. A previous study confirmed that the ITS gene regions could identify Pyricularia at the species level, and sometimes lower than the species level [13,14]. In this study, we used the universal primers ITS5 and ITS4 to amplify the ITS region, because the ITS1 and ITS4 primer pair showed very poor success in our samples (the ITS1 and ITS4 primers can give rise to very poor amplification in some species [15]). Our results confirmed that all isolates used in this study belonged to the P. oryzae rice blast pathogen.

4.2. Genetic Diversity of Pyricularia oryzae Using SRAP and ISSR Markers

The analysis of genetic variation in plant pathogen populations is an important prerequisite for understanding coevolution in the plant pathosystem [16]. In the present study, based on ISSR and SRAP markers, SRAP markers produced a higher percentage of polymorphic bands (69.22%) than ISSR markers (52.90%). However, the average number of polymorphic bands from different markers detected by ISSR primers was 4.43, which was higher than that of SRAP primers (3.39). The dendrograms from the ISSR, SRAP, and ISSR+SRAP combined data showed slightly different groupings. We were unable to group the fungal strains when using ISSR data alone, while the SRAP dendrogram and PCA showed that most of the population tended to cluster together, with only 11 strains separated from the main group (10926, 10927, BKK55002, RBR55001, CCO56002, BKK55001, BKK55003, Guy11, 40.3, 70-15, and B1-2). Sequence-related amplified polymorphism (SRAP) markers amplify the ORF, so the dendrogram may relate to gene variation. The range of similarity in ISSR, SRAP, and ISSR+SRAP analyses were 0.27–1.00, 0.29–0.97, and 0.25–0.95, respectively. The fact that the similarity coefficients in different marker systems were comparable suggests that both markers were equally effective. Mixed multiple marker systems provide more complete genome information about both ORFs and microsatellites. Molecular phylogenetic grouping obtained by ISSR and SRAP analyses did not correlate with morphological characteristics, but morphology may affect conidia germination or pathogenicity. Ngernmuen et al. [17] developed SSR markers from whole genome sequences of rice blast fungus strains and evaluated the genetic diversity of rice blast strains from Thailand. The results showed a high level of genetic diversity, and blast strains could be clustered based on geographic distribution and collection time. Silva et al. [18] used rep-PCR analysis with two primer sequences from Pot2 to assess genetic diversity of rice blast strains from Brazil. Xu et al. [19] used RAPD, REMAP, rep-PCR markers, and AVR gene sequences to examine the genetic diversity of rice blast fungus strains from China. The results revealed that the genetic structure of the P. oryzae population changed significantly over 3 years. Our results indicated that the rice blast population in Thailand does not explicitly group into different clades by site or year of sampling. The results from ISSR and SRAP data show low bootstrap values, suggesting clonal populations in our samples. The genetic variation supports the hypothesis that the main mechanism by which P. oryzae overcomes host resistant in natural conditions might be genome adaptation to avoid host recognition. Two main mechanisms for genome adaptation in fungi are sexual mating and parasexual recombination [20], but sexual reproduction in rice blast fungus has not been observed in the field and sexual spores have been produced only in laboratory settings. Therefore, parasexual recombination could most likely be the major mechanism for the exchange of DNA fragments [21] that causes genetic variation in the rice blast population. The genetic diversity and pathogen population structure from this study furthers our understanding of the rice blast fungus and could be useful for selecting rice cultivars or improving rice cultivars in the future.

Supplementary Materials

The following are available online: https://www.mdpi.com/2309-608X/6/1/38/s1, Data S1: Fungal growth on rice flour agar (RFA) after 4, 6, 8, and 10 days after incubation; fungal mycelium were measured as the radius from the origin in millimeters. #1, 2, and 3 indicate individual replicates. #1 indicates replication 1, #2 indicates replication 2, and #3 indicates replication 3.

Author Contributions

Each author contributed to the production of this manuscript: Conceptualization, C.J.; methodology, A.L.; software, A.L.; validation, A.L. and C.J.; formal analysis, A.L. and C.J.; investigation, C.J.; resources, A.L. and C.J.; data curation, A.L. and C.J.; writing—original draft preparation, A.L.; writing—review and editing, S.T. and C.J.; visualization, A.L., S.T., and C.J.; supervision, C.J.; project administration, C.J.; funding acquisition, A.L. and C.J. All authors have read and agreed to the published version of the manuscript.

Funding

This work was supported by funding from Faculty of Science, Kasetsart University and the Royal Golden Jubilee Ph.D. Program (RGJ-Ph.D. Program) Grant No. PHD/0152/2556.

Conflicts of Interest

The authors declare no conflict of interest.

References

  1. Langner, T.; Białas, A.; Kamoun, S. The blast fungus decoded: Genomes in flux. MBio 2018, 9. [Google Scholar] [CrossRef] [PubMed] [Green Version]
  2. Jones, J.D.G.; Dangl, J.L. The plant immune system. Nature 2006, 444, 323–329. [Google Scholar] [CrossRef] [PubMed] [Green Version]
  3. Costa, R.; Pereira, G.; Garrido, I.; Tavares-de-Sousa, M.M.; Espinosa, F. Comparison of RAPD, ISSR, and AFLP molecular markers to reveal and classify Orchardgrass (Dactylis glomerata L.) germplasm variations. PLoS ONE 2016, 11, e0152972. [Google Scholar] [CrossRef] [PubMed] [Green Version]
  4. Robarts, D.W.H.; Wolfe, A.D. Sequence-related amplified polymorphism (SRAP) markers: A potential resource for studies in plant molecular biology. Appl. Plant Sci. 2014, 2. [Google Scholar] [CrossRef]
  5. Li, G.; Quiros, C. Sequence-related amplified polymorphism (SRAP), a new marker system based on a simple PCR reaction: Its application to mapping and gene tagging in Brassica. Theor. Appl. Genet. 2001, 103, 455–461. [Google Scholar] [CrossRef]
  6. Agarwal, M.; Shrivastava, N.; Padh, H. Advances in molecular marker techniques and their applications in plant sciences. Plant Cell Rep. 2008, 27, 617–631. [Google Scholar] [CrossRef]
  7. Longya, A.; Chaipanya, C.; Franceschetti, M.; Maidment, H.R.J.; Banfield, J.M.; Jantasuriyarat, C. Gene duplication and mutation in the emergence of a novel aggressive allele of the AVR-Pik effector in the rice blast fungus. Mol. Plant Microbe Interact. 2019, 32, 740–749. [Google Scholar] [CrossRef]
  8. Roldán-Ruiz, I.; Dendauw, J.; Van-Bockstaele, E.; Depicker, A.; De-Loose, M. AFLP markers reveal high polymorphic rates in ryegrasses (Lolium spp.). Mol. Breed. 2000, 6, 125–134. [Google Scholar] [CrossRef]
  9. Sonah, H.; Deshmukh, R.K.; Parida, S.K.; Chand, S.; Kotasthane, A.S. Morphological and genetic variation among different isolates of Magnaporthe grisea collected from Chhattisgarh. Indian Phytopathol. 2009, 62, 469–477. [Google Scholar]
  10. Suzuki, H. Studies on the behaviour of the rice blast fungus spore and the application for forecasting method of the rice blast disease. Bull 1969, 10, 114–118. [Google Scholar]
  11. Gaddeyya, G.; Niharika, P.S.; Bharathi, P.; Kumar, P.K.R. Isolation and identification of soil mycoflora in different crop fields at Salur Mandal. Adv. Appl. Sci. Res. 2012, 3, 2020–2026. [Google Scholar]
  12. Moriyama, H.; Urayama, S.I.; Higashiura, T.; Le, T.M.; Komatsu, K. Chrysoviruses in Magnaporthe oryzae. Viruses 2018, 10, 697. [Google Scholar] [CrossRef] [PubMed] [Green Version]
  13. Hirata, K.; Kusaba, M.; Chuma, I.; Osue, J.; Nakayashiki, H.; Mayama, S.H.; Tosa, Y. Speciation in Pyricularia inferred from multilocus phylogenetic analysis. Mycol. Res. 2007, 111 Pt 7, 799–808. [Google Scholar] [CrossRef] [Green Version]
  14. Abed-Ashtiani, F.; Kadir, J.; Nasehi, A.; Hashemian-Rahaghi, S.; Vadamalai, G.; Rambe, S. Characterisation of Magnaporthe oryzae isolates from rice in peninsular Malaysia. Czech J. Genet. Plant Breed. 2016, 52, 145–156. [Google Scholar] [CrossRef] [Green Version]
  15. Luana, B.; Antonella, A.; Deborah, A.; Emanuela, P.; Lucia, P.; Chiara, G.; Vilberto, S. A new pair of primers designed for amplification of the ITS region in Tuber species. FEMS Microbiol. Lett. 1999, 173, 239–245. [Google Scholar] [CrossRef] [Green Version]
  16. McDonald, B.A.; McDermott, J.M.; Goodwin, S.B. The population biology of host pathogen interactions. Annu. Rev. Phytopathol. 1989, 27, 77–94. [Google Scholar] [CrossRef]
  17. Ngernmuen, A.; Suktrakul, W.; Damchuay, K.; Longya, A.; Katengam, S.; Jantasuriyarat, C. Substantial enhancement of high polymorphic SSR marker development using in silico method from 18 available rice blast fungus genome sequences and its application in genetic diversity assessment. Biologia 2019, 74, 1181–1189. [Google Scholar] [CrossRef]
  18. Silva, G.; Prabhu, A.; Filippi, M.; Trindade, M.; Araújo, L.; Zambolim, L. Genetic and phenotypic diversity of Magnaporthe oryzae from leaves and panicles of rice in commercial fields in the State of Goiás, Brazil. Trop. Plant Pathol. 2009, 34, 77–86. [Google Scholar] [CrossRef]
  19. Xu, X.; Yang, W.; Tian, K.; Zheng, J.; Liu, X.; Li, K.; Lu, W.; Tan, Y.; Qin, Y.; Wang, C. Genetic diversity and pathogenicity dynamics of Magnaporthe oryzae in the Wuling Mountain area of China. Eur. J. Plant Pathol. 2018, 153, 731–742. [Google Scholar] [CrossRef]
  20. Noguchi, M.T. Parasexual recombination in Magnaporthe oryzae. Jpn. Agric. Res. Q. 2011, 45, 39–45. [Google Scholar] [CrossRef] [Green Version]
  21. Chuma, I.; Isobe, C.; Hotta, Y.; Ibaragi, K.; Futamata, N.; Kusaba, M.; Yoshida, K.; Terauchi, R.; Fujita, Y.; Nakayashiki, H.; et al. Multiple translocation of the AVR-Pita effector gene among chromosomes of the rice blast fungus Magnaporthe oryzae and related species. PLoS Pathog. 2011, 7, e1002147. [Google Scholar] [CrossRef] [PubMed] [Green Version]
Figure 1. Variation in morphology of Pyricularia oryzae mycelia on the rice flour agar (RFA) medium, showing differences in colors and mycelial growth patterns.
Jof 06 00038 g001
Figure 2. Variation in Pyricularia oryzae melanin production on ventral view of the rice flour agar (RFA) medium, showing differences in melanin production ability. Scoring: No melanin pigment (-), melanin pigment production in less than 20% of the mycelia area (+), melanin production in 20%–50% of the mycelia area (++), melanin production in 50%–80% of the mycelia area (+++), and melanin production in more than 80% of the mycelia area (++++).
Jof 06 00038 g002
Figure 3. Variation in conidia morphology shape under a light microscope. A: Pattern A, oval conidia; B: Pattern B, short pyriform conidia; C: Pattern C, pyriform conidia; and D: Pattern D, long pyriform conidia.
Jof 06 00038 g003
Figure 4. Dendrogram based on the internal transcribed spacer (ITS) of the 59 isolates used in this study compared to the reference Pyricularia oryzae sequences from different hosts obtained from GenBank based on UPGMA cluster analysis. Hosts are specified in parentheses, and GenBank accession numbers are provided following the colon.
Jof 06 00038 g004
Figure 5. (A), Dendrogram presenting the relationship from ISSR markers based on unweighted pair-group method with arithmetic means (UPGMA) cluster analysis. (B), 2D principal component analysis (PCA) based on genetic relationships from ISSR data using the DECENTER and EIGEN features of NTSYSpc.
Jof 06 00038 g005
Figure 6. (A), Dendrogram presenting the relationship from SRAP based on UPGMA cluster analysis. (B), 2D principal component analysis (PCA) based on genetic relationships from SRAP data using the DECENTER and EIGEN features of NTSYSpc.
Jof 06 00038 g006
Figure 7. (A), Dendrogram presenting the relationship from ISSR markers and SRAP markers based on UPGMA cluster analysis. (B), 2D principal component analysis (PCA) based on genetic relationships from ISSR and SRAP data using the DECENTER and EIGEN features of NTSYSpc.
Jof 06 00038 g007
Table 1. Fungal morphological characteristics of 59 rice blast strains and their internal transcribed spacer (ITS) region.
IsolateOrigin (a)YearMycelium Features (b)Melanin Pigment (c)Conidia Shape (d)ITS (e)
10100Srakaew2006Cream, Fluffy, Densely+CMT126183
10301Sisaket2006White, Flat, Densely++++CMT126184
10302Sisaket2006White, Flat, Densely+BMT126185
10459Lampang2006Grey, Flat, Densely++++CMT126186
10551Nakhon Ratchasima2006White, Flat, Densely++++CMT126187
10552Nakhon Ratchasima2006White, Fluffy, Densely+CMT126188
10576Kalasin2006Cream, Fluffy, Densely++++CMT126189
10577Nakhon Ratchasima2006White, Flat, Densely-DMT126190
10578Nakhon Ratchasima2006Cream, Flat, Densely+CMT126191
10581Nakhon Ratchasima2006White, Fluffy, Densely+++CMT126192
10652Maha Sarakham2006Cream, Fluffy, Densely+++CMT126193
10681Roi Et2006White, Flat, Densely++BMT126194
10694Nong Khai2006Cream, Flat, Densely+BMT126195
10732Kamphaeng Phet2006White, Flat, Densely-CMT126196
10760Kamphaeng Phet2006White, Fluffy, Densely-DMT126197
10812Chiang Rai2006White, Flat, Densely-DMT126198
10837Surin2006White, Flat, Densely++BMT126199
10873Mae Hong Son2006Cream, Fluffy, Highly dense++CMT126200
10926Phayao2006White, Flat, Densely-CMT126201
10927Phayao2006White, Flat, Densely-CMT126202
10941Lampang2006White, Flat, Densely-CMT126203
10971Nan2006White, Flat, Densely-CMT126204
10985Sisaket2006Cream, Flat, Densely+CMT126205
10993Buriram2006White, Fluffy, Densely+CMT126206
11100Udon Thani2006White, Fluffy, Densely+CMT126207
11108Ubon Ratchathani2006White, Flat, Densely++++CMT126208
11109Ubon Ratchathani2006Cream, Fluffy, Densely+CMT126209
BAG1.2Phitsanulok2006White, Fluffy, Densely+CMT126210
BAG4.6Phitsanulok2006White, Flat, Densely+++DMT126211
40.3n/an/aGrey, Fluffy, Densely++CMT126212
SRN54001Surin2011White, Flat, Densely+++DMT126213
SRN54002Surin2011White, Fluffy, Densely++DMT126214
SRN54005Surin2011White, Flat, Densely++DMT126215
SRN54006Surin2011White, Fluffy, Densely++CMT126216
SRN54007Surin2011Cream, Flat, Densely++++CMT126217
SRN54009Surin2011White, Flat, Densely+++CMT126218
CCO56001Chachoengsao2013Cream, Fluffy, Densely++CMT126219
CCO56002Chachoengsao2013White, Flat, Densely++CMT126220
CCO56003Chachoengsao2013Cream, Fluffy, Densely++++CMT126221
CCO56004Chachoengsao2013White, Fluffy, Densely+CMT126222
CPM55001Chaiyaphum2012Cream, Flat, Densely+CMT126223
CPM55002Chaiyaphum2012Grey, Flat, Densely++++CMT126224
CPM55003Chaiyaphum2012White, Fluffy, Densely++++CMT126225
NYK55001Nakhon Nayok2011Grey, Flat, Densely++CMT126226
BKK55001Bangkok2011White, Fluffy, Densely+++CMT126227
BKK55002Bangkok2011White, Flat, Densely+DMT126228
BKK55003Bangkok2011Grey, Fluffy, Densely+++CMT126229
RBR55001Ratchaburi2011Cream, Fluffy, Highly dense++++AMT126230
RBR55002Ratchaburi2011White, Flat, Densely-CMT126231
RBR55003Ratchaburi2011White, Fluffy, Densely++CMT126232
B1-2Ubon Ratchathani2001White, Fluffy, Densely++++CMT126233
TH196031Ubon Ratchathani2001White, Fluffy, Densely++CMT126234
TH196036Ubon Ratchathani2001White, Fluffy, Densely++CMT126235
TRG1Nong Khai2013Grey, Fluffy, Densely+CMT126236
TRG2Nong Khai2013White, Flat, Densely-CMT126237
TRG3Nong Khai2013Grey, Fluffy, Densely++CMT126238
TRG4Nong Khai2013Cream, Flat, Densely-CMT126239
70-15Laboratory strain1988Grey, Flat, Densely-CMT126240
Guy11French Guyana1988Grey, Fluffy, Densely-CMT126241
(a) Name of Thai province or the origin of blast sampling. (b) Fungal mycelia characteristics on rice flour agar (RFA), including color and mycelial appearance. (c) Melanin pigment production was observed at the ventral view of the culturing plate, scoring is as follows: No melanin pigment (-), melanin pigment production in less than 20% of the mycelia area (+), melanin production in 20%–50% of the mycelia area (++), melanin production in 50%–80% of the mycelia area (+++), and melanin production in more than 80% of the mycelia area (++++). (d) Conidial structure under light microscope. (e) GenBank accession number. A: Oval conidia, B: Short pyriform conidia, C: Pyriform conidia, and D: Long pyriform conidia.
Table 2. Polymorphism in 59 rice blast strains revealed by inter-simple sequence repeat (ISSR) primers.
Primer IDPrimer Name (a)Total BandsPolymorphic Bands% PolymorphicPIC (b)
ISSR1UBC-80712433.330.39
ISSR2UBC-80814857.140.15
ISSR3UBC-8098225.000.49
ISSR4UBC-8118337.500.16
ISSR5UBC-81211436.360.49
ISSR6UBC-81333100.00.49
ISSR7UBC-8140
ISSR8UBC-8150
ISSR9UBC-8176233.330.26
ISSR10UBC-8185120.000.38
ISSR11UBC-8200
ISSR12UBC-82322100.00.32
ISSR13UBC-8240
ISSR14UBC-8258450.000.50
ISSR15UBC-82610990.000.50
ISSR16UBC-8270
ISSR17UBC-841161487.500.50
ISSR18UBC-8474125.000.07
ISSR19UBC-84811545.450.33
ISSR20UBC-8490
Total11862
Average8.434.4352.900.36
(a) ISSR primers set from the University of British Columbia (Microsatellite UBC primer set 9, University of British Columbia, Vancouver, Canada). (b) The polymorphism information content (PIC) value was used to measure the informativeness of a genetic marker. Grey rows of the table denote primers that were unable to amplify the blast fungal genome.
Table 3. Polymorphism in 59 rice blast strains revealed by sequence-related amplified polymorphism (SRAP) primer combinations.
Primer IDPrimer Names (a)Total BandsPolymorphic Bands% PolymorphicPIC (b)
SRAP1me1/em15480.000.50
SRAP2me1/em20
SRAP3me1/em355100.00.49
SRAP4me1/em40
SRAP5me1/em59666.670.47
SRAP6me1/em610550.000.50
SRAP7me2/em10
SRAP8me2/em211436.360.50
SRAP9me2/em30
SRAP10me2/em414642.860.48
SRAP11me2/em511100.00.32
SRAP12me2/em69333.330.40
SRAP13me3/em16583.330.37
SRAP14me3/em26466.670.49
SRAP15me3/em36583.330.44
SRAP16me3/em43266.670.41
SRAP17me3/em50
SRAP18me3/em66466.670.38
SRAP19me4/em122100.00.39
SRAP20me4/em25120.000.03
SRAP21me4/em30
SRAP22me4/em40
SRAP23me4/em50
SRAP24me4/em622100.00.50
SRAP25me5/em10
SRAP26me5/em20
SRAP27me5/em30
SRAP28me5/em411100.00.34
SRAP29me5/em52150.000.03
SRAP30me5/em60
Total10361
Average5.723.3969.220.39
(a) SRAP markers were designed by Li and Quiros in 2001 to specifically amplify coding regions of genomes by targeting GC-rich exon regions (forward primers, named as me) and AT-rich intron regions (reverse primers, named as em). (b) The polymorphism information content (PIC) value was used to measure the informativeness of a genetic marker. Grey rows of the table denote primers that were unable to amplify the blast fungal genome.

