Article

Pyricularia’s Capability of Infecting Different Grasses in Two Regions of Mexico

by
Ivan Sequera-Grappin
1,
Elsa Ventura-Zapata
2,
Erika Alicia De la Cruz-Arguijo
1,
Claudia Patricia Larralde-Corona
1 and
Jose Alberto Narváez-Zapata
1,*
1
Instituto Politécnico Nacional, Centro de Biotecnología Genómica, Blvd. del Maestro S/N Esq. Elías Piña. Col. Narciso Mendoza, Reynosa C.P. 88700, Tamaulipas, Mexico
2
Instituto Politécnico Nacional, Centro de Desarrollo de Productos Bióticos, Ctra. Yautepec-Jojutla, Km.6, calle CEPROBI No. 8, Col. San Isidro, Yautepec C.P. 62731, Morelos, Mexico
*
Author to whom correspondence should be addressed.
J. Fungi 2023, 9(11), 1055; https://doi.org/10.3390/jof9111055
Submission received: 31 August 2023 / Revised: 14 October 2023 / Accepted: 18 October 2023 / Published: 27 October 2023

Abstract

:
The genus Pyricularia includes species that are phytopathogenic fungi, which infect different species of Poaceae, such as rice and sorghum. However, few isolates have been genetically characterized in North America. The current study addresses this lack of information by characterizing an additional 57 strains of three grasses (Stenotaphrum secundatum, Cenchrus ciliaris and Digitaria ciliaris) from two distant regions of Mexico. A Pyricularia dataset with ITS sequences retrieved from GenBank and the studied sequences were used to build a haplotype network that allowed us to identify a few redundant haplotypes highly related to P. oryzae species. An analysis considering only the Mexican sequences allowed us to identify non-redundant haplotypes in the isolates of C. ciliaris and D. ciliaris, with a high identity with P. pennisetigena. The Pot2-TIR genomic fingerprinting technique resulted in high variability and allowed for the isolates to be grouped according to their host grass, whilst the ERIC-PCR technique was able to separate the isolates according to their host grass and their region of collection. Representative isolates from different host grasses were chosen to explore the pathogenic potential of these isolates. The selected isolates showed a differential pathogenic profile. Cross-infection with representative isolates from S. secundatum and C. ciliaris showed that these were unable to infect D. ciliaris grass and that the DY1 isolate from D. ciliaris was only able to infect its host grass. The results support the identification of pathogenic strains of Pyricularia isolates and their cross-infection potential in different grasses surrounding important crops in Mexico.

1. Introduction

Pyricularia species, particularly P. oryzae (the teleomorph of Magnaporthe oryzae), cause gray leaf spot (GLS) disease in more than fifty species of Poaceae, including in economically and agriculturally important crops, such as sorghum (Sorghum bicolor) and rice (Oryza sativa), and in grasses surrounding crop fields [1]. In Mexico, there have been reports of GLS on rice and on buffel grass (Cenchrus ciliaris) and Digitaria ciliaris [2,3,4]. More broadly, in the Americas, diverse Pyricularia isolates have been reported to infect Stenotaphrum secundatum grass [5], Cenchrus grass [6], Festuca arundinacea Shreb. [7] and Hakonechloa macra (Japanese forest grass) [8]. P. oryzae has a broad host range (Poaceae), which may allow pathogens to shift to rice and neighboring plants [1]. The cross-infectivity of isolates from rice and other Poaceae species implies that host shifts in P. oryzae and related species may occur in rice and other plants surrounding rice fields [9,10]. Thus, host divergence can increase the genomic complexity of isolates [10]. In addition, the expansion of P. oryzae and its host shifting have been widely reported and may be implicated in GLS outbreaks in important crops [1]. Therefore, Pyricularia strain characterization in grasses might also be important to prevent future outbreaks of GLS disease in crops.
Pyricularia species are difficult to control due to the complex diversity and wide geographic distribution of their isolates [11], and this problem has also been observed in isolates with different phenotypic profiles [12], locations of collection [13] and crop varieties [14]. Different studies have related genetic variability to the pathogenic profile for Pyricularia isolates [9,15,16]. Genetic variation may be caused by a high copy number of transposons, such as Pot2-TIR, which is often used in P. oryzae strain analyses [17], or by randomly dispersed and non-repetitive ERIC regions [18], which have also been useful in assessing genetic diversity in fungal species [18,19].
In Mexico, there are no reports on the genetic variability or the potential of cross-infection of Pyricularia strains in grasses surrounding crops. Therefore, the objective of this study was to isolate and characterize Pyricularia isolates infecting different grasses (S. secundatum, C. ciliaris and D. ciliaris) in localities surrounding sorghum and rice fields in Mexico.

2. Materials and Methods

2.1. Fungal Isolation and General Characterization

Isolates were obtained from infected leaf tissues of S. secundatum, C. ciliaris and D. ciliaris. Host identification was undertaken according to the hosts’ morphologic characteristics, using the web catalogue of Mexican weeds provided by CONABIO (http://www.conabio.gob.mx/malezasdemexico/2inicio/home-malezas-mexico.htm, accessed on 10 October 2023). Sampling was conducted in four localities in two Mexican states (Morelos and Tamaulipas), in which the pathogens considered in this study cause persistent infections in the hosts mentioned above. These Mexican states have different environmental conditions and are geographically distant from each other (~1000 km). The sampling sites were Yautepec (Morelos; 18.51 N-99.04 W), with an altitude of 1210 m; Zacatepec (Morelos; 18.39 N-99.11 W), with an altitude of 917 m; Oacalco (Morelos; 18.92 N-99.03 W), with an altitude of 1243 m; and Reynosa (Tamaulipas; 25.58 N-98.16 W), with an altitude of 33 m. These locations were selected because they are mainly agricultural, with rice being the main crop in the Morelos locations and sorghum being the main crop in the Tamaulipas location.
Plant samples associated with the main crops in the regions mentioned above and that showed disease symptoms were collected at a separation distance of at least 100 m. Immediately after collection, small pieces (≈0.5 cm × 0.5 cm) were cut from the infected tissue close to the damaged areas. The pieces were submerged for 10 min in a solution of 0.1% NaClO for surface sterilization, rinsed three times with distilled water and attached via surface tension to the lids of Petri dishes (50 mm) containing a water agar medium (2% w/v). The plates were incubated at 28 °C ± 1 °C in darkness for 24–48 h. Mycelia growing on the cut pieces were observed through an optical microscope for conidia identification. The plates with abundant conidia formation were gently stirred to release the spores and place them over the medium. The lids were changed for new sterile ones and the plates were incubated under the same conditions mentioned above for 3 days.
A microscopic inspection was conducted to identify non-grouped conidia on the medium surface and the surrounding area was labeled on the Petri lids. Agar plugs containing this area were transferred to a potato dextrose agar medium (PDA, Difco, Becton Dickinson and Co., Holdrege, NE, USA) and incubated for 7 days. The cultures were then sub-cultivated in a V8 agar medium and incubated for 2 weeks under the same conditions mentioned above. Plugs of 5 mm diameter containing mycelia and conidia were placed in 2 mL cryogenic vials containing 1 mL of glycerol solution 10% (v/v). The vials were stored at −20 °C. Morphological structures (conidia morphology, color and septa number) were documented using fluorescent microscopy with 40× and 100× zooms (Olympus BX-51; Olympus, Life Science Research, Baltimore, MD, USA). Image-Pro Express software package ver. 6.3 (Media Cybernetics, Silver Spring, MD, USA) was used for phenotypic (qualitative) assessment and average size (quantitative) evaluation. Isolates were labeled according to their host and location.
Mating type characterization was conducted by using the primer sets MAT1-1 and MAT1-2 reported in [20]. PCR was performed in a total volume of 25 µL. The reaction consisted of 50 ng of genomic DNA, obtained as described below; 200 mM of each primer; 0.8 mM dNTPs (Bioline, Memphis, TN, USA); 1X PCR buffer (Bioline, Memphis, TN, USA); 1.5 mM MgCl2 (Bioline, Memphis, TN, USA); and 1U of Taq DNA polymerase (Bioline, Memphis, TN, USA). The PCR conditions consisted of initial denaturation for 5 min at 95 °C, 35 cycles of 30 s of denaturation at 95 °C, 30 s of annealing primers at 54 °C, 1 min of extension at 72 °C and, finally, an extension at 72 °C for 7 min. The PCR products were separated via electrophoresis in an agarose gel (1% w/v), and they were visualized using SYBR Green (Invitrogen, Waltham, MA, USA).
The fertility status of these isolates was also assayed by pairing them with opposite mating-type strains on oatmeal agar plates, with two mycelium plugs (0.5 cm) placed on opposite sides for 4 weeks under environmental conditions. Compatibility was assessed by searching for the presence of reproductive structures (perithecia) under a microscope, as described above.

2.2. ITS Amplification and Sequencing Analysis

Isolated strains were cultured in Petri dishes (9 cm diameter) containing PDA (Difco, Becton Dickinson and Co., Holdrege, NE, USA) at 28 °C ± 1 °C for 7 d. DNA was extracted in 1.5 µL tubes according to the CTAB protocol described in [21]. Each DNA sample was quantified using a spectrophotometer (NanoDrop 2000; Fisher Scientific Inc., Carthage, MO, USA). ITS amplification was conducted on a thermocycler (2720 Thermal Cycler; Applied Biosystems, Waltham, MA, USA) with the universal primers ITS1 (5′ TCCGTAGGTGAACCTGCGG 3′) and ITS4 (5′ TCCTCCGCTTATTGATATGC 3′) [22]. PCR was performed in a total volume of 25 µL. The reaction consisted of 50 ng of genomic DNA, 200 mM of each primer, 0.8 mM dNTPs (Bioline, Memphis, TN, USA), 1X PCR buffer (Bioline, Memphis, TN, USA), 1.5 mM MgCl2 (Bioline, Memphis, TN, USA) and 1U of Taq DNA polymerase (Bioline, Memphis, TN, USA). The PCR conditions consisted of initial denaturation for 5 min at 94 °C, 35 cycles of 30 s of denaturation at 94 °C, 30 s of annealing primers, 1 min of extension at 72 °C and, finally, an extension at 72 °C for 7 min.
The PCR products were separated via electrophoresis in 1% (w/v) agarose and visualized using SYBR Gold (Invitrogen, Waltham, MA, USA). The PCR products were purified with a kit according to the manufacturer’s protocol (BioRad, Hercules, CA, USA). After purification, the PCR products were directly sequenced using both original primers. Sequencing was conducted by Macrogen Inc. (Seoul, Republic of Korea). A Blastn analysis was conducted on all sequences obtained. Nucleotide sequences were deposited in the GenBank database, as summarized in Table 1.

2.3. Haplotype Network Analysis

All the ITS sequences from the P. oryzae strains were retrieved from GenBank by using the “refdb” packages in Rstudio ver. 4.3.0. Sequences without longitude/latitude data were removed from the dataset to assign localization to all accessions. The database was updated with the sequences of this study and manually revised to avoid entry mistakes (Table S1). Hotspots of the isolations were visualized in Rstudio by using the “ggplot2 ver. 3.4.2”, “sf ver. 1.0-14” and “spData ver. 2.3.0” packages. Then, the “Biostrings ver. 2.68.1” and “ape ver. 5.7-1” packages were used to obtain and write the fasta sequences of the final database. These fasta sequences were used to build a Clustalw alignment by using the “msa ver. 1.32.0” package. Trimming was conducted on sequence alignments to avoid sequence termination mistakes in all sequences analyzed. The trimmed ITS region had a length of 416 bp, which was localized, according to the reference P. oryzae (MT757299; MoK19-32) strain, between 87 bp and 503 bp. Then, the “haplotypes ver. 1.1.3.1” and “pegas ver. 1.2” packages were used to build a haplotype network analysis in Rstudio ver. 4.3.0. To simplify the haplotype links on the map, a threshold of 55–60 was selected.

2.4. Genomic Fingerprinting

Two methods were used for genome-wide characterization. First, Pot2-TIR amplifications were performed in a final volume of 25 µL. The Pot2.TIR profile was generated according to [23], using a single external primer: Pot2-TIR (5′ ACAGGGGGTACGCAACGTTA 3′). Second, ERIC-PCR amplification was conducted according to the method developed in [18], with the primers ERIC1R (5′ ATGTAAGCTCCTGGGGATTCAC 3′) and ERIC2I (5′ AAGTAAGTGACTGGGGTGAGCG 3′). For each reaction, the following were added: 50 ng of genomic DNA, 0.5 µM of each primer, 200 µM of dNTPs, 1× of reaction buffer, 1.5 mM of MgCl2 and 2.5 U of Taq polymerase. PCR conditions were initial denaturation for 5 min at 94 °C, 35 cycles of 30 s of denaturation at 94 °C, 1 min of annealing at 58 °C (Pot2-TIR)/49 °C (ERIC-PCR), 4 min of extension at 65 °C and a final extension for 7 min at 72 °C. PCR fingerprints were analyzed in 2% agarose gels, stained with SYBR Gold (Invitrogen, Waltham, MA, USA) and run in 0.5% TBE buffer (89 Mm Tris pH 7.8, 89 Mm boric acid, 2 Mm EDTA) at 80 V for 6 h and 4 h for Pot2-TIR and ERIC-PCR, respectively. Polymorphic profiles were visualized with UV light. Genetic similarity among isolates was determined using a score given for the presence (1) or absence (0) of bands of a particular molecular weight. A binary matrix was made for each fingerprinting marker. A cluster analysis conducted using complete-linkage clustering was performed using the UPGMA algorithm in Rstudio ver. 4.3.0 [24]. Experiments were conducted in triplicate.

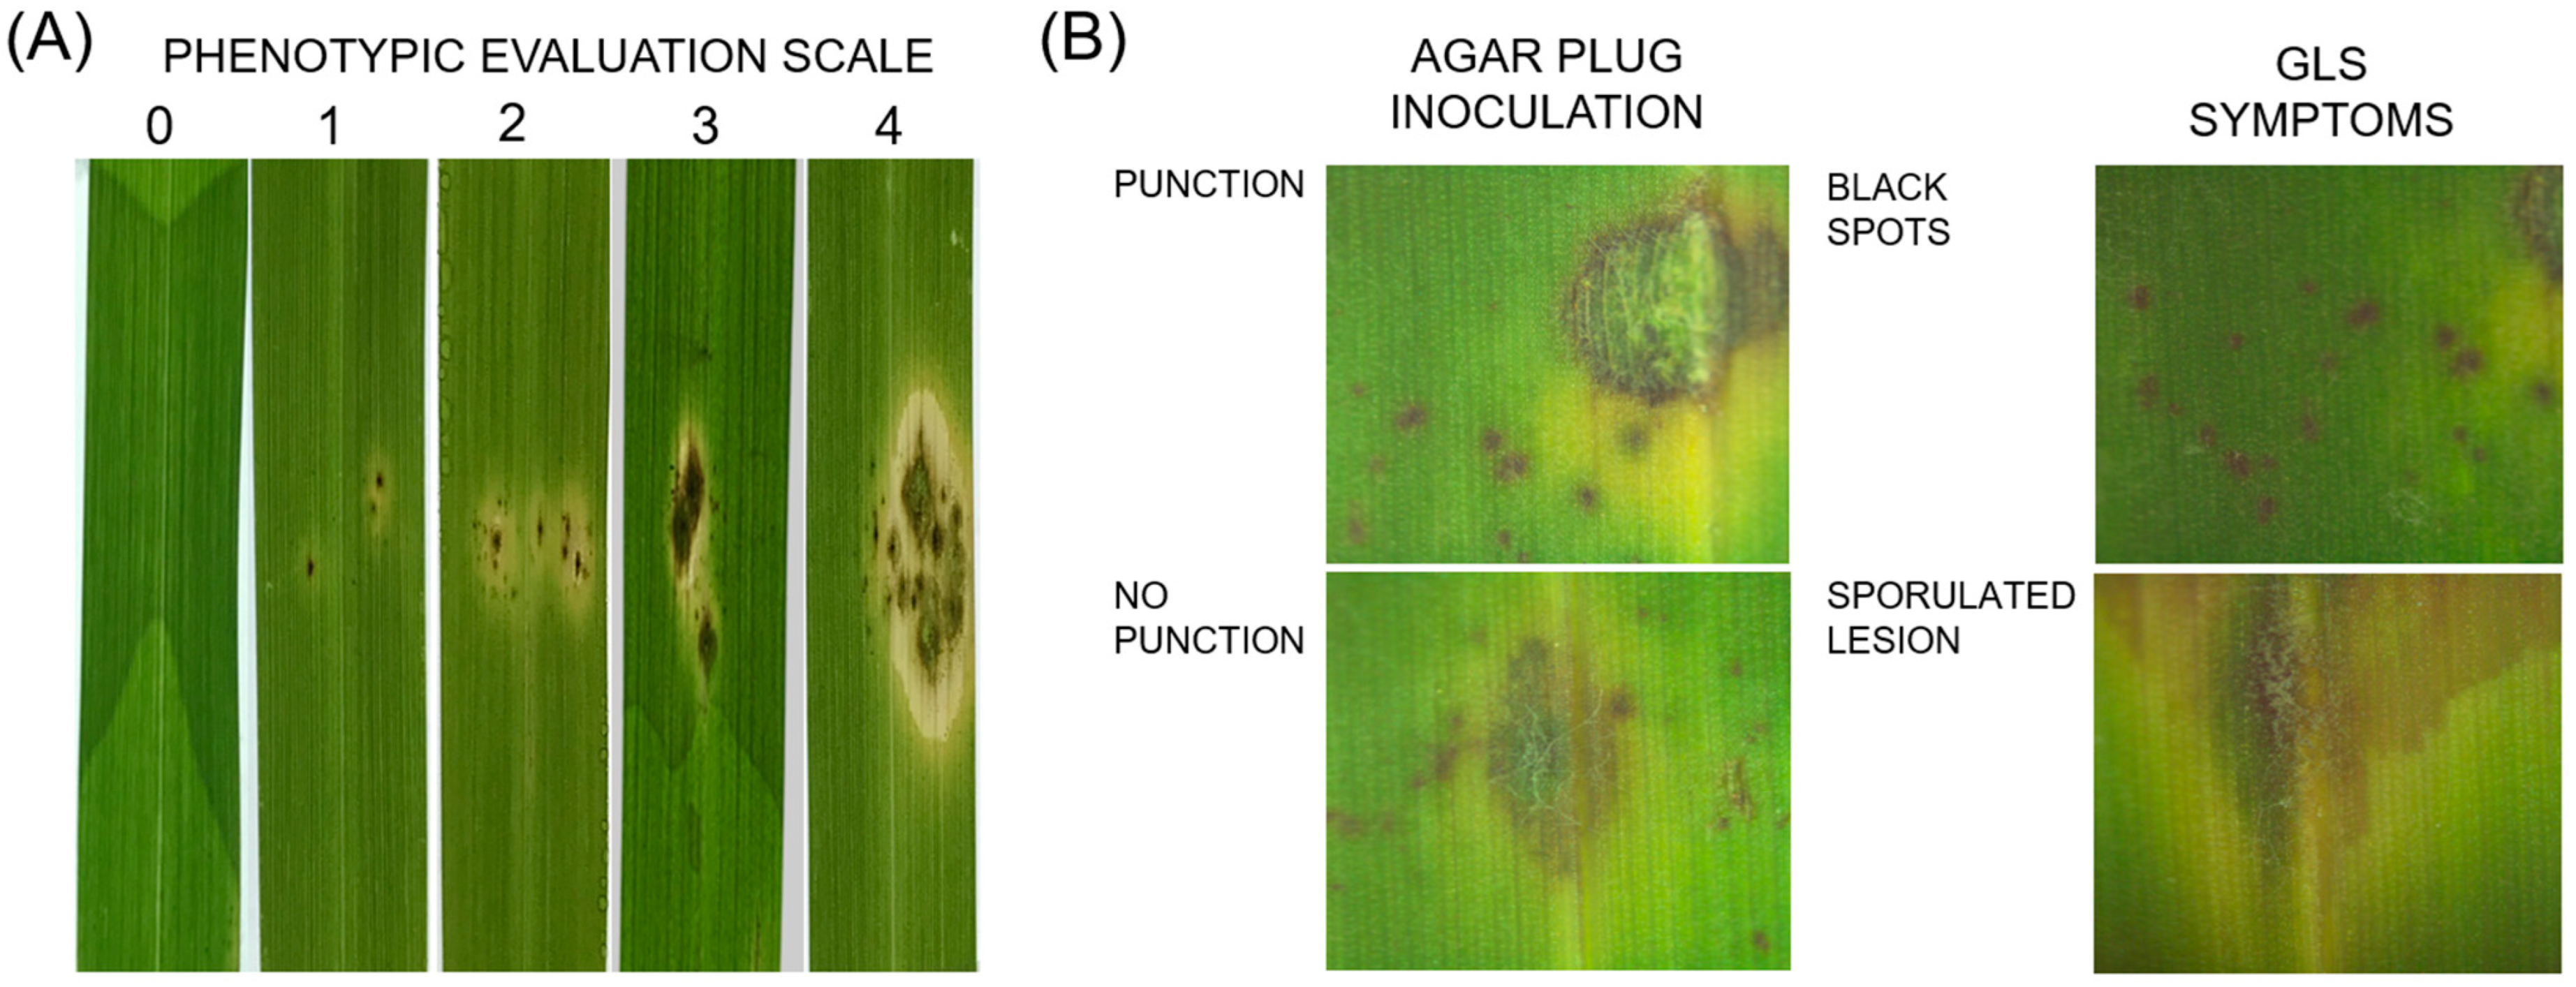
2.5. Infection Assay Using Spot Inoculation

Fungal isolates were grown on a water agar medium (2% agar; w/v). The isolates were incubated at 28 °C ± 1 °C for approximately one month before inoculation. A pathogenicity assay was conducted on the leaves of S. secundatum. This grass was selected to set up the pathogenic assay since it occurs in all study locations. S. secundatum plants collected in Yautepec (Morelos) were grown at temperatures of 28 °C to 30 °C for 30 days in pots containing peat moss, compost and perlite at a ratio of 40:40:20. The plants were periodically irrigated with half-strength Hoagland solution. The plants were propagated by short, branched rhizomes.
Pathogenicity assays were conducted as follows: Leaf segments of 5 cm were disinfected with 0.1% NaClO for 10 min, rinsed 3 times with distilled water and dried with sterile paper. Each leaf segment was placed on a glass microscope slide (2.5 cm × 8 cm) and the ends of the leaf segment were attached to the slide with tape. The microscopy slides with the leaf tissues were placed in Petri dishes of 9 cm containing water agar (2% w/v) supplemented with chloramphenicol (400 mg/L) and cycloheximide (400 mg/L). Undamaged leaf segments were inoculated by placing 5 mm diameter plugs in their centers, obtained from the water agar inoculum plates containing mycelium and conidia (20–30 conidiophores/plug).
To compare the infection capabilities of the fungal isolates on already damaged foliar tissue, the same method as mentioned above was used, but by damaging the leaf surface via punction [16]. Using a sterile pipette, a spot (≈1 mm of diameter) was crushed in the center of S. secundatum grass segments, pressing just enough to injure the tissue without punching out a hole. Finally, medium plugs containing mycelia were placed on the punched areas, as mentioned above. Plates were placed at 25 °C ± 1 °C for 7 d under short-day conditions (8 h light/16 h dark). The percentage of foliar damage area was analyzed using Image J ver. 1.53e software with the default RGB threshold color settings (≈45, 45, 0). A rating scale was developed for an evaluation of the damage based on previous studies performed on rice detached leaves [25] and on Italian ryegrass (Lolium multiflorum Lam.) [26]. These methods use a damage score from zero to four according to the specific type of lesion. Four lesion scales, according to the extent of the damaged area, were applied. A detailed description is given in the Results Section. For each treatment, five replicates were performed.

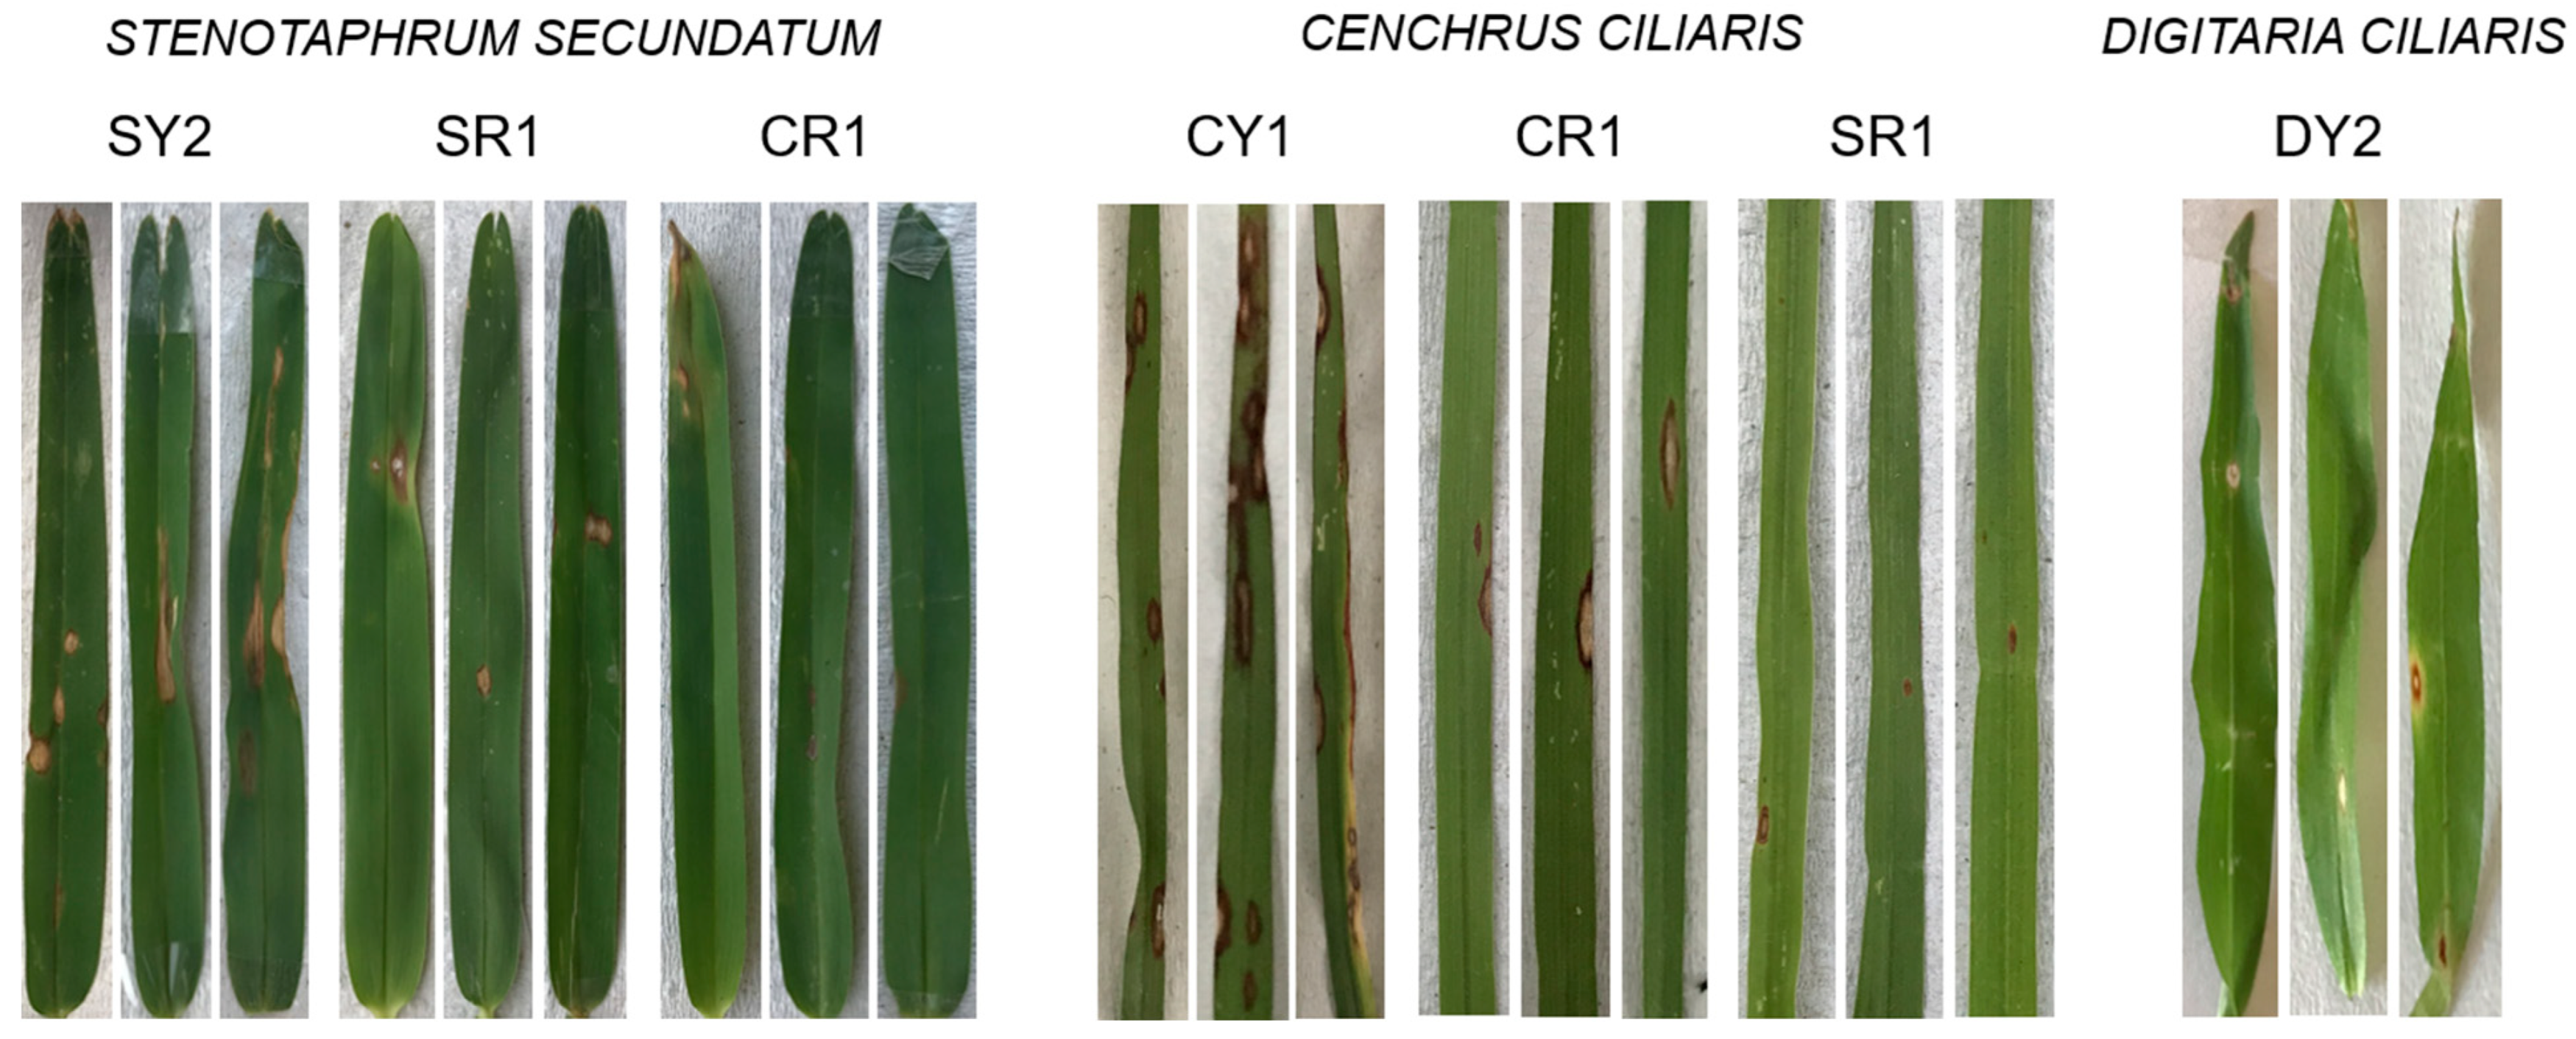
2.6. Cross-Infectivity Assay

Representative fungal isolates were inoculated on three grass species (C. ciliaris, D. ciliaris and S. secundatum). These are wild grasses susceptible to Pyricularia infection that grow in the same regions where sorghum and rice are cultivated in Mexico. S. secundatum grass was obtained from all study locations. C. ciliaris grass was obtained from the locations of Yautepec (Morelos) and Reynosa (Tamaulipas). D. ciliaris was only obtained from the Yautepec (Morelos) location. The grasses were morphologically identified by using the CONABIO web catalogue (http://www.conabio.gob.mx/malezasdemexico/2inicio/home-malezas-mexico.htm, accessed on 10 October 2023). The grasses were grown at temperatures of 28 °C to 30 °C for 30 days in pots containing peat moss, compost and perlite at a ratio of 40:40:20. The plants were periodically irrigated with half-strength Hoagland solution. Experiments were performed in triplicate, and a water control was included. Sporulation was induced in a V8 agar medium via incubation for 20 days with light and dark cycles of 12 h at 28 °C. A spore suspension (1 × 10⁵ spores/mL) was prepared with 0.02% and 0.25% Tween 20 (Fisher Scientific, Carthage, MO, USA) and gelatin (Duche, CDMX, Mexico), respectively [25]. The leaves were inoculated with 30 mL of a conidial suspension using an airbrush. The plants were immediately covered with dark plastic bags at 28 °C for 48 h. Then, the plants were exposed to light and dark cycles of 12 h at 28 °C for 7 days. Disease occurrence was photographically recorded in 20 complete leaves with evident disease symptoms. The percentages of foliar damage area were analyzed using Image J software, as mentioned above. The scale in cm was set up by using the function “set scale” in Image J ver. 1.53e. Damage evaluation was rated on the Standardized Evaluation System for rice (SES scale) from 0 to 9, as described in [27].

2.7. Statistical Analysis

The data were analyzed using an analysis of variance (ANOVA) with a significance value of α = 0.05. A one-way ANOVA was performed on the damaged area using plug inoculation. A two-way ANOVA was performed if the punction treatment had an effect on the virulence level and infection profiles. A Tukey test (α = 0.05) was performed to determine the differences between the infection patterns. All statistical analyses were performed by using Minitab 17 software.

3. Results

3.1. Isolation and General Characterization

Fifty-seven Pyricularia isolates were collected from S. secundatum, C. ciliaris and D. ciliaris grasses in four localities in the states of Morelos and Tamaulipas. In general, the conidia obtained on PDA and V8 agar media showed a pyriform morphology, narrowed toward the tip and rounded at the base; colorless; smooth with three septa; and with an average size of 28.1 µm and 8.5 µm in length and width, respectively (Figure S1). The mating type analysis showed PCR products in the P. oryzae isolates of 809 bp and 940 bp for MAT1-1 and MAT1-2 alleles, respectively. The MAT1-1 allele was found in almost all P. oryzae isolates analyzed. Only seven isolates (SR1, SRf 1, SRf4, SRf6 SRf10, SRf11 and SRf12) collected from S. secundatum in Reynosa were MAT1-2 positive (Table 1 and Figure S2). The fertility status of these isolates according to their MAT-1 allele was examined, but no reproductive structures were found under the culture conditions evaluated. The Pyricularia isolates from C. ciliaris and D. ciliaris did not amplify when using this primer set.

3.2. ITS Sequence Analysis

A single band of around 550 bp was obtained via PCR amplification using the ITS1/ITS4 primers. These experimental sequences were added to the ITS database built with the sequences retrieved from GenBank, resulting in 427 sequences (Supplementary Table S1). The initially retrieved sequences resulted in 34,709 accessions. However, most of them had neither longitude nor latitude data in their metadata; therefore, they were discarded. The hotspot analysis allowed us to determine that the sequences of this study are the only ones submitted with localization data in North America (Figure 1A).
The high variability in the lengths of the sequences retrieved from GenBank led us to select only one trimmed region (416 bp) for the haplotype network analysis. This analysis classified some redundant haplotypes (with a haplotype diversity of 0.765) for the majority of the sequences analyzed, including most of the experimental sequences obtained in the current study, and some non-redundant haplotypes in accessions mainly from Africa (Figure 1B). Redundant haplotype 1 was found in almost all sequences collected in Mexico. However, a more detailed analysis allowed us to detect other specific haplotypes (with a haplotype diversity of 0.716) for the grasses C. ciliaris and D. ciliaris (Figure 1C). Specifically, D. ciliaris haplotypes were more varied, with diverse polymorphisms regarding the redundant haplotypes of the accessions isolated from S. secundatum. In general, the ITS sequences of the isolates of this study produced Blast identities (≥99%) with P. oryzae sequences, although a few sequences, isolated mainly from the C. ciliaris and D. ciliaris grasses, also exhibited a high identity with P. pennisetigena accessions (Table 1), and this corresponded to the non-redundant haplotypes described above (Figure 1C).

3.3. Genomic Fingerprinting

To gain more information on the genomic variability in the Pyricularia isolates collected in Mexico, two methods for genomic fingerprinting were conducted to expand the number of genomic regions of analysis. Firstly, the Pot2-TIR profiles of the Pyricularia isolates were analyzed (Figure 2A). A total of 19 polymorphic PCR products were revealed by using the Pot2-TIR primer, which ranged between 0.3 Kb and 3.5 Kb (Figure S2A). UPGMA based on Pot2-TIR profiles shows three main clades with a high height (~3), grouping the isolates according to their host grass (marked with different colors).
This analysis also grouped the isolates according to their probable identity, separating with a high height value (~2.8) the isolates identified as P. oryzae (host, S. secundatum), P. pennisetigena (host, C. ciliaris) and Pyricularia sp. (host, D. ciliaris). Interestingly, all isolates showed a clear grouping according to their host grass, supporting their differential species identities. For example, the isolates from C. ciliaris that showed a high (>99%) identity with P. pennisetigena were clearly grouped together, supporting their probable identity as P. pennisetigena, and the biases of the phylogenetic analysis can clarify the identity of this cryptic species [28]. The ITS locus in combination with the 19 polymorphic Pot2-TIR bands thus might help to support interspecies identification. The Pot2-TIR profile also showed a high variability within the isolates clearly identified (>99%) with a specific species (i.e., P. oryzae). In the current study, the P. oryzae isolates from S. secundatum showed a high variability, with seven subclades with a high (~1) height difference. These genomic differences could also be useful in distinguishing the regions of collection or associated crop agronomical conditions. These isolates spanned five subclades: two clades with isolates only from Tamaulipas (sorghum fields), two clades with isolates only from Morelos (rice fields) and one clade with P. oryzae isolates from both Mexican states. Therefore, although this analysis recognized the distance between the studied regions (~1000 km), it also showed a subclade of isolates exhibiting a probable genetic environmental adaptation to the associated grass (S. secundatum).
Genomic fingerprinting was complemented with ERIC-PCR profiles (Figure 2B and Figure S2B) as a second method. In general, this analysis showed less variability, having only 11 polymorphic PCR products. However, these were enough to more clearly separate (height ~2.2) the isolates according to the host grass, thus supporting the results previously obtained using the Pot2-TIR fingerprinting method. Interestingly, the subclades of P. oryzae (host S. secundatum) were grouped according to their MAT1 allele, and all the isolates related to Pyricularia spp. and P. pennisetigena were unable to be amplified with the MAT1 allele primers (Table 1 and Figure S2C), which suggests a probable relation between the PCR products amplified by these randomly amplified sequences and the MAT1 alleles. More efforts are necessary to clarify the relation between this non-repetitive region and the MAT1 allele.

3.4. Pathogenicity Assay

An assay was performed on the leaves of S. secundatum to classify the pathogenicity of the isolates. Contrasting P. oryzae isolates from S. secundatum were selected to conduct this assay (Table 2; Figure 3). The infection method was implemented with two different treatments: agar plug inoculation with and without the infliction of puncture damage to detached leaves. In addition, a scale of the infection response was set up, modified from [25,26], as follows: Scale 0 comprises leaves with lesions without evident symptoms. Scale 1 comprises leaves with a damaged area with a diameter of less than 2 mm, and non-sporulating and dark brown lesions. Scale 2 comprises leaves with expanding dark brown and non-sporulating lesions. Scale 3 comprises leaves with a damaged area in a diamond or small circular shape with sporulating centers. Scale 4 comprises leaves with a large damaged area and expanding irregular lesions, as well as with sporulating areas (Figure 3A).
The P. oryzae isolates produced different lesion types and extensions of damaged area according to the infection method used. The infection assay via plug inoculation showed characteristic GLS lesions, such as the extension of coalescent spots and sporulated lesions (Figure 3B). Agar plug inoculation without punch damage to the detached leaves showed a reaction that ranged across the whole scale, with SY2 being the most aggressive isolate (Table 2). However, when the inoculation was conducted with punction damage, all isolates showed a reaction classified as type 4. The damaged area also exhibited differential values according to the isolate and to the infection method assayed (Figure 3B). When the inoculation was conducted without punch damage, the Pyricularia isolates ranged between 1.6 mm2 and 76.7 mm2, with an average damaged area of 22 mm2.
The damaged area increased when the leaf was punctured, being up to 14.5 times larger than after the treatment without damage in the SY4 isolate, with a value of 73.7 mm2. In general, the damaged area had an average size of 49.6 mm2, an increase of 6.7 times. The Tukey test grouped these damaged areas into three groups, which separated these P. oryzae isolates according to their sampling location. In this last analysis, the SR1 isolate was classified into a different Tukey group (group c) with a damaged area of 42.1 mm2 (Table 2 and Table S2).
Representative Pyricularia isolates were selected to explore their pathogenic profiles by assessing their genetic variability. Genetic and genomic relations, localities with different associated crops, and the host and MAT1 allele were considered to choose these representative isolates. Thus, SY2 (P. oryzae; host, S. secundatum; Morelos state; and MAT1-1 allele), SR1 (P. oryzae; host, S. secundatum; Tamaulipas state; and MAT1-2 allele), CY1 (identified as probable P. pennisetigena; host, C. ciliaris; Morelos state; and not responsive to MAT1 allele primers), CR1 (identified as probable P. pennisetigena; host, C. ciliaris; Tamaulipas state; and not responsive to MAT1 allele primers) and DY1 (identified only as Pyricularia sp.; host, D. ciliaris; Morelos state; and not responsive to MAT1 allele primers) were selected (Table 1). In general, all isolates were able to infect their original hosts (Table 3; Figure S3). However, the infection severity was different among the isolates of locations with different associated crops (Tamaulipas or Morelos). In S. secundatum, the SY2 and SR1 isolates (P. oryzae) displayed the classic eye-shaped morphology of leaf spots, whereas the CR1 isolate showed a few lesions without visible sporulation centers and a high relative severity scale of 4 (Figure 4). In C. ciliaris, the CY1 and CR1 isolates identified as probable P. pennisetigena produced eye-shaped blight lesions and sporulation centers, whereas the SR1 isolate identified as probable P. pennisetigena presented more reduced lesions without sporulation centers and a moderate severity (scale = 3). All Pyricularia isolates from C. ciliaris and S. secundatum grasses were able to infect D. ciliaris (Table 3). At the same time, the DY1 isolate, only identified as Pyricularia spp. from D. ciliaris, was not able to infect other host grasses. On D. ciliaris, the P. pennisetigena isolate DY1 presented oval-shaped blast lesions with necrotic centers, chlorotic borders and sporulation centers (Figure 4).

4. Discussion

Fifty-seven Pyricularia isolates were collected from grasses (S. secundatum, C. ciliaris and D. ciliaris) in different locations in Mexico. Pyricularia species have been reported to infect grasses in America [5,6,8,29]. In S. secundatum grass, several Pyricularia isolates, particularly P. oryzae, have been reported to be infecting agents [5]. In Mexico, there are also reports of this species infecting buffel grass (C. ciliaris) and rice [2,3,4]. These isolates have been generally identified by mainly using ITS regions [7,8]. In the current study, ITS sequence regions were obtained and analyzed in the Pyricularia isolates of this study. These sequences were added to an ITS dataset comprising Pyricularia accessions retrieved from GenBank to visualize and compare the sequences experimentally obtained. However, when a hotspot analysis was conducted, only one isolate from Brazil and the isolates of this study were displayed. This could be due to the lack of longitude/latitude data in the metadata of most of the GenBank accessions. We initially obtained diverse accessions from Argentina, Paraguay and the USA, but they were discarded in further analyses, as they did not contain indications of their regions of collection. However, the final ITS dataset covered 427 accessions (57 from this study) worldwide, a number representative of the ITS region in P. oryzae species. A network haplotype analysis of the ITS region showed a few redundant haplotypes; this suggests a tendency to homogeneity, which is a product of concerted evolution affecting the coding or non-coding regions of rDNA, often described in a wide range of taxa, including fungi [30]. However, when the network haplotype analysis was conducted only for the experimental sequences obtained in the current study, some non-redundant haplotypes related to C. ciliaris and D. ciliaris host grasses were visualized. These sequences also had a high identity with P. pennisetigena species, particularly for the isolates from the C. ciliaris grass. Usually, the ITS gene marker is firstly used, even in a multilocus analysis, to characterize Pyricularia isolates, since it often gives enough parsimony-informative characteristics to classify Pyricularia species [31]. However, in some cases, such as the one for P. pennisetigena, it is impossible to support a clear identification since it is considered a cryptic species within the P. oryzae/grisea species complex. This is mainly due to the fact that it is morphologically indistinguishable from P. oryzae [32,33,34], and this also cannot be resolved by using phylogenetic analyses [28]. Therefore, a more detailed analysis of the genetic variability among the isolates was conducted using a combined analysis of the polymorphic bands obtained from two genomic fingerprinting analyses and an ITS analysis in combination with microsatellites markers, which is an analysis that was proven to be useful in exploring the population diversity in P. oryzae from rice crops in Vietnam [14].
A Pot2-TIR analysis, which includes repetitive transposable element regions that are randomly distributed [17], was firstly conducted. The Pot2-TIR analysis has become one of the principal markers to study the genetic structure of field isolates of Pyricularia species worldwide, although it has only been applied to this fungal species [13,15]. In our case, the Pot2-TIR profile showed a high variability among isolates. The repetitive transposable element has been found to be involved in genomic variations among P. oryzae isolates [35]. Specifically, for the P. oryzae isolates from S. secundatum, this analysis formed a group comprising isolates from distant Mexican regions with different associated crops, and it had subclades with isolates specific to the state of Tamaulipas (associated with sorghum crops) or Morelos (associated with rice crops), suggesting a probable genetic adaptation to specific environmental regions, as the regions are distant (~1000 km) and exhibit different associated crops. The transposable Pot2-TIR element remains stable among different Pyricularia populations [36], and its copy number is modified by environmental changes or high geographical distances [35]. In general, the Pot2-TIR profile clearly separates isolates from different grasses and probably different Pyricularia species.
The C. ciliaris isolates, highly related to P. pennisetigena species, were clearly grouped by this analysis. The Cenchrus genus has been described as a host grass for this Pyricularia species [33]. To the best of our knowledge, there are no reports on the Pot2-TIR profiles of P. pennisetigena isolates. However, there are reports where the genetic flow between this species and the P. oryzae population has been demonstrated by using specific genes [28], a multilocus analysis [37] or comparative genomic analyses [38]. The authors of this last study observed a high proportion of LTR (12.6%) in the cryptic P. pennisetigena in relation to P. oryzae (<5%), which is relevant to the Pot2-TIR analysis, since transposable elements are located in LTR regions [23], and this probably explains why the application of this type of analysis might contribute to separating the cryptic P. pennisetigena from P. oryzae. Finally, the Pyricularia isolates from D. ciliaris could only be identified as Pyricularia sp. based on their ITS region, since they showed a clear difference with respect to other Pyricularia isolates.
Genomic fingerprinting was also conducted with ERIC-PCR profiles, which amplify randomly dispersed and non-repetitive regions on fungal genomes [18]. Therefore, a differential PCR profile aggrupation should be expected. In this study, ERIC-PCR showed less variability than Pot2-TIR, but it was useful to more clearly separate the isolates according to their host grass. This method also allowed us to separate the isolates according to their region of collection. Previously, this method has also been useful in separating P. grisea isolates in rice and weeds in Iran [39], and it has been used to assess the genetic diversity in fungal species [18,19]. Interestingly, ERIC-PCR was able to separate the P. oryzae isolates according to their MAT1 allele. P. oryzae isolates share morphological characters, a low frequency of MAT1-2 alleles and do not show reproductive structures. A low MAT1-2 frequency and a lack of sexual recombination have also been observed for Pyricularia isolates from St. Augustine grass in different USA localities [40]. To the best of our knowledge, this is the first report of a relation between ERIC-PCR profiling and MAT1 allele distribution in P. oryzae isolates, although more research is necessary to explore the occurrence of randomly amplified sequences and MAT1 alleles. Taking both genomic fingerprinting analyses together, it is possible to support a high genomic diversity among the isolates of this study.
Diverse studies have related the genetic variability to the pathogenic profile in different Pyricularia isolates [15,16,17]. A spot infection analysis conducted to explore the pathogenic potential in these isolates was performed via agar plug inoculation, without punch damage to S. secundatum leaves. This analysis showed different infection profiles according to the proposed infection scale. GLS disease lesions have been well characterized in S. secundatum as brown spots with gray centers that can later expand across the entire leaf [41]. The differences were clearer when the damaged area was evaluated. Phenotypic assessments such as infection assays are the main types of analysis performed to assess the compatibility among host–pathogen and virulence [8,14]. However, artificial inoculation has been reported only in a few Pyricularia hosts [25,26]. Similar to this study, [42] evaluated some of these methods using 13 rice genotypes, and they found that the spot and filter paper inoculation methods were successful in discerning susceptibility to rice blast disease. In our study, the spot treatment with punction damage was, on average, 6.7 times more aggressive than that without punction, which might be related to the more effective induction of necrosis on the detached leaves analyzed, probably as a consequence of the mechanism of fungal infection in the plant tissues, which occurs through previous physical damage [43,44]. Additionally, we also evaluated the airbrush infection on detached leaves for representative Pyricularia isolates from S. secundatum. The results for the SY2 and SR1 isolates support their pathogenic profile, as previously observed with the spot infection assay. Airbrush infection was also used in a cross-infection assay with representative isolates from the C. ciliaris and D. ciliaris grasses obtained from the same locations. This analysis confirmed that all isolates could infect their original isolation hosts, but only a few isolates were able to infect other grasses. The isolates of P. oryzae from grasses can shift to other surrounding crops, such as rice and sorghum [9,10], probably due to their wide host range (Poaceae). Therefore, further research should be conducted to evaluate this possible cross-infectivity. The Pyricularia isolate (DY1) from D. ciliaris was not able to infect other grasses, and all isolates from S. secundatum and C. ciliaris were able to infect to D. ciliaris. Previous studies have shown that, in general, isolates from S. secundatum are unable to infect D. sanguinalis (crabgrass), and vice versa [6]. In general, isolates from D. sanguinalis are able to infect rice, green foxtail, common millet, barley and wheat, with variable percentages of success [1]. To the best of our knowledge, there are no reports on cross-infection between isolates from S. secundatum and C. ciliaris. These combined infection assays suggest a phenotypic variation in the studied isolates.

5. Conclusions

Fifty-seven Pyricularia isolates were isolated and characterized from infected commercial grasses S. secundatum, C. ciliaris and D. ciliaris, associated with sorghum and rice fields in two regions of Mexico. An ITS-based analysis (haplotype network) considering a dataset of ITS sequences of Pyricularia retrieved from GenBank allowed us to identify the isolates mainly as P. oryzae, which covers the redundant haplotypes, including the isolates from S. secundatum. Although a few isolates were obtained from other grasses, particularly from C. ciliaris, they were more closely related to P. pennisetigena. Genomic fingerprinting (Pot2-TIR and ERIC-PCR) showed a high variability among the isolates, which could be grouped by host grasses. Considering only the P. oryzae isolates from S. secundatum, these analyses allowed us to group them by region of collection, suggesting an adaptation process due to geographical distance. A phenotypic assessment carried out using a spot infection assay in representative Pyricularia isolates showed host switching between the isolates from S. secundatum and C. ciliaris.

Supplementary Materials

The following supporting information can be downloaded at: https://www.mdpi.com/article/10.3390/jof9111055/s1, Figure S1: Representative morphologies of Pyricularia isolates by using the SR1 isolate; Figure S2: Genomic fingerprinting and mating type analysis; Figure S3: Representative images of the cross-infection assay by means of spore spraying in S. secundatum, C. ciliaris and D. ciliaris grasses; Table S1: Dataset of the isolates of study and of the P. oryzae accession retrieved from GenBank with longitude/latitude data; Table S2: Infection response of the P. oryzae isolates (one-way ANOVA), and considering the agar-plug inoculation with or without punction damage on detached S. secundatum leaves (two-way ANOVA).

Author Contributions

Most experimental work and the initial manuscript were developed by I.S.-G. E.V.-Z. contributed with the microorganism collection and with its morphological identification. Conceptualization, J.A.N.-Z.; Funding acquisition, J.A.N.-Z.; Investigation, I.S.-G., E.V.-Z., E.A.D.l.C.-A. and J.A.N.-Z.; Methodology, I.S.-G., E.V.-Z., E.A.D.l.C.-A. and C.P.L.-C.; Validation, I.S.-G., C.P.L.-C. and J.A.N.-Z.; Writing—original draft, I.S.-G. and J.A.N.-Z.; Writing—review and editing, E.V.-Z., C.P.L.-C. and J.A.N.-Z. All authors have read and agreed to the published version of the manuscript.

Funding

This study was supported by the Instituto Politécnico Nacional (SIP-IPN), projects 2023-0790, -1440 and -2851.

Institutional Review Board Statement

Not applicable.

Informed Consent Statement

Not applicable.

Data Availability Statement

All data are available in the manuscript and in the Supplementary Information.

Conflicts of Interest

The authors declare no conflict of interest.

References

  1. Chung, H.; Goh, J.; Han, S.S.; Roh, J.H.; Kim, Y.; Heu, S.; Shim, H.K.; Jeong, D.G.; Kang, I.J.; Yang, J.W. Comparative pathogenicity and host ranges of Magnaporthe oryzae and related species. Plant Pathol. J. 2020, 36, 305–313. [Google Scholar] [CrossRef] [PubMed]
  2. Díaz-Franco, A.; Méndez-Rodríguez, A.; Garza-Cedillo, R. Tizón foliar del pasto buffel: Su presencia en Tamaulipas; México. Agric. Téc. Méx. 2007, 33, 285–295. [Google Scholar]
  3. Hernández-Arenas, M.G.; Barrios-Gómez, E.J.; Hernández-Aragón, L.; Berriozabal-Onofre, A. Plagas y Enfermedades del Arroz Cultivado en Morelos, 1st ed.; México, D.F., Ed.; Instituto Nacional de Investigaciones Forestales: Mexico City, Mexico, 2013.
  4. Ibarra, F.A.; Martin, M.; Moreno, S.; Ibarra, F.A.; Retes, R. Impacto económico asociado con los daños del tizón foliar en la producción de semilla del zacate Buffel en el centro de Sonora; México. Rev. Mex. Agronegocios 2019, 45, 313–323. [Google Scholar]
  5. Tredway, L.P.; Stevenson, K.L.; Burpee, L.L. Genetic structure of Magnaporthe grisea populations associated with St. Augustine grass and tall fescue in Georgia. Phytopathology 2005, 95, 463–471. [Google Scholar] [CrossRef]
  6. Cazal-Martínez, C.C.; Reyes-Caballero, Y.M.; Chávez, A.; Pérez-Estigarribia, P.E.; Rojas, A.; Arrua, A.; Moura-Mendes, J.; Lopez-Nicora, H.D.; Kohli, M.M. First report of a leaf blight caused by Pyricularia pennisetigena on Cenchrus echinatus in Paraguay. Plant Dis. 2021, 105, 3758. [Google Scholar] [CrossRef] [PubMed]
  7. Russell, T.R.; Kaminski, J.E.; Dernoeden, P.H. First report of Magnaporthe oryzae causing Gray Leaf Spot on tall fescue in Delaware and Maryland. Plant Dis. 2019, 103, 2966. [Google Scholar] [CrossRef]
  8. Farinas, C.; Villari, C.; Martin, D.; Taylor, N.J.; Wayne, E.C.; Peduto, H.F. Magnaporthe oryzae perennial ryegrass pathotype causes leaf spots and blight on japanese forest grass in ohio. Plant Dis. 2017, 101, 507. [Google Scholar] [CrossRef]
  9. Choi, J.; Park, S.Y.; Kim, B.R.; Roh, J.H.; Oh, I.S.; Han, S.S.; Lee, Y.H. Comparative analysis of pathogenicity and phylogenetic relationship in Magnaporthe grisea species complex. PLoS ONE 2013, 8, e57196. [Google Scholar] [CrossRef]
  10. Zhong, Z.; Norvienyeku, J.; Chen, M.; Bao, J.; Lin, L.; Chen, L.; Lin, Y.; Wu, X.; Cai, Z.; Zhang, Q.; et al. Directional selection from host plants is a major force driving host specificity in Magnaporthe species. Sci. Rep. 2016, 6, 25591. [Google Scholar] [CrossRef]
  11. Fang, X.; Snell, P.; Barbetti, M.J.; Lanoiselet, V. Rice varieties with resistance to multiple races of Magnaporthe oryzae offer opportunities to manage rice blast in Australia. Ann. Appl. Biol. 2017, 170, 160–169. [Google Scholar] [CrossRef]
  12. Mutiga, S.K.; Rotich, F.; Ganeshan, V.D.; Mwongera, D.T.; Mgonja, E.M.; Were, V.M.; Harvey, J.W.; Zhou, B.; Wasilwa, L.; Feng, C.; et al. Assessment of the virulence spectrum and its association with genetic diversity in Magnaporthe oryzae populations from sub-saharan Africa. Phytopathology 2017, 107, 852–863. [Google Scholar] [CrossRef]
  13. Imam, J.; Alam, S.; Mandal, N.P.; Maiti, D.; Variar, M.; Shukla, P. Molecular diversity and mating type distribution of the rice blast pathogen Magnaporthe oryzae in North-East and Eastern India. Indian J. Microbiol. 2014, 55, 108–113. [Google Scholar] [CrossRef]
  14. Le, L.T.; Adreit, H.; Ha, L.T.; Milazzo, J.; Lebrun, M.; Tharreau, D.; Pham, X.H.; Nguyen, H.T.; Fournier, E.; Hoang, G.T. Population structure of Pyricularia oryzae on rice in Vietnam reveals diversified populations with four pandemic and two endemic clusters. Fungal Genet. Biol. 2023, 166, 103794. [Google Scholar] [CrossRef]
  15. Consolo, V.F.; Cordo, C.A.; Salerno, G.L. DNA fingerprint and pathotype diversity of Pyricularia oryzae populations from Argentina. Australas. Plant Pathol. 2008, 37, 357–364. [Google Scholar] [CrossRef]
  16. Shirke, M.D.; Mahesh, H.B.; Gowda, M. Genome-wide comparison of Magnaporthe species reveals a host-specific pattern of secretory proteins and transposable elements. PLoS ONE 2016, 11, e0162458. [Google Scholar] [CrossRef]
  17. Jagadeesh, D.; Prasanna Kumar, M.K.; Chandrakanth, R.; Devaki, N.S. Molecular diversity of internal transcribed spacer among the monoconidial isolates of Magnaporthe oryzae isolated from rice in Southern Karnataka; India. J. Genet. Eng. Biotechnol. 2018, 16, 631–638. [Google Scholar] [CrossRef] [PubMed]
  18. Mehta, A.; Mehta, Y.R.; Rosato, Y.B. ERIC- and REP-PCR amplify non-repetitive fragments from the genome of Drechslera avenae and Stemphylium solani. FEMS Microbiol. Lett. 2002, 211, 51–55. [Google Scholar] [CrossRef] [PubMed]
  19. Abdollahzadeh, J.; Zolfaghari, S. Efficiency of rep-PCR fingerprinting as a useful technique for molecular typing of plant pathogenic fungal species: Botryosphaeriaceae species as a case study. FEMS Microbiol. Lett. 2014, 361, 144–157. [Google Scholar] [CrossRef]
  20. Sirisathaworn, T.; Srirat, T.; Longya, A.; Jantasuriyarat, C. Evaluation of mating type distribution and genetic diversity of three Magnaporthe oryzae avirulence genes; PWL-2; AVR-Pii and Avr-Piz-t; in Thailand rice blast isolates. Agric. Nat. Resour. 2017, 51, 7–14. [Google Scholar] [CrossRef]
  21. Zhang, N.; Zhao, S.; Shen, Q. A six-gene phylogeny reveals the evolution of mode of infection in the rice blast fungus and allied species. Mycologia 2011, 103, 1267–1276. [Google Scholar] [CrossRef]
  22. White, T.J.; Bruns, T.; Lee, S.; Taylor, J. Amplification and direct sequencing of fungal ribosomal RNA genes for phylogenetics. In PCR Protocols: A Guide to Methods and Applications; Innis, M.A., Gelfand, D.H., Sninsky, J.J., White, T.J., Eds.; Academic Press Inc.: New York, NY, USA, 1990; pp. 315–322. [Google Scholar]
  23. Suzuki, F.; Arai, M.; Yamaguchi, J. DNA fingerprinting of Pyricularia grisea by rep-PCR using a single primer based on the terminal inverted repeat from either of the transposable elements Pot2 and MGR586. J. Gen. Plant Pathol. 2006, 72, 314–317. [Google Scholar] [CrossRef]
  24. Pavel, A.B.; Vasile, C.I. PyElph—A software tool for gel images analysis and phylogenetics. BMC Bioinformatics 2012, 13, 13–19. [Google Scholar] [CrossRef] [PubMed]
  25. Jia, Y.; Valent, B.; Lee, F.N. Determination of host responses to Magnaporthe grisea on detached rice leaves using a spot inoculation method. Plant Dis. 2003, 87, 129–133. [Google Scholar] [CrossRef]
  26. Takahashi, W.; Miura, Y.; Sasaki, T. A novel inoculation method for evaluation of grey leaf spot resistance in italian ryegrass. J. Plant Pathol. 2009, 91, 171–176. [Google Scholar] [CrossRef]
  27. Harp, T.L.; Correll, J.C. Recovery and characterization of spontaneous; selenate-resistant mutants of Magnaporthe grisea; the rice blast pathogen. Mycologia 1998, 90, 954–963. [Google Scholar] [CrossRef]
  28. Tagle, A.G.; Chuma, I.; Hisano, H.; Sato, K.; Tosa, Y. Genetic analysis of the resistance of barley to cryptic species of Pyricularia. J. Gen. Plant Pathol. 2016, 82, 302–306. [Google Scholar] [CrossRef]
  29. Genovesi, A.D.; Jessup, R.W.; Burson, B.L.; Engelke, M.C.; Chandra, A. Interspecific Hybrids between Pembagrass and St. Augustine grass. Crop Sci. 2017, 57, 2819–2827. [Google Scholar] [CrossRef]
  30. Wang, W.; Zhang, X.; Garcia, S.; Leitch, A.R.; Kovařík, A. Intragenomic rDNA variation—The product of concerted evolution; mutation; or something in between? Heredity 2022, 131, 179–188. [Google Scholar] [CrossRef]
  31. Zhang, Y.J.; Zhang, S.; Liu, X.Z.; Wen, H.A.; Wang, M. A simple method of genomic DNA extraction suitable for analysis of bulk fungal strains. Lett. Appl. Microbiol. 2010, 51, 114–118. [Google Scholar] [CrossRef]
  32. Hirata, K.; Kusaba, M.; Chuma, I.; Osue, J.; Nakayashiki, H.; Mayama, S.; Tosa, Y. Speciation in Pyricularia inferred from multilocus phylogenetic analysis. Mycol. Res. 2007, 111, 799–808. [Google Scholar] [CrossRef]
  33. Klaubauf, S.; Tharreau, D.; Fournier, E.; Groenewald, J.Z.; Crous, P.W.; de Vries, R.P.; Lebrun, M.H. Resolving the polyphyletic nature of Pyricularia (Pyriculariaceae). Stud. Mycol. 2014, 79, 85–120. [Google Scholar] [CrossRef]
  34. Murata, N.; Aoki, T.; Kusaba, M.; Tosa, Y.; Chuma, I. Various species of Pyricularia constitute a robust clade distinct from Magnaporthe salvinii and its relatives in Magnaporthaceae. J. Gen. Plant Pathol. 2014, 80, 66–72. [Google Scholar] [CrossRef]
  35. Chadha, S.; Sharma, M. Transposable elements as stress adaptive capacitors induce genomic instability in fungal pathogen Magnaporthe oryzae. PLoS ONE 2014, 9, e94415. [Google Scholar] [CrossRef]
  36. George, M.L.C.; Nelson, R.J.; Zeigler, R.S.; Leung, H. Rapid population analysis of Magnaporthe grisea by using rep-PCR and endogenous repetitive DNA sequences. Phytopathology 1998, 88, 223–229. [Google Scholar] [CrossRef] [PubMed]
  37. Gladieux, P.; Ravel, S.; Rieux, A.; Cros-Arteil, S.; Adreit, H.; Milazzo, J.; Thierry, M.; Fournier, E.; Terauchi, R.; Tharreau, D. Coexistence of multiple endemic and pandemic lineages of the rice blast pathogen. mBio 2018, 9, e01806-17. [Google Scholar] [CrossRef]
  38. Gomez, L.L.B.; Tsai, I.J.; Chuma, I.; Tosa, Y.; Chen, Y.H.; Li, J.Y.; Li, M.Y.; Lu, M.Y.J.; Nakayashiki, H.; Li, W.H. Blast fungal genomes show frequent chromosomal changes; gene gains and losses; and effector gene turnover. Mol. Biol. Evol. 2019, 36, 1148–1161. [Google Scholar] [CrossRef] [PubMed]
  39. Motallebi, P.; Javan-Nikkhah, M.; Okhovvat, S.M. Characterization of Magnaporthe grisea populations associated with rice and weeds in Iran. Australas. Plant Pathol. 2013, 42, 693–700. [Google Scholar] [CrossRef]
  40. Viji, G.; Uddin, W. Distribution of mating type alleles and fertility status of Magnaporthe grisea causing gray leaf spot of perennial ryegrass and St. Augustine grass turf. Plant Dis. 2002, 86, 827–832. [Google Scholar] [CrossRef] [PubMed]
  41. Asoufi, H.; Hameed, K.M.; Mahasneh, A. The cellulase and pectinase activities associated with the virulence of indigenous Sclerotinia sclerotiorum isolates in Jordan valley. Plant. Pathol. J. 2007, 23, 233–238. [Google Scholar] [CrossRef]
  42. Challagulla, V.; Bhattarai, S.; Midmore, D.J. In-vitro vs in-vivo inoculation: Screening for resistance of Australian rice genotypes against blast fungus. Rice Sci. 2015, 22, 132–137. [Google Scholar] [CrossRef]
  43. Ploetz, R.C. Diseases of Tropical Fruit Crops, 1st ed.; Ploetz Randy, C., Ed.; CABI Publishing: Brooker, FL, USA, 2003. [Google Scholar]
  44. Campos-Rivero, G.; Sánchez-Teyer, L.F.; De la Cruz-Arguijo, E.A.; Ramírez-González, M.S.; Larralde-Corona, C.P.; Narváez-Zapata, J.A. Bioprospecting for fungi with potential pathogenic activity on leaves of Agave tequilana Weber var. Azul. J. Phytopathol. 2019, 167, 283–294. [Google Scholar] [CrossRef]
Figure 1. ITS region analysis of the Pyricularia accessions of this study and other accessions retrieved from GenBank: (A) hotspot localization, (B) haplotype ITS network. The red arrow shows the redundant haplotype that includes most of the P. oryzae of this study. Colors represent different geographical locations. (C) Haplotype ITS network built only with the Pyricularia isolates of this study. The red arrow shows the same redundant haplotype of panel B. Colors represent isolates of different host grasses. Lines indicate the different mutational steps. The circle area in the haplotypes is proportional to the ratio of each ITS sequence group.
Jof 09 01055 g001
Figure 2. Genetic variability in the Pyricularia isolates in this study. (A) Pot2-TIR profile. UPGMA tree from absence/presence of band information. Color tree lines indicate the host origin of the isolates (red, D. ciliaris; green, S. secundatum; and blue, C. ciliaris). (B) ERIC-PCR profile. UPGMA tree from absence/presence of band information. Black tree lines are P. oryzae isolates. Green tree lines show isolates from the Tamaulipas region. Blue tree lines indicate the isolates from the Morelos region. Tree plots also indicate the specific clades for each host grass.
Jof 09 01055 g002
Figure 3. Infection symptoms produced by using representative Pyricularia isolates. (A) Phenotypic evaluation scale of GLS resistance on S. secundatum: 0 = no visible symptoms; 1 = dark brown, non-sporulating lesions with 1–2 mm diameter; 2 = expanding, dark brown, non-sporulating lesions; 3 = small circular or diamond-shaped lesions with sporulating areas; 4 = large, expanding lesions with sporulating areas. (B) GLS symptoms on detached leaves of S. secundatum. Above, agar plug inoculation with (left) or without (right) punction damage. Below, black spots (left) formed by independent infective colonies and a sporulated lesion (right).
Jof 09 01055 g003
Figure 4. Cross-infection assay using representative Pyricularia isolates in three representative leaves of each grass. P. oryzae isolates from S. secundatum of the Morelos (SY2) and Tamaulipas (SR1) regions. P. pennisetigena isolates from C. ciliaris of the Morelos (CY1) and Tamaulipas (CR1) regions. Pyricularia sp. (DY1) isolate from D. ciliaris collected in the Morelos region.
Jof 09 01055 g004
Table 1. Pyricularia isolates, identity, location and MAT1 allele.
Accession NumberIsolateBlast Identity (99%)MAT1 AlleleLocationHost
MT785889SY1P. oryzaeMat1-1Yautepec, MorelosS. secundatum
MT785890SY2 aP. oryzaeMat1-1Yautepec, MorelosS. secundatum
MT785891SY4P. oryzaeMat1-1Yautepec, MorelosS. secundatum
MT785892SZ1P. oryzaeMat1-1Zacatepec, MorelosS. secundatum
MT785893SZ3P. oryzaeMat1-1Zacatepec, MorelosS. secundatum
OK185290SO1-1P. oryzaeMat1-1Oacalco, MorelosS. secundatum
OK185291SO1-2P. oryzaeMat1-1Oacalco, MorelosS. secundatum
OK185292SO1-3P. oryzaeMat1-1Oacalco, MorelosS. secundatum
OK185293SO2-1P. oryzaeMat1-1Oacalco, MorelosS. secundatum
OK185294SO2-2P. oryzaeMat1-1Oacalco, MorelosS. secundatum
OK185295SO2-3P. oryzaeMat1-1Oacalco, MorelosS. secundatum
OK185296SO3-2P. oryzaeMat1-1Oacalco, MorelosS. secundatum
OK185297SO3-3P. oryzaeMat1-1Oacalco, MorelosS. secundatum
OK185298SO3-4P. oryzaeMat1-1Oacalco, MorelosS. secundatum
OK185299SO3-5P. oryzaeMat1-1Oacalco, MorelosS. secundatum
OK185300SRc1-1P. oryzaeMat1-1Reynosa, TamaulipasS. secundatum
OK185301SRc1-2P. oryzaeMat1-1Reynosa, TamaulipasS. secundatum
OK185302SRc1-3P. oryzaeMat1-1Reynosa, TamaulipasS. secundatum
OK185303SRc2-1P. oryzaeMat1-1Reynosa, TamaulipasS. secundatum
OK185304SRc2-3P. oryzaeMat1-1Reynosa, TamaulipasS. secundatum
OK185305SRc2-4P. oryzaeMat1-1Reynosa, TamaulipasS. secundatum
MT785894SR1 aP. oryzaeMat1-2Reynosa, TamaulipasS. secundatum
OK185306SRf1P. oryzaeMat1-2Reynosa, TamaulipasS. secundatum
OK185307SRf4P. oryzaeMat1-2Reynosa, TamaulipasS. secundatum
OK185308SRf6P. oryzaeMat1-2Reynosa, TamaulipasS. secundatum
OK185309SRf10P. oryzaeMat1-2Reynosa, TamaulipasS. secundatum
OK185310SRf11P. oryzaeMat1-2Reynosa, TamaulipasS. secundatum
OK185311SRf12P. oryzaeMat1-2Reynosa, TamaulipasS. secundatum
OK185312SRf8P. oryzaeMat1-1Reynosa, TamaulipasS. secundatum
OK185313SRf7P. oryzaeMat1-1Reynosa, TamaulipasS. secundatum
OK185314SRf13P. oryzaeMat1-1Reynosa, TamaulipasS. secundatum
OK185315SRf15P. oryzaeMat1-1Reynosa, TamaulipasS. secundatum
OK185316SYb1-1P. oryzaeMat1-1Yautepec, MorelosS. secundatum
OK185317SYb1-2P. oryzaeMat1-1Yautepec, MorelosS. secundatum
OK185318SYb2-1P. oryzaeMat1-1Yautepec, MorelosS. secundatum
OK185319SYc2-1P. oryzaeMat1-1Yautepec, MorelosS. secundatum
OK185320SYc3-1P. oryzaeMat1-1Yautepec, MorelosS. secundatum
OK185321SYc3-3P. oryzaeMat1-1Yautepec, MorelosS. secundatum
OK185322SYc3-4P. oryzaeMat1-1Yautepec, MorelosS. secundatum
OK185323SYc3-5P. oryzaeMat1-1Yautepec, MorelosS. secundatum
OK185324SYe1-1P. oryzaeMat1-1Yautepec, MorelosS. secundatum
OK185325SYe2-1P. oryzaeMat1-1Yautepec, MorelosS. secundatum
OK185326SY1-1P. oryzaeMat1-1Yautepec, MorelosS. secundatum
OK185327SY1-2P. oryzaeMat1-1Yautepec, MorelosS. secundatum
OK185328SY2-2P. oryzaeMat1-1Yautepec, MorelosS. secundatum
OK185329SY3-1P. oryzaeMat1-1Yautepec, MorelosS. secundatum
OK185330SY3-2P. oryzaeMat1-1Yautepec, MorelosS. secundatum
OK185331SYi1-1P. oryzaeMat1-1Yautepec, MorelosS. secundatum
OK185332CR1 aP. pennisetigenaN.A.Reynosa, TamaulipasC. ciliaris
OK185333CRc1P. pennisetigenaN.A.Reynosa, TamaulipasC. ciliaris
OK185334CRc3P. pennisetigenaN.A.Reynosa, TamaulipasC. ciliaris
OK185335CRc4P. pennisetigenaN.A.Reynosa, TamaulipasC. ciliaris
OK185336CRf1P. pennisetigenaN.A.Reynosa, TamaulipasC. ciliaris
OK185337CY1 aP. pennisetigenaN.A.Yautepec, MorelosC. ciliaris
OK185338CY3P. pennisetigenaN.A.Yautepec, MorelosC. ciliaris
OK185339DY1 aPyricularia sp.N.A.Yautepec, MorelosD. ciliaris
OK185340DY2Pyricularia sp.N.A.Yautepec, MorelosD. ciliaris
a Pyricularia isolates selected for further analysis. N.A. No amplification with the MAT1 allele primers.
Table 2. Establishment of the pathogenicity test in P. oryzae strains isolated from S. secundatum via agar plug inoculation with or without punction damage to detached leaves of S. secundatum grass.
IsolateLocationReaction Type ScaleDamaged Area (mm2)
PlugPlug + PunctionPlugPlug + Punction
SY1Yautepec, Morelos3423.0 ± 3.6 b75.1 ± 9.5 a
SY2Yautepec, Morelos4476.7 ± 6.2 a73.6 ± 13.0 a
SY4Yautepec, Morelos245.1 ± 2.3 c73.7 ± 6.2 a
SZ1Zacatepec, Morelos141.8 ± 1.8 c15.4 ±7.0 c
SZ3Zacatepec, Morelos141.6 ± 1.1 c17.6 ± 8.3 c
SR1Reynosa, Tamaulipas3424.07 ± 4.8 b42.1 ± 5.5 b
a, b and c are different groups of according to the Tukey test (α = 0.05).
Table 3. Cross-infection assay for Pyricularia isolates using an airbrush method on different host grasses.
HostRepresentative IsolateLeaf Lesions (Number) aDamaged Area (mm2)Damaged Area (%)SES Scale b
Stenotaphrum secundatumSY24.35 ± 1.157.57 ± 12.6112.64 ± 2.586
SR12 ± 0.799.82 ± 3.112.44 ± 0.874
CY1
CR12.1 ± 0.9113.05 ± 5.042.92 ± 0.984
DY1
Cenchrus ciliarisSY2
SR11.3 ± 0.573.52 ± 1.580.43 ± 0.313
CY15.85 ± 2.2180.45 ± 28.2615.30 ± 3.216
CR12 ± 0.6516.41 ± 4.752.79 ± 0.784
DY10
Digitaria ciliarisSY2
SR1
CY1
CR1
DY12.4 ± 0.920.59 ± 3.563.17 ± 0.574
–: No infection. a At 7 days of infection. b According to [24].
Disclaimer/Publisher’s Note: The statements, opinions and data contained in all publications are solely those of the individual author(s) and contributor(s) and not of MDPI and/or the editor(s). MDPI and/or the editor(s) disclaim responsibility for any injury to people or property resulting from any ideas, methods, instructions or products referred to in the content.

