
Pulsed-Supplied Water Electrolysis via Two-Switch Converter for PV Capacity Firming


Department of Electrical Engineering, Cyprus University of Technology, P.O. Box 50329, Limassol 3603, Cyprus
Electricity 2022, 3(1), 131-144; https://doi.org/10.3390/electricity3010008
Submission received: 15 January 2022
/
Revised: 21 February 2022
/
Accepted: 4 March 2022
/
Published: 8 March 2022
(This article belongs to the Special Issue Recent Advances in Grid Connected Photovoltaic Systems)
Abstract
:Hydrogen constitutes the only carbon-free fuel that can be used for energy conversion, producing water as the only by-product. With water being one of the most abundant and inexhaustible raw materials in the world, and the required electricity input being provided by renewable resources, the produced hydrogen via water electrolysis constitutes a green pathway towards sustainability. In this work, a hybrid PV power-to-hydrogen, storage and fuel cell system is proposed to satisfy the domestic load of a residential building. Identifying alkaline as a mandatory electrolysis technology, the performance of alkaline electrolysis cells is assessed considering the inclusion of a two-switch buck-boost converter. Following a comprehensive formulation with respect to each distinguished system component, the balance condition at DC and AC buses is determined. The proposed configuration is evaluated, taking into account PV systems of different ratings, namely 3 kW, 5 kW and 7 kW. Based on actual data relating to both PV generation and domestic load for the year 2020, the obtained results from the annual simulations are compared with feed-in tariff and net-metering schemes. According to the results, PV capacity firming is achieved, creating great opportunities for autonomy enhancement, not only for electricity, but also in other energy sectors.
1. Introduction
Global energy demand has increased drastically during the last decade, as a result of the increase in human population and subsequent anthropogenic activities. Currently, fossil fuels are used to satisfy the majority of electricity demand, releasing a lot of harmful and hazardous by-products which in turn lead to environmental degradation. Moreover, due to their finite nature as resources, the sustainability of using fossil fuels is inherently limited. Although these reasons are sufficient to explore alternative energy sources, it is still questionable whether they can be appropriately exploited for energy production or serve as secondary energy carriers in other sectors including heating, cooling, industry, and high-tech materials production that are necessary for modern society.
On the other hand, renewable energy sources (RES) such as solar and wind can provide alternative pathways for energy generation under mild conditions and in the absence of Greenhouse gas (GHG) emissions. However, they often occur inadequate for load following due to their intermittent and unpredictable potential availability [1]. Considering the electrification trend of the rest of energy sectors, the overall load demand fluctuates even more stochastically in today’s progressive systems. This can manifest load interruptions, frequency and voltage deviations, network congestions or RES curtailment, calling for active electricity storage systems. Since a single storage device cannot satisfy the whole range of power systems applications, either more complicated models have to take place in order to provide hybrid services or the placement of different technologies across the power chain becomes a complex optimization problem subject to several geographical, environmental and operational constraints [2].
Aiming to offer a clean alternative to controllable and dispatchable power stemming from conventional fuels, many researchers across the globe have turned their focus to the hydrogen economy. Hydrogen constitutes the only carbon-free fuel with the highest energy content compared to any known fuel. It can be used for energy conversion with the aid of internal combustion engines, gas turbines or fuel cells, producing water as the only by-product. Consequently, it has been widely accepted as an environmentally benign, secondary form of renewable energy. A wide variety of processes for hydrogen production via different feedstocks exists [3]. A typical classification refers to reforming, non-reforming and water splitting methods. Reforming processes concern steam reforming, partial oxidation and autothermal reforming that mainly make use of fossil fuels. Biomass gasification and pyrolysis fall into the thermochemical sub-category of non-reforming approaches along with the biological routes which regard the bio-photolysis, dark and photo fermentation mechanisms. The last category accommodates the carbon-free techniques that generate hydrogen utilizing water via photolysis, thermolysis and electrolysis. With water being one of the most abundant and inexhaustible raw materials in the world, and the required electricity input being provided by RES, the produced hydrogen via water electrolysis can be probably the cleanest and most sustainable energy carrier mankind can use.
The most commonly used electrolysis cells are the alkaline (AEC), proton exchange membrane (PEMEC) and solid oxide (SOEC), whereas between the devices that can convert the gaseous hydrogen into useful energy, fuel cells (FCs) are considered as the most efficient. Regenerative FCs offer both operations (electrolyser/FC) in one device by making use of reversible chemical reactions to form hydrogen and recover water, respectively. Based on the extensive literature, the high-temperature, solid-oxide cells are preferred for bulk and centralized generation. Acidic (PEM) and alkaline (A) regenerative FCs become favorable in decentralized applications. Considering the intermittency of RES potential which requires frequent start-ups and high ramp rates, the regenerative PEMFCs have been assessed as the most appropriate in vehicles [4,5,6,7,8], residential and commercial applications [9,10,11,12], multi-source microgrids in both islanded and interconnected modes [13,14,15], autonomous and non-interconnected systems in rural areas [16,17,18,19] and large-scale interconnected power systems [20,21,22,23,24,25,26]. In addition, the purity of the produced hydrogen reaches 99.999% and the efficiency sits between 50 and 70% [5,27]. However, AEC forms the mandatory technology widely used for large-scale industrial applications, mainly due to its prompt availability, higher durability and lower capital cost [28]. Furthermore, regenerative AFCs can conserve 3–5% hydrogen by avoiding the water purification procedure needed by PEM systems [29].
Considering the increased integration of grid-tied PV systems, this work emphasizes an efficient power-to-hydrogen technique by making use of a novel DC/DC converter, namely the two-switch buck-boost converter. Based on extensive literature relating to water electrolysis, there has not yet been a comprehensive work emphasizing on the power conditioning system design and on applying it to real-world scenarios. Following a comprehensive formulation relating to alkaline water electrolysis, photovoltaic (PV) generation and pulsed supply, an experimental evaluation is performed based on real PV data derived from three different systems (3 kW, 5 kW and 7 kW) in Cyprus. According to the obtained results, PV capacity firming is achieved, whilst enhancing the households’ autonomy. The aim is to analyze a storage system able to provide time-shifting services in a decentralized manner and without the need for expert control and management equipment. The second key aspect is to offer a viable solution that is already available, eliminating the need for water treatment. This way, residential consumers are allowed to proceed with implementations and benefit from their own electricity for their domestic needs using existing water supply infrastructure.
The rest of the paper is organized as follows: Section 2 deals with system component models considered in the proposed hybrid PV power-to-hydrogen system. In Section 3, the objective is determined, and each distinguished unit is explained in detail. Section 4 presents and discusses the results obtained by an experimental evaluation of three case-studies with different PV systems, while the conclusions are included in Section 5.
2. System Component Models
Alkaline electrolysis is realized at a determined voltage between the cathode and anode, following two electrode reactions. Because the decomposition reaction is high endothermic, the required input energy is provided by electricity. Typically, the electrodes are immersed in an electrolyte (sodium hydroxide-NaOH and/or potassium hydroxide-KOH solution), and when electrical direct current (DC) is applied, water splits and hydrogen is produced at the cathode, while oxygen is evolved on the anode side based on the following reaction [3].
The reactions that take place at the electrodes are presented below.
In this regard, electricity from RES can be stored as long as needed in the form of gaseous hydrogen, and when required, can be retrieved with the aid of fuel cell systems following the reverse chemical reactions at their electrodes. At ambient temperature and atmospheric pressure, 1 kg of H2 gas occupies a volume of 11 m3. Within the operating range of 60–80 °C occurred at AEC, the produced hydrogen possesses 99% purity and requires 2.2 kWh/kg to be stored as compressed gas in over-ground vessels with volumetric densities of up to 40 kg/m3. Even with perfect insulation, a daily loss of 3% is considered to determine the releasing hydrogen into the atmosphere [30]. The minimum cell voltage () required to initialize electrolysis is given via the following equation under constant temperature T and pressure P.
where ΔGo is the change in Gibbs’ free energy, F is the Faraday’s constant and n the number of transmitted electrons. Hence, the free reaction enthalpy can be calculated by taking into account the reaction enthalpy , the temperature, the reaction entropy , and the number of electrons exchanged and equals to 2 according to Equation (5), while F equals to 96,485 C/mol.
At standard conditions (25 °C temperature and 1 bar pressure) leading to the required for water splitting [h50]. The efficiency of the cell is calculated based on Equation (6), where and represent the real and ideal volumes of the produced hydrogen, respectively. The ideal volume of hydrogen can be determined by making use of the Faraday’s Law (Equation (7)), where I is the current through the cell for period t and VM is the molar volume of ideal gas. The real volume of hydrogen can be estimated via Equation (8), where V(measured) is the volume obtained by the displacement of alkaline solution, Ts is the temperature in standard conditions and To is the operating temperature [31].
To consolidate the variation in power (and consequent current I) injected by a RES generator, the following electrochemical model is used.
r represents the reaction-rate control factor given by Maxwell-Boltzmann statistics (Equation (10)), A is the active cell surface, is the energy gap and k are the Boltzmann’s constant.
The process of storing electricity by converting it to chemical energy is described with the aid of Equations (11)–(14). The amount of produced hydrogen () is estimated as:
considering the cell efficiency (ηC~60%), the energy provided to the AEC (ec) during interval t and hydrogen higher heating value (HHV = 141 MJ/kg) [h9]. Equation (12) shows the balance in the storage tank, taking into account the previous state-of-charge (SOC), the tank size (mmax), the depth of discharge (DoD), the hydrogen consumption (mconc) and dynamic losses (mloss).
To retrieve energy via FC (eFC), Equation (15) takes place considering the AFC efficiency (ηFC).
The output from a PV generator PPV is calculated by Equation (16). NPV indicates the number of panels, PSTC the PV panel power under standard test conditions, ηPV the solar-to-electricity conversion efficiency, GA the global solar irradiation on the PV array, GSTC the solar radiation under standard test conditions (usually 1 kW/m2), Tc the temperature of the PV cells, TSTC the temperature under standard test conditions (25 °C) and CT the PV temperature coefficient [15].
In terms of output voltage VPV and current IPV, the energy from PV generators ePV during each time interval t can be obtained by making use of single diode solar PV mathematical models expressed by Equations (17)–(19).
where EMPPT is the maximum power point voltage, Iph is the photo current, Isc the saturation current, q the charge of electrons, Nc the number of cells in series and Ai the ideal diode factor. The size of the inverter is chosen according to the maximum load need (PL). Considering the efficiency of the applied inverter ηinv, its power output Pinv is estimated as [32]:
Consequently, the overall efficiency of the PV-regenerative FC system is expressed via Equation (21), where Tamb is the ambient temperature.
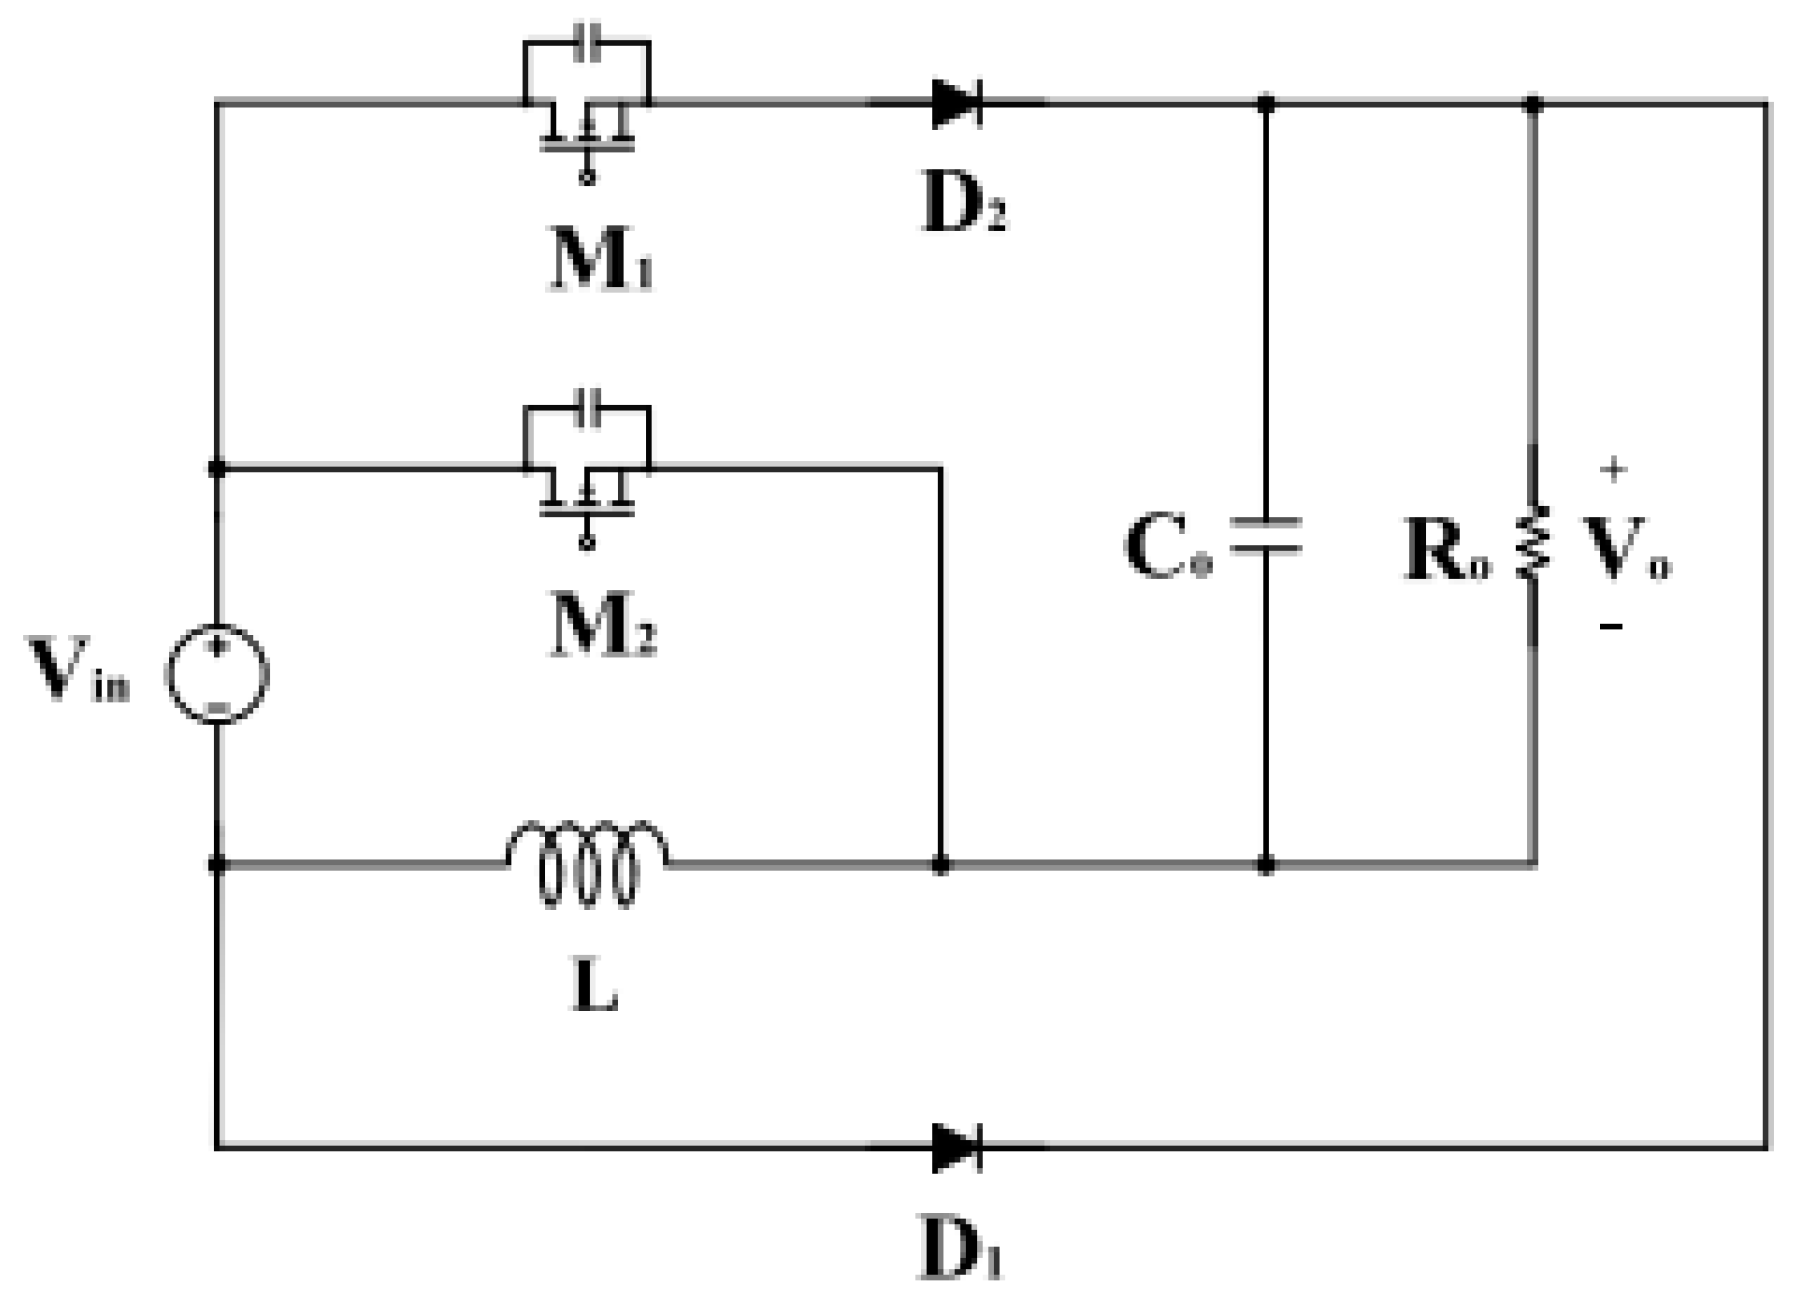
In this study, ηC includes the efficiency of the proposed two-switch converter ηconc. The conversion efficiency of a DC-to-DC converter is of vital importance for the overall system’s lifetime and energy consumption. Although a two-switch buck boost (TSBB) converter is composed of more components than a single switch buck boost (SSBB), it has seen a widespread use in power applications. In contrast to SSBB, which can operate in inverting mode, the output polarity achieved with TSBB is the same as the input voltage.
As a result, when the single switch turns on, the coil is charged from the source, the diode is reversely polarized and thus, current is not flowing, and the load is supplied from the already charged capacitor. When the switch is turned off, the diode is polarized, allowing the current to flow. The source is automatically isolated, and the capacitor starts charging by the coil, which also acts as the source in the circuit. The output voltage level depends on the duty cycle (d) and, if it is greater than 0.5 then the output voltage is higher than the input voltage (boost mode), while when it is less than 0.5, the output is less than the input voltage (buck mode).
An equivalent circuit of a TSBB is demonstrated in Figure 1. The voltage conversion ratio of the proposed converter is as follows:
where the duty cycles of switches M1 and M2 are now denoted by d1 and d2, respectively. In buck mode, M2 is always off, while M1 is switching to regulate the output voltage resulting in . During the conducting state of M1, D2 is forward biased allowing the current to flow, charging the capacitor. When it turns off, D2 is reversely biased and the load is satisfied by the charged components through the D1, which is now conducting. In boost mode, M1 is always on whereas the M2 switch is controlled to regulate Vo. When M2 is on, the isolated DC source charges the coil, while the load is supplied only by the already charged capacitor. Therefore, is valid for every d2. M1 is always off at buck-boost mode where M2 explicitly controls the output voltage. The output voltage is less than the input for , whereas it becomes greater if [33]. The buck-boost modes of operation are listed in Table 1.
3. Objective Formulation
The system under consideration consists of roof-top PV systems, a power conditioning system (PCS), a regenerative AFC and standard residential loads. To tackle the inefficient operation of the assessed alkaline electrolysis unit, a buck-boost DC/DC converter precedes the power-to-hydrogen unit, while the inverse process directly supplies the DC bus. An DC/AC inverter is applied to energize the AC bus, which in turn satisfies the residential appliances’ load. The equivalent diagram of the proposed system is illustrated in Figure 2.
3.1. Domestic Load Profile
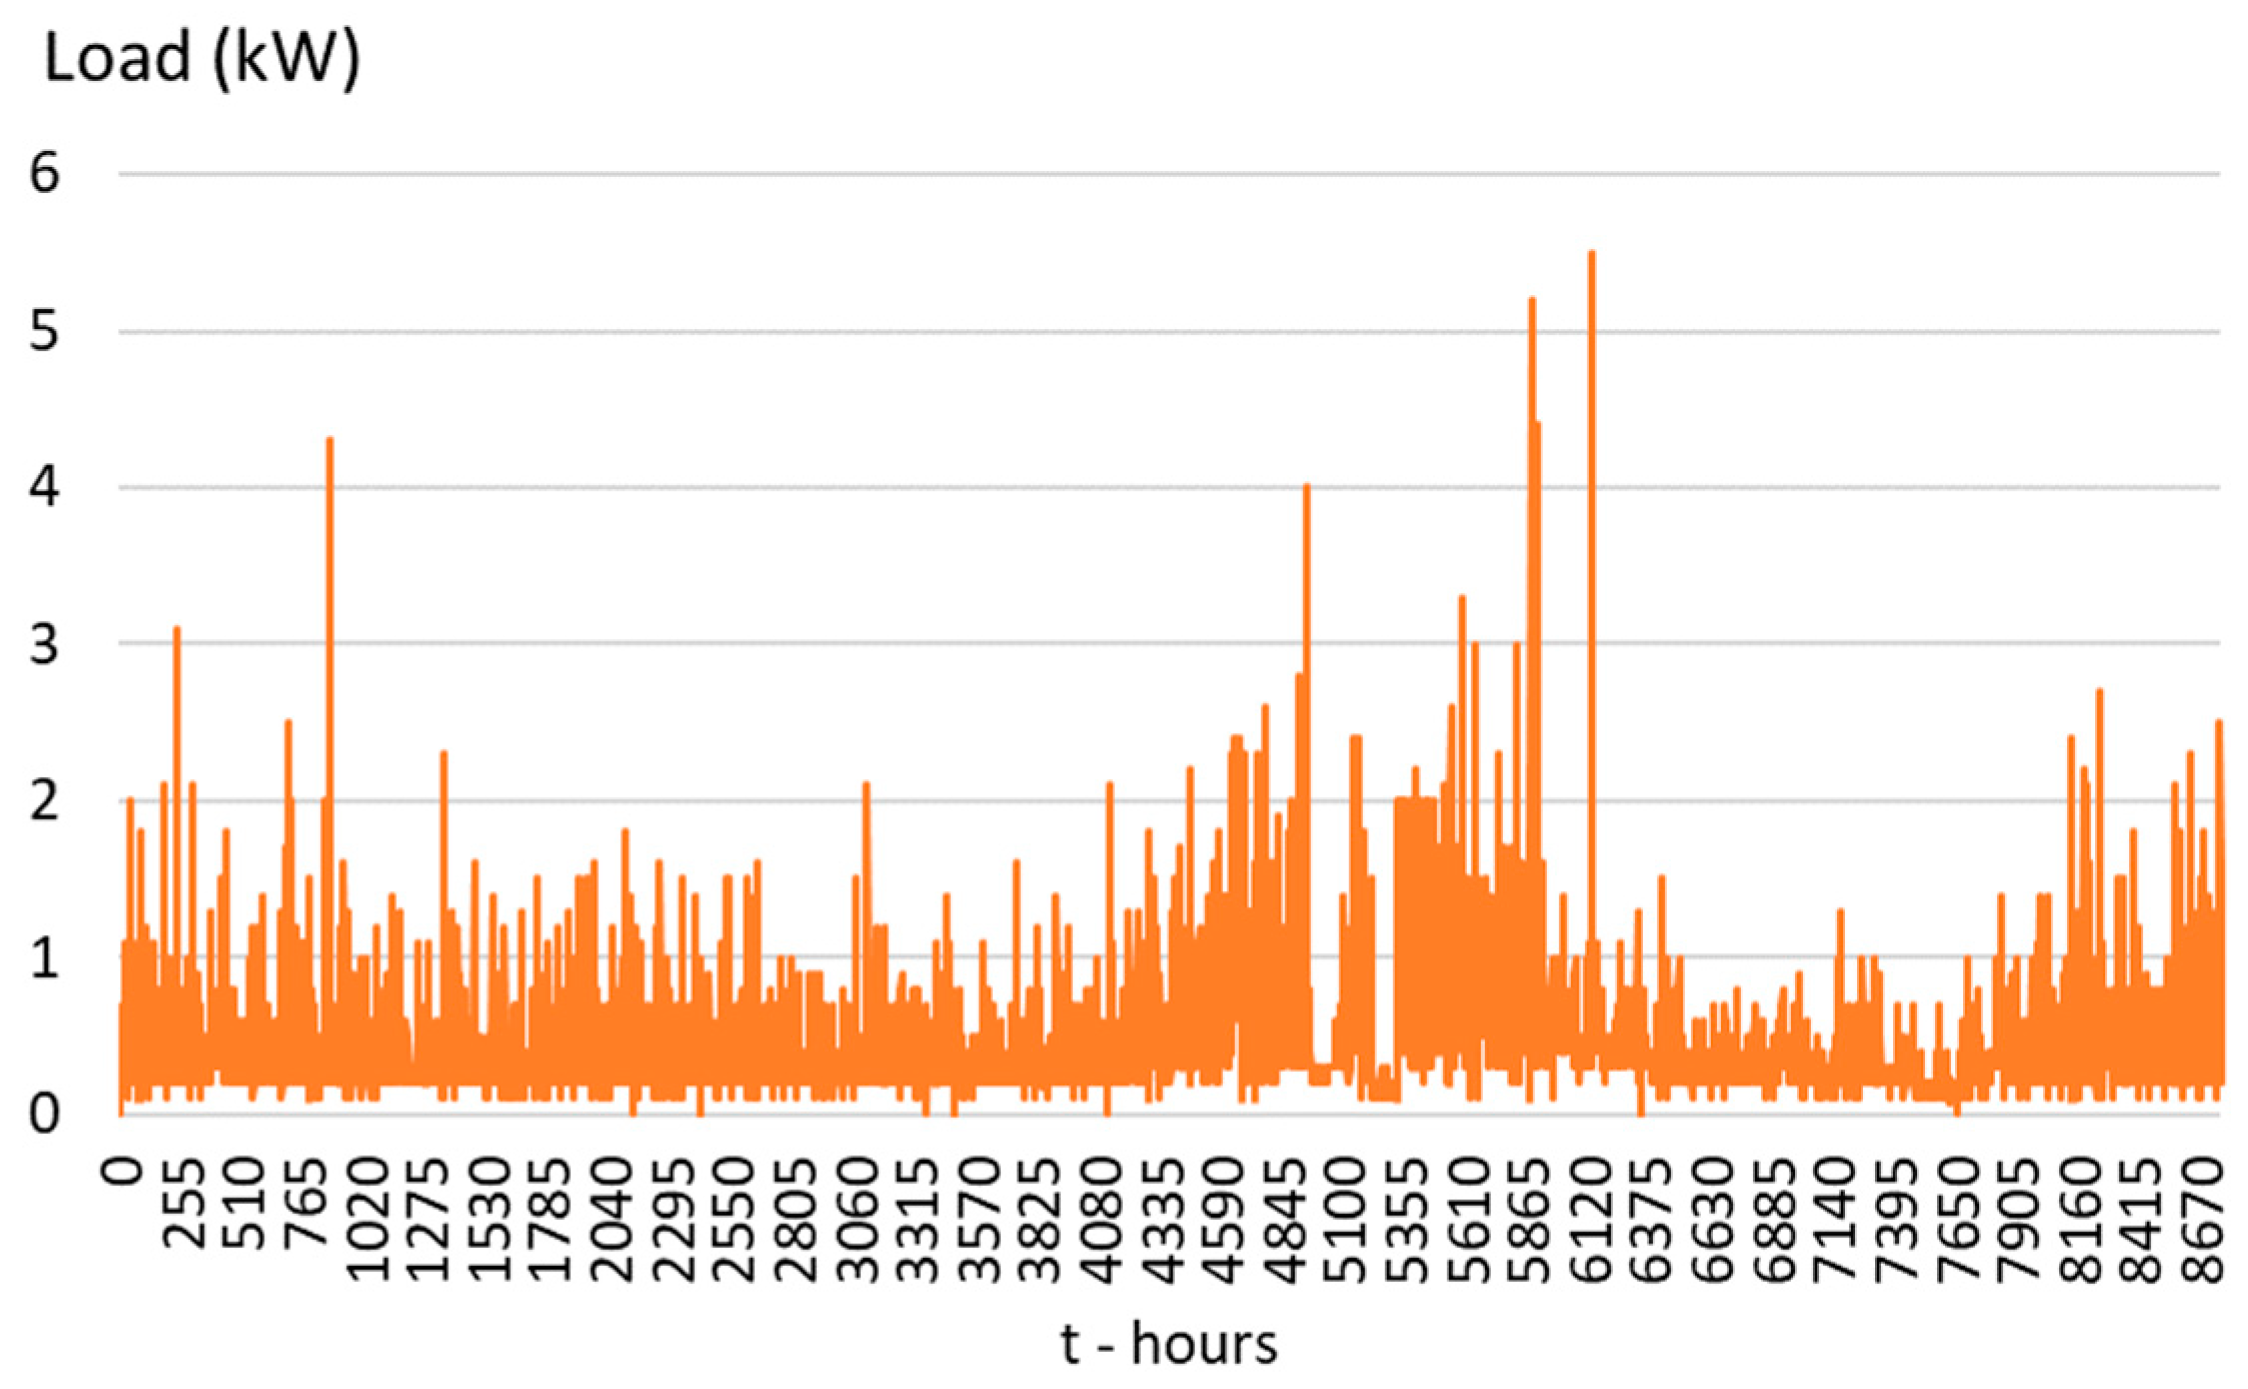
The considered appliances regard a washing machine, a dish washer, a dryer, a refrigerator, an independent freezer, a ceramic hob, an electric oven, a toaster, a mixer, an electric iron, two LCD television sets, three 12,000 BTU air conditioning units (wall-type), one 22,000 BTU air condition unit (duct type), a blow hair dryer, an electric water heater, a vacuum cleaner device, two computers, one printer and a central stereo system. Their nominal power along with the average daily time of use during the year are listed in Table 2. The overall space heating needs are covered by a Diesel boiler. The measured hourly consumption (PD) for the whole year is depicted in Figure 3.
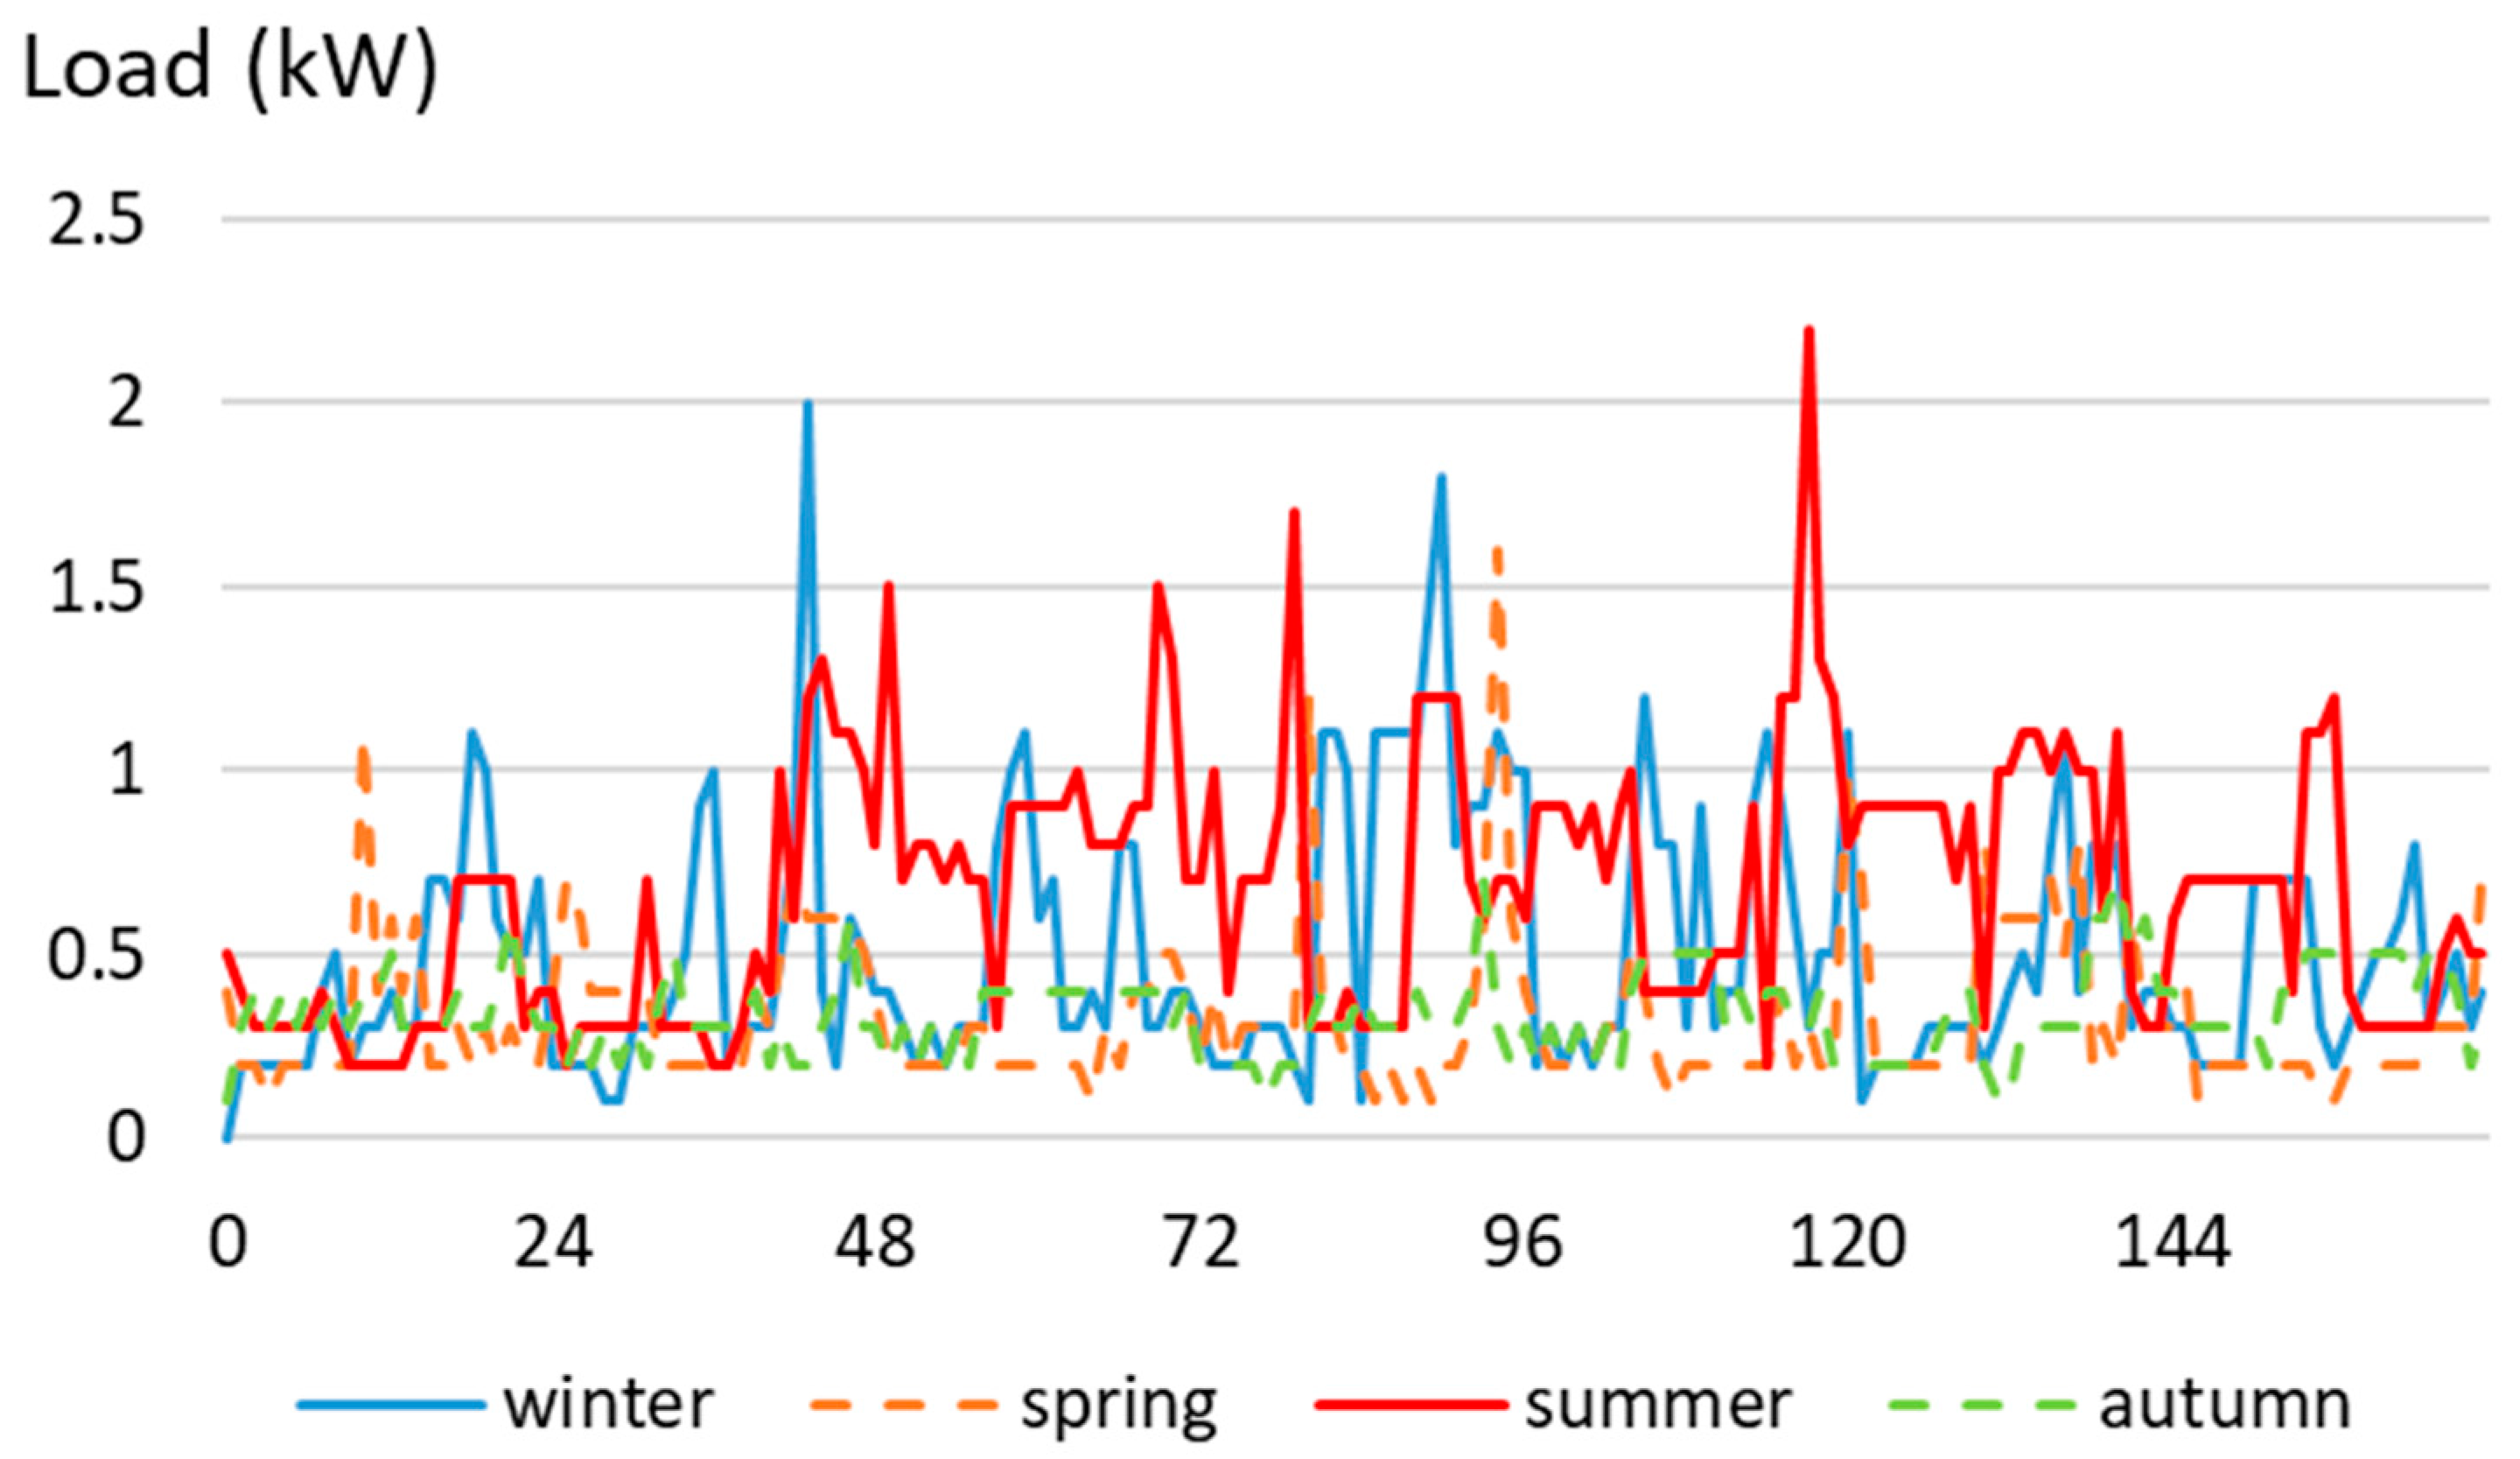
The seasonal variation in domestic demand can be seen from the indicative weeks presented in Figure 4.
3.2. PV Generating System
The residential building installed in Cyprus accommodates a two-string PV system and its covered area occupies 200 m2. In this work, three generating systems composed of polycrystalline solar panels, rated at 3 kW, 5 kW and 7 kW, are assessed based on actual data for the year 2020. To gain a broad overview with respect to the daily contribution of the PV arrays, Figure 5 is utilized to provide the hourly power output (PPV) of their seasonal production, showing the real generation of the first week of January, April, July and October.
Priority is given to the domestic load, allowing the DC power output from the PV systems to be exploited in two ways: (1) as the input to the DC/DC converter used to regulate the power input for the electrolysis unit, or (2) as the input for the DC/AC inverter, which in turns energize the AC bus to either serve the domestic or return the produced electricity to the grid.
3.3. Power-to-Hydrogen Module
The absolute amount of hydrogen produced via alkaline electrolysis and PV power is obtained by making use of a MATLAB/Simulink model called Simscape Model of An Alkaline Electrolyser [34]. Between the embedded source and AEC module, the proposed TSBB is incorporated allowing for capturing the produced hydrogen by varying the electrolyte concentration and duty cycle based on Equation (22). Once the dynamic production of hydrogen is extracted, the overall electrolysis efficiency (including the DC/DC conversion) can be estimated according to Equation (11). Figure 6 provides the obtained results assuming three different ambient temperatures.
As can be seen, an efficiency of 72.5% was achieved at 25 °C ambient temperature and 60% duty cycle, considering a 20% (wt%) KOH electrolyte. This greatly improved the reported 60% efficiency. This stems from power reduction regarding the auxiliary losses of power conditioning system. Thanks to the pulse voltage, electrochemical reactions become slower and relaxed bubbles on the electrode surface favors the separation of oxygen and hydrogen resulting in higher flow amounts with the same energy consumption [35]. Although a wide variety of different DC/DC topologies can be used, transistor-based power supplies offer 10% greater efficiencies compared to thyristor-based alternatives [36]. Within this category, MOSFET types are preferred since switching power savings exist in contrast to bipolar junction transistor (BJT) types. In addition, varying the output voltage of TSBB converter (or input voltage to AEC), the power is regulated in such a way that sustains the efficiency even in the presence of fluctuating and intermittent input DC source (PV). This way, the lifetime of the system is extended and there is no need for anti-islanding operations to take place in case of power outages. On the contrary, the system is able to continue to supply the DC bus for further hydrogen production or domestic load satisfaction via either the PV module or fuel cell device.
3.4. Fuel Cell System
The installed fuel cell device withdraws hydrogen from the over-ground vessels to satisfy the domestic load. Meanwhile, the balance on DC bus is described with the help of the following equation.
As a result, the only limitation concerns the simultaneous contribution of TSBB and fuel cells. Although this constraint is fulfilled by the priority given to the load, to restrict the system from falling into oscillations (consecutive power-to-hydrogen and hydrogen-to-power), the auxiliary status variable takes place to indicate whether the fuel cell is online or offline, respectively. The previous equation is rewritten as:
The respective AC balance is guaranteed based on Equation (25). At each time interval, the domestic load must be satisfied by the power output from the inverter or/and the power grid. The grid energy is not used for inversion and hydrogen production in no circumstance. This way, a single direction inverter is applied by making use of a power diode between the inverter and DC bus. Finally, to ensure that the total renewable power is exploited before any grid injections (Pgrid), the activation variable ξ is included, taking the value 1 if AC bus voltage () is less than load voltage (VL) and 0 otherwise (means that electricity is withdrawn from the grid while ). Therefore, at each time interval the AC balance is achieved via the following formulation:
4. Experimental Evaluation
Applying annual simulations for the year 2020, the following results have been obtained. In the absence of a feed-in tariff (FiT) scheme, an annual curtailed PV energy as high as 4.229 MWh, 5.288 MWh and 9.877 MWh pertaining to the respective 3 kW, 5 kW and 7 kW PV systems is observed. In the case of net-metering mechanism, this energy would necessarily be injected to the grid allowing the customer to offset the consumption rated at 2.448 MWh, 2.445 MWh and 2.285 MWh with the respective PV arrays. This implies that the customer could eliminate the cost of electricity, injecting a surplus of 1.782 MWh, 2.843 MWh and 7.592 MWh of PV energy to the system. These shares are expected from only a single residential building with roof top systems, leading to unsustainable PV contribution. Specifically, if a complex of some hundreds of identical customers is taken into account, the hourly total shares would undeniably deteriorate the grid security and stability.
A second test simulation was performed to assess the potential of power-to-hydrogen approach in the absence of power conditioning system, considering the reported 60% efficiencies for electrolysis and fuel cell, respectively. The hourly storage losses assumed at 0.125%. According to the obtained results, the domestic load is autonomously satisfied with 7 kW PV systems. However, the power-to-hydrogen route provides PV capacity firming, eliminating the PV power curtailment in the expense of 927 kWh and 543 kWh electricity purchase per year from the grid with 3 kW and 5 kW systems, respectively. With 7 kW PV installations, an excess energy of 2.111 MWh is available in the form of stored hydrogen and could be used for heating and transportation needs via hydrogen boilers or hydrogen FC vehicles. Figure 7 includes the simulation results.
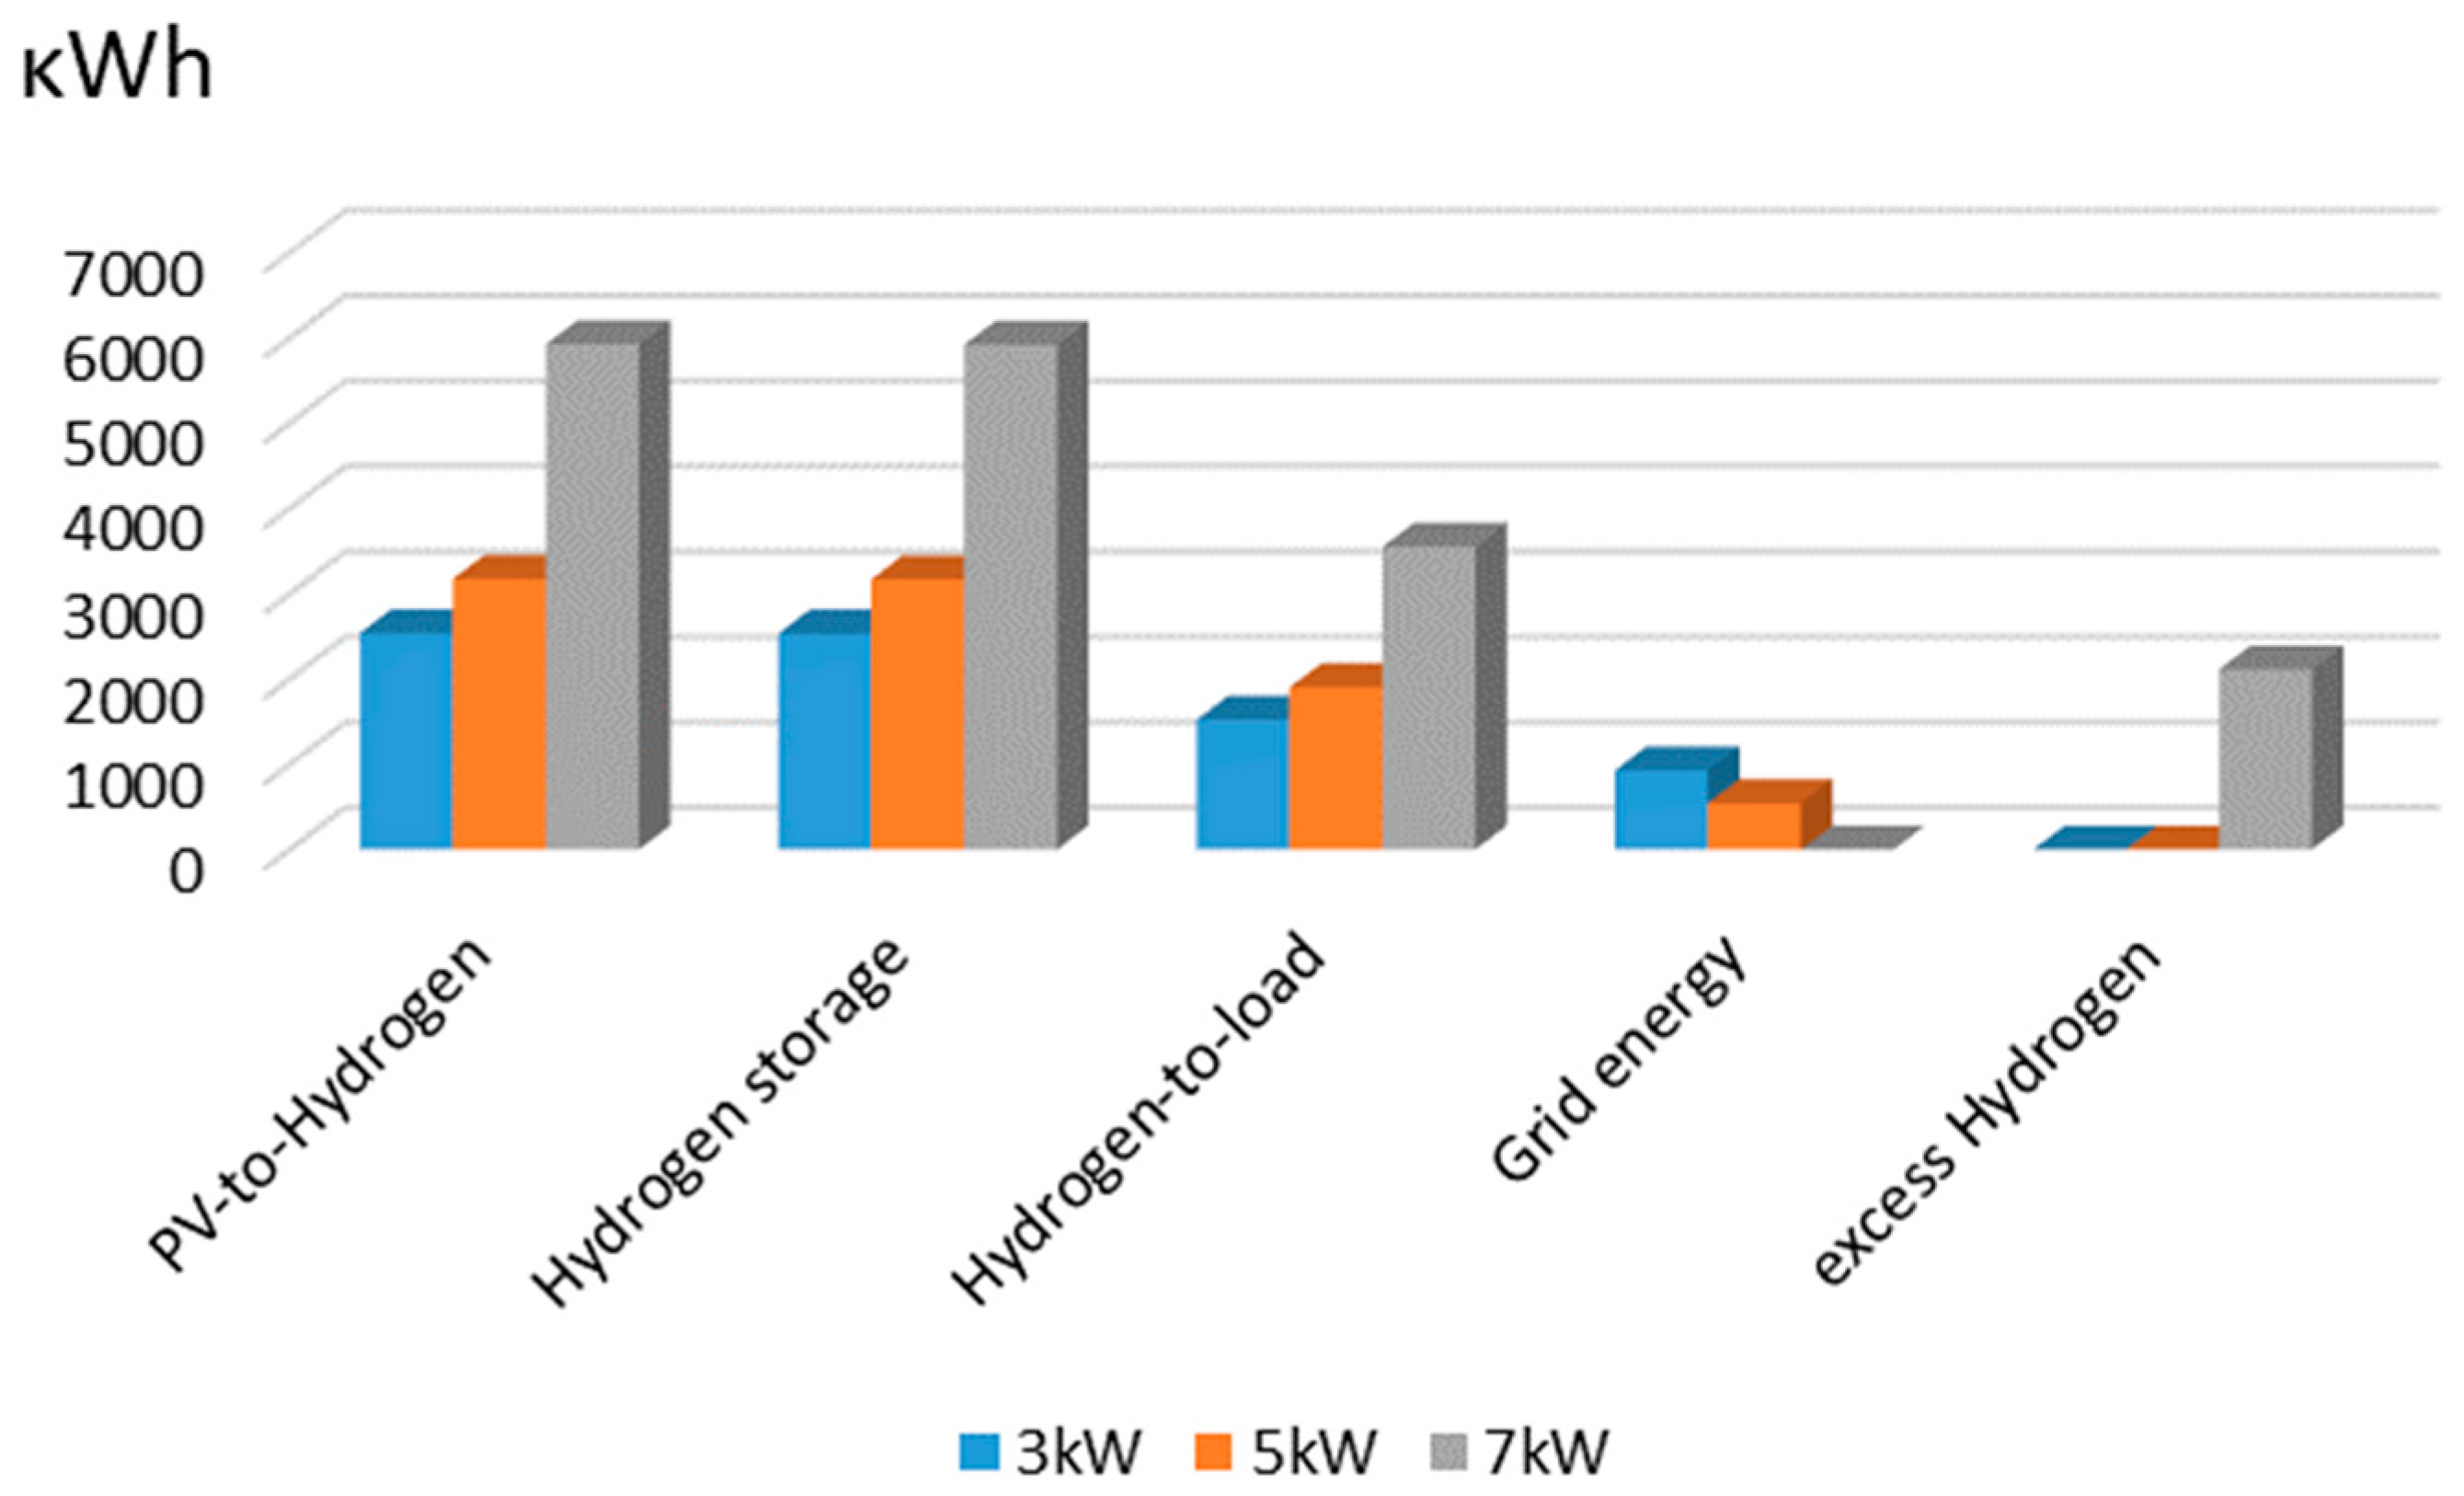
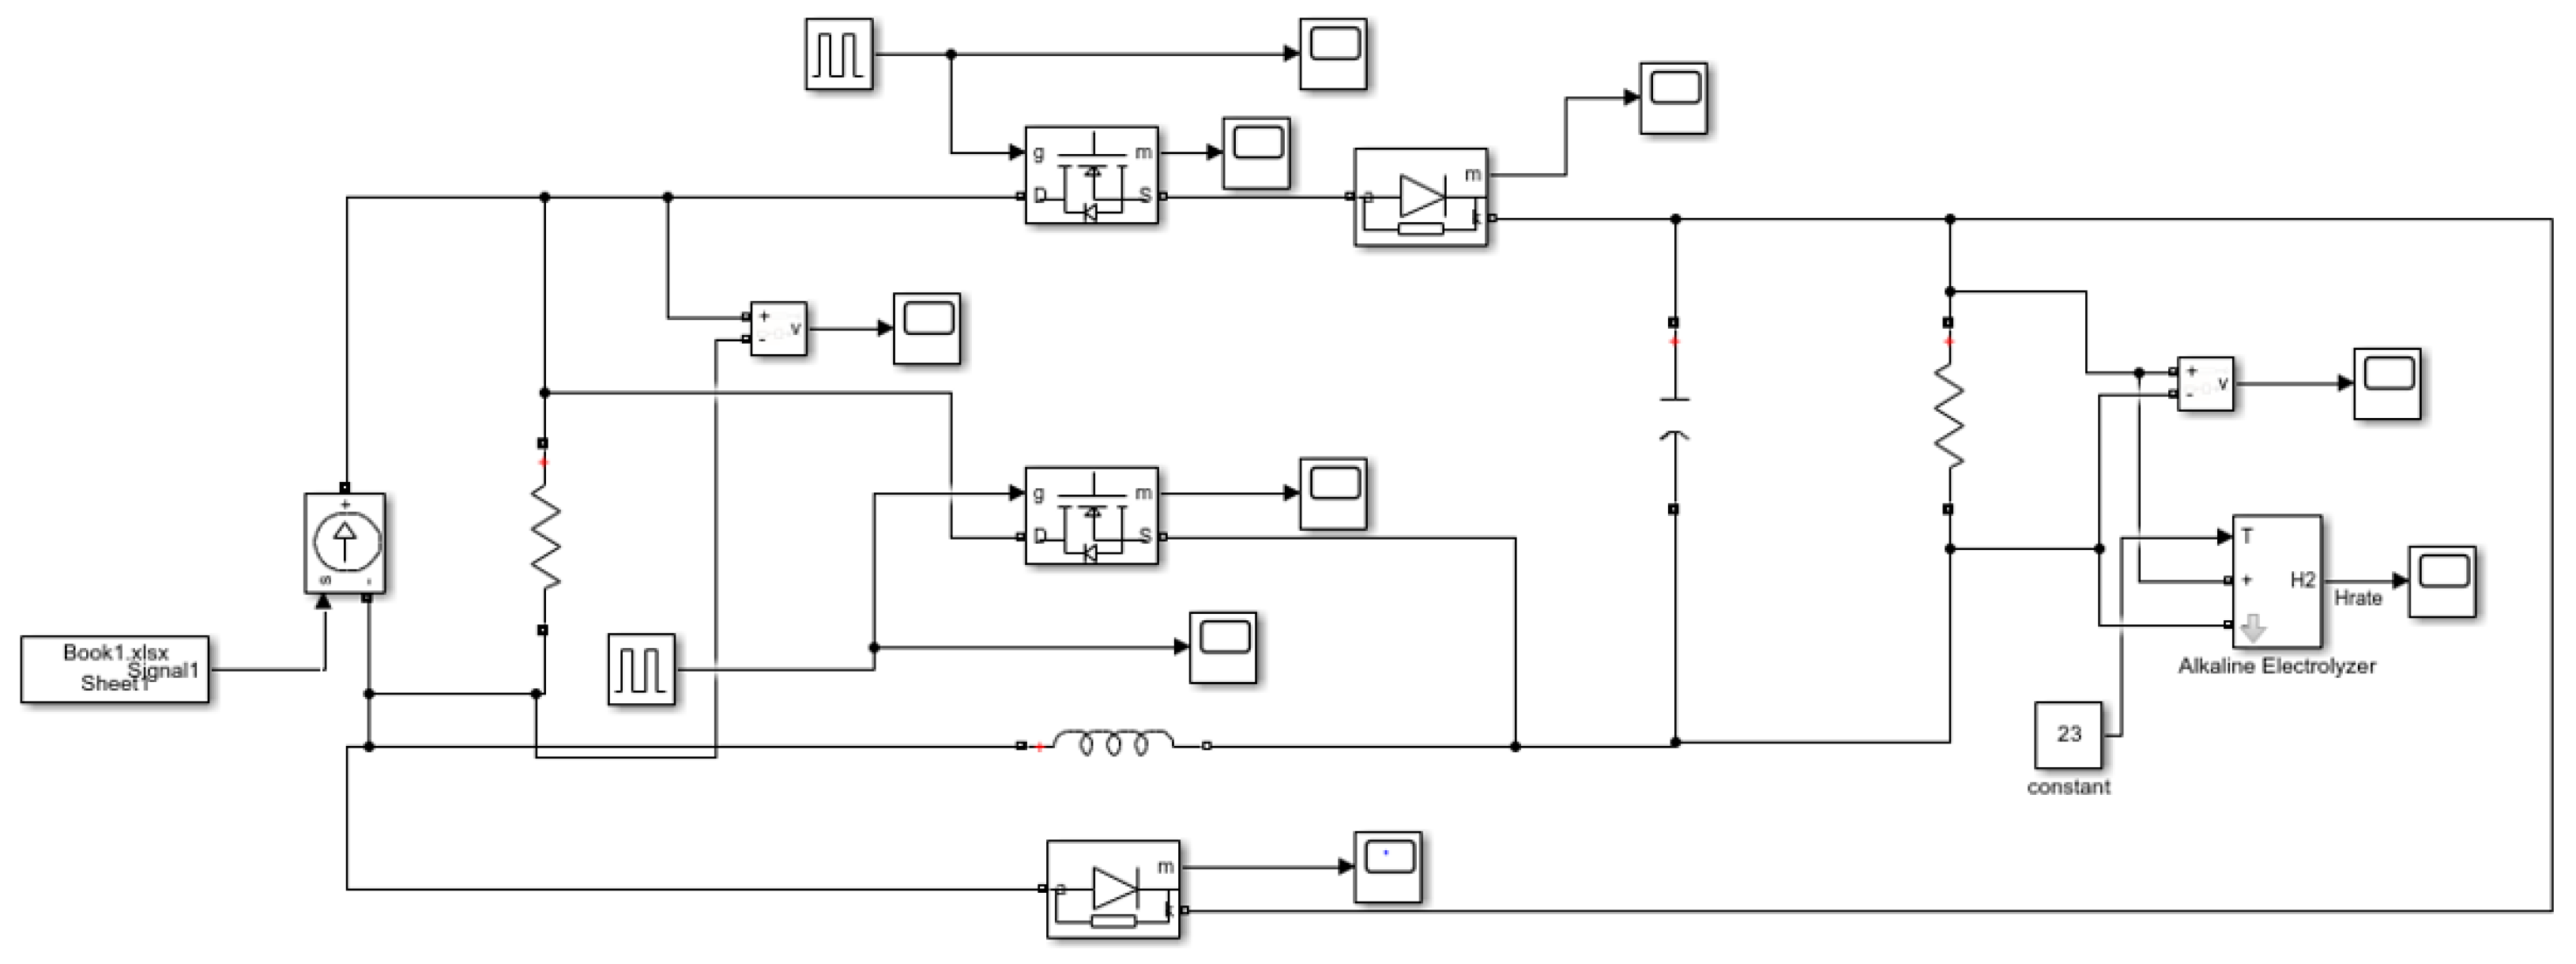
The last experimental evaluation regarded the inclusion of a TSBB converter between the electrolysis unit and DC bus. A demonstration of the proposed topology can be observed in Figure 8. The domestic load further reduced its grid dependency, requiring an annual electricity of 610 kWh and 147 kWh from the grid in the cases of 3 kW and 5 kW PV systems, respectively. The autonomy was greatly improved when 7 kW PV was considered, achieving a total of 2.767 MWh of energy stored in chemical form of gaseous hydrogen. The corresponding results are provided in Figure 9.
Figure 10 offers a comparison in terms of autonomy (grid-to-load energy ratio), RES curtailment (as a share of the total produced on side), opportunities for the rest of domestic energy needs (share of energy stored in the form of hydrogen over the total load demand) and PV capacity firming (the share of PV injections to the grid which create uncertainties), between all scenarios analyzed in this section. In order to gain a broader view of the improvements achieved, the comparisons are carried out for each PV system separately.
5. Conclusions
A wide variety of hydrogen production processes via various feedstocks exist. With water being one of the most abundant and inexhaustible raw materials in the world, and the required electricity input being provided by renewable energy sources, the produced hydrogen via water electrolysis can be probably the cleanest and most sustainable energy carrier that could be used by mankind. Considering the intermittency of renewable potential which requires frequent start-ups and high ramp rates, alkaline electrolysis cells become unfavorable for power-to-hydrogen routes. However, with an appropriate converter able to regulate the power input to the system, the benefits of higher durability, lower capital cost and water treatment avoidance can be exploited.
In this work, a two-switch buck-boost converter is proposed to be embedded between the DC bus of a residential building and alkaline electrolysis unit. Varying the duty cycle of the DC-to-DC conditioning system, the overall efficiency (DC-to-hydrogen) increases from 60% to 72.5%. Based on real data pertaining three PV systems of rated power at 3 kW, 5 kW and 7 kW, and domestic load demand, the performance of the hybrid PV power-to-hydrogen system is compared with feed-in tariff schemes, net-metering mechanisms and power-to-hydrogen in the absence of power conditioning systems. According to the simulation results throughout the year of 2020, enhancements in terms of autonomy, PV capacity firming, renewable curtailment avoidance and excess energy in the form of stored hydrogen to serve the rest of energy sectors (such as heating and transportation) are observed. This gives distribution system operators the opportunity to rationally manage the inflow of renewable sources into the network by prosumers, allowing them to participate in ancillary services market and benefit from cost credits via demand response and/or demand-side management mechanisms.
Funding
This research received no external funding.
Institutional Review Board Statement
Not applicable.
Informed Consent Statement
Not applicable.
Data Availability Statement
Data sharing not applicable.
Conflicts of Interest
The authors declare no conflict of interest.
References
- Nikolaidis, P.; Poullikkas, A. Sustainable Services to Enhance Flexibility in the Upcoming Smart Grids. In Sustaining Resources for Tomorrow; Stagner, J.A., Ting, D.S.K., Eds.; Springer: Berlin/Heidelberg, Germany, 2020; pp. 245–274. [Google Scholar] [CrossRef]
- Nikolaidis, P.; Chatzis, S.; Poullikkas, A. Life cycle cost analysis of electricity storage facilities in flexible power systems. Int. J. Sustain. Energy 2019, 38, 752–772. [Google Scholar] [CrossRef]
- Nikolaidis, P.; Poullikkas, A. A comparative overview of hydrogen production processes. Renew. Sustain. Energy Rev. 2017, 67, 597–611. [Google Scholar] [CrossRef]
- Oldenbroek, V.; Wijtzes, S.; Blok, K.; van Wijk, A.J. Fuel cell electric vehicles and hydrogen balancing 100 percent renewable and integrated national transportation and energy systems. Energy Convers. Manag. X 2021, 9, 100077. [Google Scholar] [CrossRef]
- Bareiß, K.; de la Rúa, C.; Möckl, M.; Hamacher, T. Life cycle assessment of hydrogen from proton exchange membrane water electrolysis in future energy systems. Appl. Energy 2019, 237, 862–872. [Google Scholar] [CrossRef]
- Ajanovic, A.; Haas, R. Prospects and impediments for hydrogen and fuel cell vehicles in the transport sector. Int. J. Hydrogen Energy 2021, 46, 10049–10058. [Google Scholar] [CrossRef]
- Farahani, S.S.; Van Der Veen, R.; Oldenbroek, V.; Alavi, F.; Lee, E.H.P.; Van De Wouw, N.; Van Wijk, A.; De Schutter, B.; Lukszo, Z. A Hydrogen-Based Integrated Energy and Transport System: The Design and Analysis of the Car as Power Plant Concept. IEEE Syst. Man Cybern. Mag. 2019, 5, 37–50. [Google Scholar] [CrossRef] [Green Version]
- Yamada, E.; Mashiba, T. Development of Technical Regulations for Fuel Cell Motorcycles in Japan—Hydrogen Safety. World Electr. Veh. J. 2019, 10, 48. [Google Scholar] [CrossRef] [Green Version]
- Bendary, A.F.; Ismail, M.M. Battery Charge Management for Hybrid PV/Wind/Fuel Cell with Storage Battery. Energy Procedia 2019, 162, 107–116. [Google Scholar] [CrossRef]
- Stern, A.G. A new sustainable hydrogen clean energy paradigm. Int. J. Hydrogen Energy 2018, 43, 4244–4255. [Google Scholar] [CrossRef]
- Maleki, A.; Rosen, M.A.; Pourfayaz, F. Optimal Operation of a Grid-Connected Hybrid Renewable Energy System for Residential Applications. Sustainability 2017, 9, 1314. [Google Scholar] [CrossRef] [Green Version]
- Anifantis, A.S.; Colantoni, A.; Pascuzzi, S.; Santoro, F. Photovoltaic and Hydrogen Plant Integrated with a Gas Heat Pump for Greenhouse Heating: A Mathematical Study. Sustainability 2018, 10, 378. [Google Scholar] [CrossRef] [Green Version]
- Lewandowska-Bernat, A.; Desideri, U. Opportunities of Power-to-Gas technology. Energy Procedia 2017, 105, 4569–4574. [Google Scholar] [CrossRef]
- Liu, W.; Wang, D.; Yu, X.; Jia, H.; Wang, W.; Yang, X.; Zhi, Y. Optimal Scheduling of Multi-Source Microgrid Considering Power to Gas Technology and Wind Power Uncertainty. Energy Procedia 2017, 143, 668–673. [Google Scholar] [CrossRef]
- Li, B.; Roche, R.; Paire, D.; Miraoui, A. Sizing of a stand-alone microgrid considering electric power, cooling/heating, hydrogen loads and hydrogen storage degradation. Appl. Energy 2017, 205, 1244–1259. [Google Scholar] [CrossRef] [Green Version]
- Suresh, V.; Muralidhar, M.; Kiranmayi, R. Modelling and optimization of an off-grid hybrid renewable energy system for electrification in a rural areas. Energy Rep. 2020, 6, 594–604. [Google Scholar] [CrossRef]
- Kebede, M.H.; Beyene, G.B. Feasibility Study of PV-Wind-Fuel Cell Hybrid Power System for Electrification of a Rural Village in Ethiopia. J. Electr. Comput. Eng. 2018, 2018, 4015354. [Google Scholar] [CrossRef]
- Acakpovi, A.; Adjei, P.; Nwulu, N.; Asabere, N.Y. Optimal Hybrid Renewable Energy System: A Comparative Study of Wind/Hydrogen/Fuel-Cell and Wind/Battery Storage. J. Electr. Comput. Eng. 2020, 2020, 1756503. [Google Scholar] [CrossRef]
- Rezk, H.; Sayed, E.; Al-Dhaifallah, M.; Obaid, M.; El-Sayed, A.H.M.; Abdelkareem, M.A.; Olabi, A. Fuel cell as an effective energy storage in reverse osmosis desalination plant powered by photovoltaic system. Energy 2019, 175, 423–433. [Google Scholar] [CrossRef] [Green Version]
- Ge, P.; Hu, Q.; Wu, Q.; Dou, X.; Wu, Z.; Ding, Y. Increasing operational flexibility of integrated energy systems by introducing power to hydrogen. IET Renew. Power Gener. 2020, 14, 372–380. [Google Scholar] [CrossRef]
- Zappa, W.; Junginger, M.; Broek, M.V.D. Is a 100% renewable European power system feasible by 2050? Appl. Energy 2019, 233–234, 1027–1050. [Google Scholar] [CrossRef]
- Mathiesen, B.V.; Lund, H.; Karlsson, K.B. 100% Renewable energy systems, climate mitigation and economic growth. Appl. Energy 2011, 88, 488–501. [Google Scholar] [CrossRef]
- Connolly, D.; Lund, H.; Mathiesen, B.; Leahy, M. The first step towards a 100% renewable energy-system for Ireland. Appl. Energy 2011, 88, 502–507. [Google Scholar] [CrossRef]
- Tezer, T.; Yaman, R.; Yaman, G. Evaluation of approaches used for optimization of stand-alone hybrid renewable energy systems. Renew. Sustain. Energy Rev. 2017, 73, 840–853. [Google Scholar] [CrossRef]
- Diesendorf, M.; Elliston, B. The feasibility of 100% renewable electricity systems: A response to critics. Renew. Sustain. Energy Rev. 2018, 93, 318–330. [Google Scholar] [CrossRef]
- Singh, A.; Baredar, P.; Gupta, B. Techno-economic feasibility analysis of hydrogen fuel cell and solar photovoltaic hybrid renewable energy system for academic research building. Energy Convers. Manag. 2017, 145, 398–414. [Google Scholar] [CrossRef]
- Schmidt, O.; Gambhir, A.; Staffell, I.; Hawkes, A.; Nelson, J.; Few, S. Future cost and performance of water electrolysis: An expert elicitation study. Int. J. Hydrogen Energy 2017, 42, 30470–30492. [Google Scholar] [CrossRef]
- Chi, J.; Yu, H. Water electrolysis based on renewable energy for hydrogen production. Chin. J. Catal. 2018, 39, 390–394. [Google Scholar] [CrossRef]
- Dawood, F.; Shafiullah, G.; Anda, M. Stand-Alone Microgrid with 100% Renewable Energy: A Case Study with Hybrid Solar PV-Battery-Hydrogen. Sustainability 2020, 12, 2047. [Google Scholar] [CrossRef] [Green Version]
- Nikolaidis, P.; Poullikkas, A. A comparative review of electrical energy storage systems for better sustainability. J. Power Technol. 2011, 97, 220–245. [Google Scholar]
- Chakik, F.E.; Kaddami, M.; Mikou, M. Effect of operating parameters on hydrogen production by electrolysis of water. Int. J. Hydrogen Energy 2017, 42, 25550–25557. [Google Scholar] [CrossRef]
- Samy, M.; Barakat, S.; Ramadan, H. A flower pollination optimization algorithm for an off-grid PV-Fuel cell hybrid renewable system. Int. J. Hydrogen Energy 2019, 44, 2141–2152. [Google Scholar] [CrossRef]
- Jung, H.Y.; Kim, S.H.; Moon, B.; Lee, S.-H. A New Circuit Design of Two-Switch Buck-Boost Converter. IEEE Access 2018, 6, 47415–47423. [Google Scholar] [CrossRef]
- Martinez, D.; Zamora, R. MATLAB simscape model of an alkaline electrolyser and its simulation with a directly coupled PV module. Int. J. Renew. Energy Res. 2018, 8, 552–560. [Google Scholar]
- Demir, N.; Kaya, M.F.; Albawabiji, M.S. Effect of pulse potential on alkaline water electrolysis performance. Int. J. Hydrogen Energy 2018, 43, 17013–17020. [Google Scholar] [CrossRef]
- Burton, N.; Padilla, R.; Rose, A.; Habibullah, H. Increasing the efficiency of hydrogen production from solar powered water electrolysis. Renew. Sustain. Energy Rev. 2021, 135, 110255. [Google Scholar] [CrossRef]
Figure 1.
Two-switch buck-boost (TSBB) paradigm.

Figure 2.
Proposed hybrid PV power-to-hydrogen configuration.

Figure 3.
Annual domestic load demand.

Figure 4.
Seasonal variation in domestic load demand.

Figure 5.
Seasonal PV contribution of: (a) 3 kW; (b) 5 kW; and (c) 7 kW systems.

Figure 6.
Overall power-to-hydrogen efficiency for: (a) T = 15 °C; (b) T = 20 °C; and (c) T = 25 °C.
Figure 6.
Overall power-to-hydrogen efficiency for: (a) T = 15 °C; (b) T = 20 °C; and (c) T = 25 °C.

Figure 7.
Simulation results in the absence of a power conditioning system.

Figure 8.
Demonstration of the proposed TSBB-converter experimental setup.

Figure 9.
Simulation results in the presence of TSBB converter.

Figure 10.
Overall comparisons for different metrics pertaining: (a) 3 kW; (b) 5 kW; and (c) 7 kW PV systems.
Figure 10.
Overall comparisons for different metrics pertaining: (a) 3 kW; (b) 5 kW; and (c) 7 kW PV systems.


Table 1.
Buck-boost switch operation modes.
| Mode | M1 | M2 | D1 | D2 | Vo |
|---|---|---|---|---|---|
| Buck | On | Off | Off | On | |
| Off | Off | On | Off | ||
| Boost | On | On | Off | Off | |
| On | Off | Off | On | ||
| Buck-Boost | Off | On | Off | Off | |
| Off | Off | On | Off |
Table 2.
Consumption and usage of the considered appliances.
| Appliance | Power (W) | Consumption (kWh) | Energy Category | Operation Time |
|---|---|---|---|---|
| Washing machine | 1020 | 2.14 | A | 2.1 h |
| Dish washer | 1050 | 1.5 | A | 86 min |
| Dryer | 4300 | 4.3 | C | 1 h |
| Refrigerator | 90 | 1.35 | B | 24 h |
| Freezer | 110 | 1.65 | A | 24 h |
| Ceramic hob | 2000 | 2 | A | 1 h |
| Electric oven | 890 | 0.89 | A | 1 h |
| Toaster | 1500 | 0.75 | - | 30 min |
| Mixer | 1200 | 0.6 | - | 30 min |
| Electric iron | 2400 | 2.4 | - | 1 h |
| LCD TV set | 200 | 0.8 | - | 4 h |
| AC unit 12,000 BTU | 3519 | 10.557 | A | 3 h |
| AC unit 22,000 BTU | 6452 | 12.904 | A | 2 h |
| Blow dryer | 2000 | 1 | - | 30 min |
| Water heater | 4000 | 4 | - | 1 h |
| Vaccum cleaner | 2000 | 2 | - | 1 h |
| Computer | 300 | 0.6 | - | 2 h |
| Printer | 150 | 0.05 | - | 20 min |
| Stereo sytem | 60 | 0.06 | - | 1 h |
Publisher’s Note: MDPI stays neutral with regard to jurisdictional claims in published maps and institutional affiliations. |
© 2022 by the author. Licensee MDPI, Basel, Switzerland. This article is an open access article distributed under the terms and conditions of the Creative Commons Attribution (CC BY) license (https://creativecommons.org/licenses/by/4.0/).
Share and Cite
MDPI and ACS Style
Nikolaidis, P. Pulsed-Supplied Water Electrolysis via Two-Switch Converter for PV Capacity Firming. Electricity 2022, 3, 131-144. https://doi.org/10.3390/electricity3010008
AMA Style
Nikolaidis P. Pulsed-Supplied Water Electrolysis via Two-Switch Converter for PV Capacity Firming. Electricity. 2022; 3(1):131-144. https://doi.org/10.3390/electricity3010008
Chicago/Turabian StyleNikolaidis, Pavlos. 2022. "Pulsed-Supplied Water Electrolysis via Two-Switch Converter for PV Capacity Firming" Electricity 3, no. 1: 131-144. https://doi.org/10.3390/electricity3010008