In this post, we can compare countries on the left – right political spectrum and graph the trends.
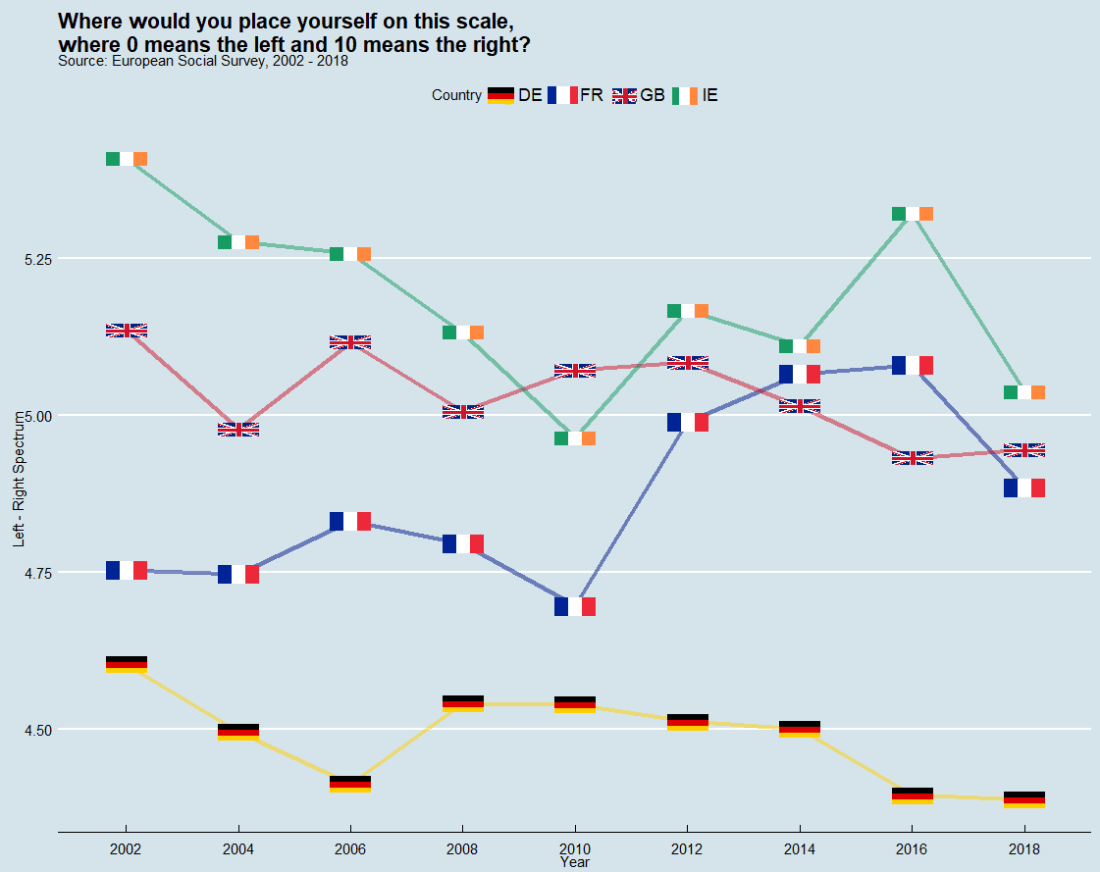
In the European Social Survey, they ask respondents to indicate where they place themselves on the political spectrum with this question: “In politics people sometimes talk of ‘left’ and ‘right’. Where would you place yourself on this scale, where 0 means the left and 10 means the right?”
Click here to read how to download data from the European Social survey.
round <- import_all_rounds()Extract all the lists. I just want three of the variables for my graph.
r1 <- round[[1]]

r1 <- data.frame(country = r1$cntry, round= r1$essround, lrscale = r1$lrscale)
Do this for all the data.frames and rbind() them all together.
round_df <- rbind(r1, r2, r3, r4, r5, r6, r7, r8, r9)Convert all the variables to suitable types:
round_df$country <- as.factor(round_df$country)
round_df$round <- as.numeric(round_df$round)
round_df$lrscale <- as.numeric(round_df$lrscale)
Next we find the mean score for all respondents in each of the countries for each year.
round_df %>%
  dplyr::filter(!is.na(lrscale)) %>%
  dplyr::group_by(country, round) %>%
  dplyr::mutate(mean_lr = mean(lrscale)) -> round_df
We keep only one of the values for each country at each survey year.
round_df <- round_df[!duplicated(round_df$mean_lr),]
Create a vector of hex colors that correspond to the countries I want to look at: Ireland, France, the UK and Germany.
my_palette <- c( "DE" = "#FFCE00", "FR" = "#001489", "GB" = "#CF142B", "IE" = "#169B62")
And graph the plot:
library(ggthemes, ggimage)

lrscale_graph <- round_df %>%
  dplyr::filter(country == "IE" | country == "GB" | country == "FR" | country == "DE") %>%
  ggplot(aes(x= round, y = mean_lr, group = country)) +
  geom_line(aes(color = factor(country)), size = 1.5, alpha = 0.5) +
  ggimage::geom_flag(aes(image = country), size = 0.04) +
  scale_color_manual(values = my_palette) +
  scale_x_discrete(name = "Year", limits=c("2002","2004","2006","2008","2010","2012","2014","2016","2018")) +
  labs(title = "Where would you place yourself on this scale,\n where 0 means the left and 10 means the right?",
       subtitle = "Source: European Social Survey, 2002 - 2018",
       fill="Country",
       x = "Year",
       y = "Left - Right Spectrum")

lrscale_graph + guides(color=guide_legend(title="Country")) + theme_economist()

